University of Southern Queensland
Faculty of Health, Engineering and Sciences
Using Engineering Cementitious Composites as an
adhesive for near-surface mounted FRP bars
strengthening concrete/masonry structures
A dissertation submitted by
Mr. Jared Hawkins
Student Number
in fulfilment of the requirements of
ENG4111/ENG 4112 Research Project
towards the degree of
Bachelor of Engineering (Honours) (Civil)
ii
ABSTRACT
iii
University of Southern Queensland
Faculty of Health, Engineering and Sciences
ENG4111/ENG4112 Research Project
Limitations of Use
The Council of the University of Southern Queensland, its Faculty of Health, Engineering & Sciences, and the staff of the University of Southern Queensland, do not accept any responsibility for the truth, accuracy or completeness of material contained within or associated with this dissertation.
Persons using all or any part of this material do so at their own risk, and not at the risk of the Council of the University of Southern Queensland, its Faculty of Health, Engineering & Sciences or the staff of the University of Southern Queensland.
iv
University of Southern Queensland
Faculty of Health, Engineering and Sciences
ENG4111/ENG4112 Research Project
Certification of Dissertation
I certify that the ideas, designs and experimental work, results, analyses and conclusions set out in this dissertation are entirely my own effort, except where otherwise indicated and acknowledged.
I further certify that the work is original and has not been previously submitted for assessment in any other course or institution, except where specifically stated.
J. Hawkins 001016936
__________________ Signature
13th October 2016 __________________
v
ACKNOWLEDGEMENTS
I would like to thank my supervisor, Associate Professor Dr. Yan Zhuge for her support and guidance during the completion of this project.
In addition I would like to thank Darren Lutze from Inconmat Pty Ltd for donating the VROD fibre reinforced plastic reinforcing rod and Wayne Crowell from the Centre for Excellence in Engineered Fibre Composites for his assistance during the testing phase of this project.
Finally I thank my family for their support throughout the duration of this project Jared Hawkins
vi
CONTENTS
Abstract ... ii
List of figure ... x
List of Tables ... x
Nonmenclature ... xiii
1 Project Introduction ... 1
1.1 Limits of Current Studies ... 2
1.2 Project Aim ... 2
1.3 Research Objectives ... 3
1.4 Beyond Scope... 3
1.5 Expected Outcomes and Benefits ... 4
2 Literature Review ... 5
2.1 Infrastructure Maintenance Requirement. ... 5
2.2 Retrofitted Strengthening Systems ... 6
2.2.1 Surface mounted/Externally Bonded Systems ... 6
2.3 Other Retro fit systems ... 9
2.4 Near Surface Mounted Systems ... 9
How a near surface mounted system works. ... 11
Applications ... 11
2.4.1 Flexural Strength ... 12
2.4.2 General Failure Modes of NSM systems ... 13
2.5 Engineered Cementitious Composites ... 18
2.6 Finite Element Analysis ... 21
2.6.1 ECC Models ... 21
2.6.2 Interfacial Bonds ... 22
2.7 Literature Review Summary ... 23
vii
3.1 Experimental Analysis ... 24
3.1.1 Method of test ... 24
3.2 Direct Shear Test Design – Sample ... 25
3.2.1 FRP Rod ... 25
3.2.2 Concrete Prism ... 25
3.2.3 Final dimensions for prism. ... 28
3.2.4 Construction of Base Prism ... 28
3.2.5 Engineered Cementitious Composite. ... 30
3.2.6 ECC Materials ... 32
3.2.7 Building the samples ... 33
3.2.8 Tensile Testing ... 34
3.2.9 Design of Testing Base ... 35
3.3 Dye penetration ... 37
3.3.1 Method ... 37
3.4 Post processing of raw data ... 38
3.4.1 Correction for initial settlement ... 38
3.4.2 Example of Correction method Using Sample ECC3-1 ... 38
3.4.3 Correction for Elongation in the FRP ... 39
3.4.4 Calculation of Bond Stress ... 40
4 Results ... 41
4.1 Sample Set C1 Summary Results ... 41
4.1.1 Discussion ... 41
4.2 Sample Set C1 Detailed Results ... 43
4.3 Sample Set C1 Graphical Results. ... 43
4.4 Sample Set ECC1 Summary Results ... 46
4.4.1 Discussion ... 46
viii 4.5.1 Sample Set ECC1 Force/Slip and Bond Stress/Strain
Relationships ... 50
4.6 Sample Set ECC2 Summary Results ... 53
4.6.1 Discussion ... 53
4.7 Sample Set ECC2 Detailed Results... 56
4.7.1 Sample Set ECC2 Force/Slip and Bond Stress/Strain Relationships ... 57
4.8 Sample Set ECC3 Summary Results ... 60
4.8.1 Discussion ... 60
4.9 Sample Set ECC3 Detailed Results... 62
4.9.1 Sample Set ECC3 Load/Slip and Bond Stress/Strain Relationships 62 4.10 Sample Set ECC4 Summary Results ... 63
4.10.1 Discussion ... 63
4.11 Sample Set ECC4 Detailed Results ... 65
4.11.1 Sample Set ECC4 Load/Slip and Bond Stress/Strain Relationships 66 4.12 Additional Data on ECC4-1 ... 67
4.12.1 Discussion ... 67
4.12.2 ECC4-1B Load/Slip and Bond Stress/Strain Relationships ... 68
4.13 Summary of results ... 68
5 Discussion of results. ... 70
5.1 Bond Strength Results ... 70
5.1.1 Comparison to previous studies ... 70
5.1.2 Impact of fly ash on cohesive bond ... 71
5.1.3 Impact of rheology on fibre distribution ... 73
5.2 Workability of wet adhesives ... 74
5.3 Bond Strength Prediction ... 75
5.3.1 NSM Potential Bond Strength – Zhang Model ... 75
ix
6.1 Key findings ... 79
6.1.1 De-bonding at the ECC/FRP reinforcement interface. ... 79
6.1.2 De-bonding between the sand coating and the ECC1 adhesive. ... 79
6.1.3 Workability ... 80
6.2 Future research ... 80
6.3 Closing Remark ... 81
7 References ... 82
Appendix 1 – Project Specification ... 86
Appendix B – Project Plan ... 88
Appendix C – Mix Design Calculations ... 93
Appendix 4 – Concrete Prism Test Results ... 97
Appendix 5 – Material Data Sheet – V.Rod ... 99
Appendix 6 – PVA Fibre Data Sheet ... 101
x
LIST
Figure 2-1 Surface Mounted CFRP Reinforcing, Caswell Drive, Canberra ... 7
Figure 2-2 Surface Mounted Reinforcing Typical Arrangement ... 7
Figure 2-3 De-bonding failure of FCRM, note the reinforcing strip protruding from the base of the beam (Ombres 2012) ... 8
Figure 2-4 Near Surface Mounted Reinforcing Typical Arrangement ... 10
Figure 2-5 Typical Near Surface Mounted Placements ... 11
Figure 2-6 Load deflection curves from Sharaky study, CB = Control Beam remainder are NSM reinforced with alternate combinations of epoxy and CFRP reinforcement. (Sharaky et al. 2014) ... 12
Figure 2-7 De-bonding Origins in NSM Systems (Coelho et al. 2015) ... 14
Figure 2-8 NSM De bonding classifications (De Lorenzis & Teng 2007) ... 15
Figure 2-9 Bond Stress - Slip Relationship (Hong & Park 2012) ... 16
Figure 2-10 Shear Stress/Strain Test results showing Steel fibre ECC(DRECC) with excellent shear strength and PE Fibre ECC with excellent ductility (SPECC). (Li et al. 1994) ... 20
Figure 2-11 Comparison of Numerical Model and Experimental results for Tensile testing of ECC. (Kunieda et al. 2011) ... 21
Figure 3-1 Base Prism ... 28
Figure 3-2 Prism Molds - Ready for Casting ... 28
Figure 3-3 Concrete Testing On Prisms ... 29
Figure 3-4 Base Prisms Cast ... 29
Figure 3-5 Prisms Stripped ready for final notch detailing. ... 30
Figure 3-6 Prism and reinforcing rod setup ready for ECC adhesive. The Prisms were washed thoroughly prior to remove any dust that may affect the bond strength. ... 33
Figure 3-7 All materials ready for mixing. Note: syringe was used to measure out super plasticiser. ... 34
Figure 3-8 Completed Specimen shortly after ECC pour. ... 34
Figure 3-9 Tensile Test Machine MTS Insite 100 (MTS 2011) ... 35
Figure 3-10 Test Base, Isometric View. ... 36
Figure 3-11 Testing Base ... 37
xi
Figure 4-1 Cover splitting in Sample C1-1 ... 42
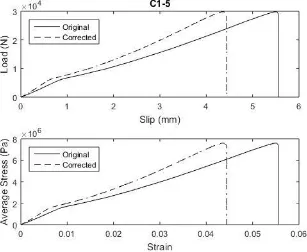
Figure 4-2 Load/Slip & Stress/Strain Relationship, Sample C1-4 ... 45
Figure 4-3 Sample Set ECC1 Typical Failure Mode - Brittle ... 48
Figure 4-4 ECC1 FRP bar showing sand coating de-bonding ... 48
Figure 4-5 Cross Section of ECC1 sample showing dense adhesive and no apparent air voids. ... 49
Figure 4-6 Load/Slip & Stress/Strain Relationship, Sample ECC1-1 ... 50
Figure 4-7 Load/Slip & Stress/Strain Relationship, Sample ECC1-2 ... 50
Figure 4-8 Load/Slip & Stress/Strain Relationship, Sample ECC1-3 ... 51
Figure 4-9 Load/Slip & Stress/Strain Relationship, Sample ECC1-4 ... 51
Figure 4-10 Load/Slip & Stress/Strain Relationship, Sample ECC1-5 ... 52
Figure 4-11 Dye Penetration - ECC2-4 (Left) ECC2-2 (Right) ... 55
Figure 4-12 ECC4 samples showing good of ECC on external facing side and poor bond on internal facing side. ... 55
Figure 4-13 ECC2-2 Section View ... 56
Figure 4-14 Load/Slip & Stress/Strain Relationship, Sample ECC2-1 ... 57
Figure 4-15 Load/Slip & Stress/Strain Relationship, Sample ECC2-2 ... 57
Figure 4-16 Load/Slip & Stress/Strain Relationship, Sample ECC2-3 ... 58
Figure 4-17 Load/Slip & Stress/Strain Relationship, Sample ECC2-4 ... 58
Figure 4-18 Load/Slip & Stress/Strain Relationship, Sample ECC2-5 ... 59
Figure 4-19 Sample 3-1 Dye Penetration ... 61
Figure 4-20 Sample ECC3-1 Section View ... 61
Figure 4-21 Load/Slip & Stress/Strain Relationship, Sample ECC3-1 ... 62
Figure 4-22 Load/Slip & Stress/Strain Relationship, Sample ECC3-1 ... 63
Figure 4-23 ECC4 Thixotropic Consistency ... 64
Figure 4-24 Sample ECC4-2 Dye Penetration ... 65
Figure 4-25 Sample ECC4-1 FRP rod after extraction from ECC4 adhesive. ... 65
Figure 4-26 Load/Slip & Stress/Strain Relationship, Sample ECC4-1A ... 66
Figure 4-27 Load/Slip & Stress/Strain Relationship, Sample ECC4-2 ... 66
Figure 4-28 Load/Slip & Stress/Strain Relationship, Sample ECC4-1B ... 68
Figure 4-29 ECC1 Regression Analysis ... 69
Figure 4-30 ECC2 Regression Analysis ... 69
Figure 5-1 a) Tensile Strain/VMA content relationship. b) Tensile strength/VMA content relationship. (Li & Li 2012). ... 74
xii
LIST OF TABLES
Table 3-1 Adhesive mix designs ... 31
Table 3-2 ECC Characteristics – Previous Studies ... 32
Table 3-3 Samples Summary ... 32
Table 4-1 Sample Set C1 Quantitative Result Summary ... 41
Table 4-2 Sample Set C1 Qualitative Observations ... 41
Table 4-3 Sample Set C1 Detailed Results ... 43
Table 4-4 Sample Set ECC1 Quantitative Results Summary ... 46
Table 4-5 Sample Set ECC1 Qualitative Observations ... 46
Table 4-6 Sample Set ECC1 Detailed Results ... 49
Table 4-7 Sample Set ECC2 Quantitative Results... 53
Table 4-8 Sample Set ECC2 Qualitative Observations ... 53
Table 4-9 Sample Set ECC2 Detailed Results ... 56
Table 4-10 Sample Set ECC3 Quantitative Results Summary ... 60
Table 4-11 Sample Set ECC3 Qualitative Observations ... 60
Table 4-12 Sample Set ECC3 Detailed Results ... 62
Table 4-13 Sample Set ECC4 Quantitative Results Summary ... 63
Table 4-14 Sample Set ECC4 Qualitative Observations ... 63
Table 4-15 Sample Set ECC4 Detailed Results ... 65
Table 4-16 ECC4-1B Detailed Result ... 67
xiii
NONMENCLATURE
a’e edge distance, measured from the centre of the reinforcing bar to the
edge of concrete substrate
𝐴 Area
𝐴𝑓𝑟𝑝 Cross Sectional Area of FRP Reinforcement (excluding sand
coating)
𝐶𝑓𝑎𝑖𝑙𝑢𝑟𝑒 Cross-sectional contour of the failure surface, i.e. the perimeter of
the groove
CFRP Carbon Fibre Reinforced Plastic
d nominal diameter of reinforcing bar (i.e. pultruded GFRP excluding the sand coating)
dr outside diameter of the reinforcing bar 𝐸 Modulus of Elasticity
𝐸𝑓𝑟𝑝 Tensile modulus of FRP reinforcement F.O.S. Factor of Safety
f’c Characteristics strenght of concrete in compression
FRP Fibre Reinforced Plastic
FRCM fibre reinforced cementitious mortar
𝐺𝑓 Interfacial fracture energy
GFRP Glass Fibre Reinforced Plastic
G.P. General Purpose Fillet Weld
𝑙 length
xiv
𝐿𝑒𝑔 effective length for groove
NSM Near Surface Mount
P Applied Load/Force
𝑃𝑢 Predicted Bond Strength R2 Coefficient of determination
s slip
VMA Viscosity Modifying Agent
𝛽𝐿 Bonded length reduction factor
𝛾 groove depth to width ratio
𝜎 stress
∆𝑙 change in length
𝜀 strain
𝜂 fracture mechanics parameter
𝜏𝑐𝑚𝑎𝑥 max stress at failure plane in concrete substrate
𝜏𝑢𝑙𝑡 ultimate bond stress, measured at the adhesive/reinforcement
Project Introduction 1
1
PROJECT INTRODUCTION
While the first instance of near surface mounted (NSM) strengthening was documented in 1949, it is only since the early 2000’s that NSM has experienced a resurgence in research attention. This may be due to the availability of fibre reinforced plastic (FRP) reinforcement which makes retrofitting existing structures much easier due to its low weight and high strength properties. It may also be due to the ever increasing volume of structures which require strengthening. It is most likely a combination of both factors. Engineered Cementitious composites (ECC) are coming to a point in their research lifecycle where development where their physical characteristics and potential benefits of ECC are well known and backed up by significant experimental data. It is now necessary for research to be conducted to identify real world applications and prove ECC a valid competitor to current industry norms. It is essential that ECC demonstrates comparable strength and durability as well as offering at least a material cost benefit. ECC is a generic term for cementitious matrix reinforced with any fibre, however in this study PVA fibres will be used. This will allow the study to leverage multiple works by Li and Hesse in an attempt to reduce the volume of testing required.
Project Introduction 2 ECC compared to traditional cementitious mortar will demonstrate characteristics similar to epoxy groove filler, avoiding brittle failure.
Victor C. Li, one of the leading researchers into ECC, has suggested in his paper “Engineered Cementitious Composites for Structural Applications” (Li & Kanda 1998) that ECC could be a suitable replacement for high strength concrete where reinforcement and concrete come into contact as it is less likely to fracture. As this is the typical use of the adhesive in an NSM system it seems likely that ECC would be a suitable material for this application.
More detailed information will be presented in the literature regarding the demand for strengthening systems, the types of strengthening systems as well as ECC and its desirable material characteristics.
1.1
Limits of Current Studies
After the completion of a comprehensive literature review, there has been no significant studies found which cover the use of ECC as an adhesive in a NSM system to strengthen existing concrete or masonry structures. As such there is an opportunity to complete some unique research which may lead to the identification of suitable application for ECC. One similar study by Afefy et al (Afefy & Mahmoud 2014) was found which was similar. In Afefy’s precast ECC strips were cast into the tension cover zone of a reinforced concrete girder during fabrication of the girder, this is dissimilar to a typical NSM system in that it is not a retrofitted system. However the arrangement of the system is similar in that it replaces concrete with a material which would perform better than concrete when loaded in tension. Afefy’s research was able to demonstrate that the ECC strips lead to improved performance of the affected girders in regard to both serviceability and strength.
1.2
Project Aim
Project Introduction 3 In summary the aims of this project will be to;
Demonstrate that ECC is an effective adhesive for a near surface mounted system by;
o demonstrating ductile failure mode
o providing better bond compared to cementitious paste to the reinforcement due to the increased tensile strength in the ECC
Demonstrate it is a cost effective alternative to epoxy adhesive typically used in a near surface mounted system.
1.3
Research Objectives
The primary objectives for this research project are as follows:
Develop an understanding of various retrofitted strengthening systems
Develop an understanding of ECC and how its micromechanical behaviour affects ductility and tensile strength
Identify suitable test methods
Develop a suitable test strategy with a number of alternative mix designs
Source material characteristics from previous studies relating to the compressive and tensile of comparable ECC materials
Produce technical performance data for ECC binder in bond slip tests
Produce comparison data using cement binder
Assess the performance of ECC as an adhesive in a near surface mounted reinforcing system
1.4
Beyond Scope
Project Introduction 4
1.5
Expected Outcomes and Benefits
Literature Review 5
2
LITERATURE REVIEW
In order to effectively complete this research project a comprehensive literature review was conducted to develop a solid understanding of the materials, systems and theories surrounding near surface mounted strengthening system. Much of the information was sourced from journal articles, research papers as well as commercial catalogues and prior studies completed at University of Southern Queensland.
Upon completion of the literature review it will be possible to provide a thoughtful and educated assessment of the experimental program and confirm if the project objectives have been achieved.
2.1
Infrastructure Maintenance Requirement.
The case for developing a cost effective maintenance/strengthening system for concrete infrastructure is clear. According to the Department of Infrastructure and Regional Development (2014), heavy vehicle traffic is expected to increase by approximately 50% by 2030.
Maintenance expenditure, as a proportion of total investment in infrastructure decreased significantly as the mining boom drove up the investment in new infrastructure and overshadowed the existing underspend in asset maintenance (GHD 2015). Total investment in Infrastructure is expected to decline as the resources boom recedes, but maintenance requirements are expected to remain constant.
Literature Review 6 distribution of industry leads to the need for heavy vehicle transport to transport commodities between production zones to market. Due to the low traffic numbers, the political will to commit limited funding to maintenance programs is lacking.
Some also argue that there is an imbalance in the funding tiers, when local governments are charged with maintaining local infrastructure and state or national governments imposing limits on revenue raising. With these issues in mind it is clear the need to develop a cost competitive solution for strengthening and maintaining infrastructure is critical. Particularly in regional areas with an increase in industry but decrease in population.
A brief investigation into the cost of current surface mounted systems that utilise epoxy binder was conducted. The two main commercial suppliers in Australia are currently Sika with Carbodur and BASF with MasterBrace. Both systems rely upon epoxy binders with high tensile capacity and also high cost, Figure 2-1 shows a Master Brace installation on the soffit of a bridge girder in Canberra.
The cost of epoxy can range from $150 - $300 for 5kg. In comparison 20kg of high performance mortar with similar PVA fibre content is available for $60 for 20kg, a 60-80% saving (based on current commercial rates in Canberra). This demonstrates a significant commercial benefit, particularly when considering large scale projects such as bridges or dams. At present the PVA Fibres used in experimental studies are quite expensive. This is a result of limited demand and production. If an NSM system that utilises a PVA based ECC becomes widely accepted and readily commercially available the cost of the PVA fibre should decrease. This is evident by the low cost and availability of PE and PVA fibres used in decorative concrete.
2.2
Retrofitted Strengthening Systems
The use of retrofitted strengthening systems is not a new concept. Near surface mounted systems have been implemented as early as 1949. The characteristics of Fibre Reinforced Polymers lead to easier installation and greater benefits due to their high strength and low weight, improving the efficacy of retrofitted systems.
2.2.1 Surface mounted/Externally Bonded Systems
Literature Review 7 the structural member, typically with an epoxy adhesive. Once installed the structural members benefit from flexural capacity.
Figure 2-1 Surface Mounted CFRP Reinforcing, Caswell Drive, Canberra
Surface mounted systems have the benefit of being able to be applied to any substrate, as long as it is sound. Improvements in strength have been demonstrated in steel, timber and concrete structures using a variety of reinforcing materials, typically CFRP or GFRP. Other reinforcing materials have been used including steel and fibre reinforced cementitious mortar.
Figure 2-2 Surface Mounted Reinforcing Typical Arrangement
Literature Review 8 and the reinforcing system. This is the expected result for a typical cementitious mortar which has low ductility.
Figure 2-3 De-bonding failure of FCRM, note the reinforcing strip protruding
from the base of the beam (Ombres 2012)
Issues and concerns with Surface mounted systems.
Literature Review 9
2.3
Other Retro fit systems
There are other means of strengthening existing structures such as;
External post tensioning however this comes with its own issues including:
o Steel post tensioning requires maintenance to prevent corrosion
o Significant size & weight add to structure’s dead load
o Costly installation
Member thickening/bolstering
o Typically involves increase in member size
o Complex formwork requirements for upgrades to concretes structures
o Potential damage and instability of structure during reinforcement work These options are not part of this study.
2.4
Near Surface Mounted Systems
Near surface mounted reinforcement has been identified as a potential improvement to the already accepted practice of surface mounted reinforcement. De Lorenzis and Teng ( 2007) observe the following benefits of near surface mounted systems compared to surface mounted systems:
Reduced installation time
o The current required preparation for surface mounted systems on concrete structures is abrasive preparation of the concrete to remove all laitance and spalling concrete. This is often achieved using grit basting, which in turn requires full encapsulation to control environmental impacts.
Less prone to de-bonding from the concrete
o The bonds benefit from the containment of the adhesive within the groove, improving the bond while under load. The containment pressures help to resist de-bonding.
Near surface mounted bars can be more easily anchored to adjacent members
o For example on a fixed support bridge, the reinforcing could be continued into the abutment to provide better reinforcement and help prevent pull-out of the FRP reinforcing.
Better suited to negative moment installation as the reinforcing is protected by the adhesive.
Literature Review 10
NSM systems are less prone to accidental damage, impact or vandalism.
NSM systems using cementitious groove filler also have better fire resistance.
Less visual impact, this makes it particularly good for structures of cultural importance.
A typical near surface mounted system is constructed by cutting a groove into the substrate, then installing a reinforcing member, be it a rod or strip, and using an adhesive/groove filler to hold the reinforcement in place. The earliest documented example of this method of reinforcing was by Asplund in 1949 (Asplund 1949). In this example steel reinforcing bars were installed into the soffit of a bridge girder using cementitious grout in Sweden.
Figure 2-4 Near Surface Mounted Reinforcing Typical Arrangement
Near surface mounted systems are typically used in concrete structures but there has been research into the use of near surface mounted systems on timber structures. Research by Lu et al (2015) demonstrated flexural strength gains ranging from 34-52%. An interesting result in this study was the glulam beams reinforced with the NSM system demonstrated pseudo ductile when the NSM system was installed. This behaviour is a favourable outcome for structural safety. Examples of near surface mounted systems on steel structures were unable to be located.
Literature Review 11
How a near surface mounted system works.
In a simple near surface mounted system, the increase in strength is attributed to the provision of reinforcing in the cover zone of the concrete that produces additional tensile capacity in the tensile zone during bending.
The reinforcing is placed further out from the centroid of the girder and hence the strain is greater on the new reinforcing.
In order for the reinforcing to be fully utilised the bond between the concrete and the reinforcing has to provide sufficient bond length so the tensile capacity of the FRP can be fully utilised. This is the same principle as development length for steel reinforcing used in traditional reinforced concrete structures.
The key issue to overcome is bond slip as the reinforcement is placed closer to the surface and there is less containment material to resist the shear forces presented when the member is loaded, hence the current preference to use epoxy adhesives due to their better tensile and adherent characteristics.
Applications
The application of near surface mounted strengthening systems is broad. It is typically used to improve:
Flexural capacity both negative and positive bending moments;
Shear Capacity;
Axial Compression capacity in columns as well as flexural capacity for columns subject to eccentric axial loads.
Figure 5 below details the placement of typical NSM configuration.
Literature Review 12
2.4.1 Flexural Strength
Typically NSM systems are used to improve flexural capacity of structural members. Improvements can be made to both positive and negative bending capacity in structures. As suggested in section 2.4, NSM systems are much better suited to negative moment applications than surface mounted systems as they are protected from wear.
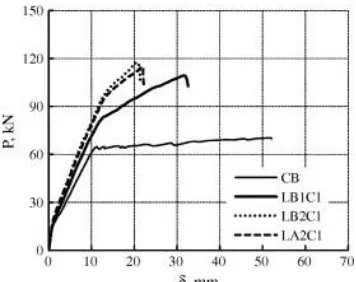
[image:26.595.209.387.263.404.2]Sharaky et al ( 2014) demonstrated that a reinforced concrete beam will see a 66% increase in flexural strength under 4 point bending tests when fitted with near surface mounted CFRP reinforcement. As is evident from Figure 6 below, the peak load in all NSM strengthened systems is significantly higher than the strengthened system.
Figure 2-6 Load deflection curves from Sharaky study, CB = Control Beam
remainder are NSM reinforced with alternate combinations of epoxy and CFRP
reinforcement. (Sharaky et al. 2014)
In addition to flexural strength improvements there has been research into the use of NSM systems to improve shear capacity. Jalali et al ( 2012) conducted an experimental study on the effect of installing NSM CFRP on reinforced concrete girders. In this study Jalali et al were able to demonstrate significant shear capacity increases. Jalali et al also made a comparison to a study by Chen and Teng (2003) who predicted the strength gains of comparable surface mounted FRP using sheets with equivalent fibre content. Jalali et al were able to demonstrate better shear capacity increases compared to Chen & Teng’s predictions. It is suggested that this is a tribute to the better bond behaviour in the NSM system.
Literature Review 13 were then subjected to 3 point loading. The results demonstrated that the beams were able to regain full or partial strength dependant on the level of fire damage and temperature exposure. The critical issue identified by this study was the de-bonding failure between the existing reinforcing steel and concrete caused by the heat exposure. This highlights the importance of the bond behaviour between the concrete and reinforcement.
2.4.2 General Failure Modes of NSM systems
In the instance where a girder has been strengthened by a near surface mounted system there are three general failure modes:
1. Concrete Crushing in the compression zone due to the increased tensile capacity in the tensile zone.
a. Concrete crushing in the compression zone demonstrates that the member does not have sufficient compressive capacity compared to tensile capacity. In this case the reinforcement has not been designed appropriately and the addition of the NSM system has overloaded the compression zone of the beam.
2. Fracture of the reinforcing in tensile zone;
a. Fracturing of the reinforcement suggests the system has been fully utilised and has reached its ultimate capacity. However, if the NSM reinforcing ruptures it is likely that the reinforcing has been
inappropriately designed as it should not fail prior to concrete crushing and steel yielding. If appropriately designed, the FRP should be close to maximum capacity when steel yields. This allows for ductile failure in the member. (Coelho et al. 2015)
3. De-bonding Failure
a. De-bonding failure is typically associated with premature failure and with the proper consideration, the groove detailing, bonded length and adhesive can be designed correctly to ensure sufficient bond. Within the general classification of bond failure there are a number of types of bond failure that can occur.
Literature Review 14 complex analysis to ensure de-bonding does not occur prematurely, therefore concrete crushing and reinforcement rupture will not be discussed further in this paper.
System level de-bonding
For a beam in flexure, de-bonding is likely to develop from cracks in the concrete beam under load. Critical Diagonal Shear Cracks, Flexural Cracks and Shear cracks are typical origins for de-bonding, Figure 7 from Coelho et al (2015) identifies these typical origins.
Figure 2-7 De-bonding Origins in NSM Systems (Coelho et al. 2015)
Local level de-bonding
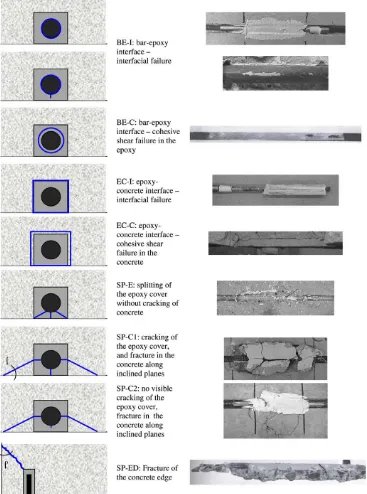
De-bonding at the local level is associated with the material failure. There are two basic types, being:
Cohesive failure, which is a failure within the material, generally associated with internal shear stress.
Adhesive/Interfacial failure. This is an adhesive failure between two dissimilar materials and can occur between the reinforcing and the adhesive, or the
adhesive and substrate.
Literature Review 15
Figure 2-8 NSM De bonding classifications (De Lorenzis & Teng 2007)
Literature Review 16 in the cover material. Understanding how these forces transmit from the tensile force on the reinforcement to shear force within the cover material is critical.
Longitudinal Plane Bond Stress - Slip Relationship FRP/Adhesive
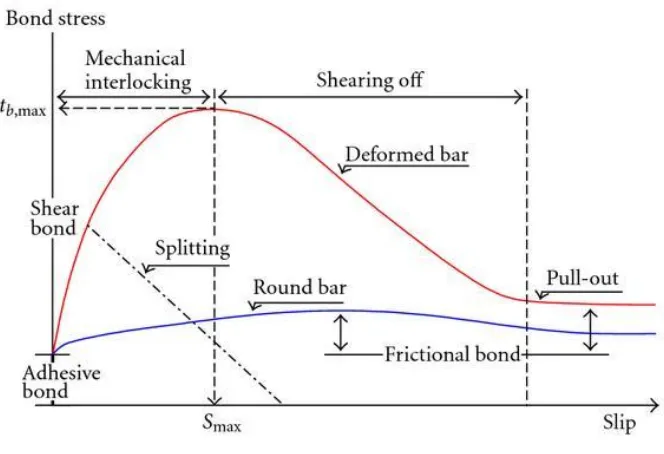
[image:30.595.133.465.388.615.2]The critical component of this study will be to identify the bond slip relationship between the substrate and the reinforcement. This relationship has been studied significantly in regard to concrete and steel reinforcement and is critical in determining the appropriate bond length for reinforcement, typically referred to as development length. There must be sufficient length of bond such that the tensile stress in the reinforcement is equal to or greater than its tensile capacity. If this is not the case, then it is likely that there will be bond failure prior to full utilization of the reinforcement, hence the reinforced concrete member will not perform as expected. This relationship is well understood in traditional reinforced concrete and there are guidelines in the Australian Standards (amongst others) on how to determine development length.
Figure 2-9 Bond Stress - Slip Relationship (Hong & Park 2012)
Literature Review 17
Adhesive Bond – the only adhesive bond will be between the sand coated FRP and the cement matrix. The PVA fibres will not form an adhesive bond to the FRP rod.
Friction Bond – there will be a friction bond between the sand coated FRP and the ECC adhesive.
Mechanical Bond – the Mechanical bond is typically found when using deformed bars, the deformations in the reinforcing bars act as shear keys and convert the shear stresses into tensile and compressive stresses. In the ECC FRP relationship the existence of a mechanical bond is unclear as the FRP is only sand coated, non-deformed. However there may be instances where the PVA fibres interlock with the sand particles and provide some level of mechanical bond. This will become clear in the experimental testing.
By completing experimental analysis using a direct shear test it is hoped that the bond stress – slip relationship will be able to be understood and from this an understanding as to whether ECC has sufficient shear capacity to provide effect bond strength to fully engage the FRP rod.
Transverse Plane
To study the transverse plane, the interaction of the confining pressure, the coefficient of friction and the shear stress at the interfacial bond mush be understood. Material characteristics such as tensile capacity and ductile performance, play a critical role in transverse analysis as well as reinforcement bar treatment, groove preparation and detailing.
Mathematical Models
The goal of experimental research such as this is to produce and validate mathematical models which can predict the bond strength of an NSM system. This in turn leads to the potential to develop models to predict the positive effect on strength and serviceability of a retrofitted structure.
Literature Review 18 that the limiting factor is the original structure and based on this it can be concluded that the introduced reinforcement is fully utilised and strengthening effect maximized. It should be noted however, that this type of failure would be brittle failure, which is contrary to the objectives of this study. As such it is suggested that the goal of the ECC NSM system should be to demonstrate strain hardening prior to cohesive failure of the concrete substrate. This would leverage the safety benefits of the ductility as well as achieving an efficient and effective system.
A bond strength model which is based on a substrate cohesion failure mode was developed by Zhang et al (2014). In this mathematical model the ultimate tensile force in the FRP reinforcement evaluated as a function of bond length, groove detailing, the compressive strength of the concrete substrate and the CFRP characteristics. This model has no input requirements for the groove filler/adhesive as it is only of use when the failure is cohesive failure in the concrete substrate which is induced by the radial pressure from the reinforcement when loaded in tension. Therefore if the failure mode is de-bonding between the FRP and adhesive or adhesive and concrete substrate the model cannot be used.
2.5
Engineered Cementitious Composites
The investigation into engineered cementitious composites started in the late 1990’s. Much of the work completed during this time was produced in some part by Victor C. Li. In 1997 Victor C. Li along with Zhong Lin produced the paper ‘Crack Bridging in Fibre reinforced cementitious composites with slip hardening interfaces’ (Lin & Li 1997). In this study polyethylene fibres were used and concluded that the strain hardening (‘slip hardening’ or ‘pseudo strain hardening’ as noted in the text) is mainly due to the surface abrasion between the fibres and the cement. This is the earliest paper found during the course of this literature review that presents this finding and subsequently leads to many further studies.
Literature Review 19 tensile strength of the PVA fibres. Horikoshi also demonstrated that PVA does not suffer losses in strength from exposure to an alkali environment such as being combined in the cementitious matrix.
Li & Kanda discuss many potential applications for ECC in their 1998 paper ‘Engineered Cementitious Composites for Structural Applications’(Li & Kanda 1998). Li also conducted research into the use of ECC with FRP reinforcement and presented his results in 2002. In the paper ‘FRP reinforced ECC structural members under reversed cyclic loading conditions’, Gregor Fischer and Victor C. Li (2002) concluded that ‘Deformation Compatibility between FRP reinforcement and ECC is found to effectively eliminate interfacial bond stress’. In simple terms, the ECC is able to move with the FRP reinforcement when the reinforcing is under strain and prevent de-bonding and spalling of the ECC cover material. These findings are in line with the expected outcomes of the proposed project.
Literature Review 20
Figure 2-10 Shear Stress/Strain Test results showing Steel fibre ECC(DRECC)
with excellent shear strength and PE Fibre ECC with excellent ductility (SPECC).
(Li et al. 1994)
As is illustrated by Figure 10, DRECC is a steel fibre ECC, and it showed excellent shear capacity, while SPECC, a polyethylene fibre ECC showed excellent ductility, having the greatest failure strain, an order of magnitude greater than Portland concrete.
In order for the ECC to perform as expected the interfacial bond between the cementitious grout and the PVA fibres has to be reduced. As explained by Li, this can be achieved by coating the PVA fibres in an oiling agent. Obviously this process must be tightly controlled. Too much oiling agent and the bridging strength will be reduced and adversely affect the ductility. Too little oiling agent and the fibres will tend to rupture and adversely impact the bridging strength also. Alternatively (or in combination with an oiling agent) Fly ash may be used to reduce the interfacial bond between the PVA fibres and the cement matrix. Fly ash is also effective in reducing the overall toughness of the matrix which aids ductile performance.
Further Potential Benefits.
Literature Review 21 This is of importance to the durability of NSM systems using ECC as epoxy adhesives do not have the same properties and may be prone to damage by UV radiation and alkali environments. If ECC can demonstrate suitable durability it will be more likely adopted.
2.6
Finite Element Analysis
At the inception of this project the aim was to attempt to develop a finite element model of a NSM strengthening system using ECC. Unfortunately it was not possible to complete this component of the work within the time frame, however given the amount of work completed in the research phase of this project it has been included in the literature review as it may inform or guide future research into this field.
While there has been no research into producing a finite element model for a NSM system using ECC, the strategy employed during this literature review was to find finite element models which addressed the component parts of the system, namely models for ECC, models for interfacial bonds between adhesive, FRP and concrete.
2.6.1 ECC Models
Kunieda et al ( 2011) presented a method that accurately simulates a tensile fracture in ECC, this model was compared to experimental results and was found to ‘roughly simulate the mechanical response’.
The Figure 2-11 below is one example if the comparative results from the experiments (Exp.) and the numerical model (Num.).
Figure 2-11 Comparison of Numerical Model and Experimental results for Tensile
Literature Review 22 Figure11 illustrates that Kunieda et al’s (2011) model is representative of the behaviour of ECC, however it is quite conservative in comparison to the observed results. The model uses a spring model to simulate the strain hardening behaviour between cells in the matrix.
2.6.2 Interfacial Bonds
Smith and Teng ( 2001) produced a method to model the interfacial bond between CFRP plates and reinforced concrete structures. This study was focused on surface mounted CFRP reinforcement. Zhang and Teng (2013) were able to present an adaptation of this study that modelled the behaviour of near surface mounted FRP reinforcement. This study presents a comparison between analytical estimates and the finite element model. No experimental comparisons were made.
The finite element analysis literature review to date has highlighted that there seems to be little consideration of friction effect between the concrete and the bonding agent. This boundary tends to be only modelled as a tensile force. Further study into the reasons for this is required as the surface preparation of concrete for structural components such as ground anchors on dams and foundation is considered critical for developing suitable friction factors. It seems strange that the friction effect has been ignored in some models. Biscaia (2015) however demonstrates a bond slip model that utilises the Mohr –Coulomb rupture criterion that defines the maximum bond stress as a function of cohesion, internal friction angle of the interface material and compressive stress. This model then uses dry friction once the bond has ruptured, suggesting that the cohesion replaces the effect of friction.
Literature Review 23
2.7
Literature Review Summary
The demand for cost effective systems to strengthen existing structures is only going to increase. In Australia the demand is driven by its vast transport network and evolving engineering standards that are constantly under review to adapt to changes in the environment and community expectations. Repairing and strengthening existing infrastructure is more sustainable than complete replacement, particularly if the remnants of the previous structure are sent to landfill.
Strengthening systems such as surface mounted and NSM have emerged over the past decade not just in academic study but also commercial application due to their performance, cost benefit and ease of installation. The availability and performance of FRP reinforcement has had a significant impact on the level of uptake of these systems as attempting to install steel reinforcing in this manner is very difficult due to the weight of the steel reinforcing. NSM systems also offer advantages over surface mounted FRP, in particular:
Protection from damage as it is installed in the groove.
Confinement pressure from the groove aides bond strength
Finishes flush with existing substrate so surface treatments are not required prior to final surfacing
The use of ECC as an adhesive in a NSM system has some potential benefits over traditional epoxy binders that this research project aims to explore. The cost benefit of ECC over epoxy binders is a marginal saving when compared to the total cost of installing an NSM system on an existing structure. The durability against ultraviolet radiation of the ECC compared to epoxy binders is of significant benefit. It is hoped that the additional tensile strength of ECC will also be a benefit to an NSM system, improving the overall performance. Finally the ductility of ECC is also expected to be of benefit to the NSM system.
Methodology 24
3
METHODOLOGY
3.1
Experimental Analysis
3.1.1 Method of test
There are a number of ways to test the effectiveness of a near surface mounted system. De Lorenzis and Teng (De Lorenzis & Teng 2007) have discussed the various options and completed a number of studies using the following alternatives:
Bond pull-out test.
Beam flexure test.
Direct shear test.
A Bond pull-out test is the same method as is used to establish required development length for reinforcing bars, typically the bar is cast directly into the base prism rather than being glued in place with an adhesive. While very similar to the elected method of test it is not representative of the system in which the components are used as it is contained on all sides evenly.
A beam flexure test, as detailed by De Lorenzis et al (2002), uses a beam placed under load in 4 point bending. The beam is modified in such a way as to ensure consistent bending around a central hinge at the top of the beam. On one side of the beam the reinforcement is secured with a limited bond length, the other side is fully bonded so as to ensure adequate anchorage such that the side with the limited bond length fails first. While this experimental model more accurately represents the system, De Lorenzis (2002) has demonstrated that results from a simple direct shear test are reliable and consistent with this approach and are much quicker and easier to complete as well as requiring less resources.
The simple direct shear test was selected for this experimental program as it is reliable and relatively cheap and easy to construct samples. It is also much more efficient in terms of resources required to complete the experimental study. There are also significant number of other testing regimes that have used this method which provide data for a comparative assessment of the results.
Methodology 25
3.2
Direct Shear Test Design – Sample
The sample used in a direct shear test consists of a concrete prism, the adhesive and the FRP rod.
3.2.1 FRP Rod
The FRP rod for this project was donated by V.ROD Australia. The rod, #3 GFRP, has a nominal diameter, excluding sand coating of ~10mm. This rod was selected based on availability and was an appropriate size for the other testing equipment. For full characteristics please refer to the specification sheet at Appendix 5. This FRP bar is not deformed, it is however coated in a layer of coarse sand to improve the interfacial bond between the bar and the adhesive. This coating gives the bar a typical physical diameter of 13mm.
Deformed FRP reinforcement is available internationally, however, due to low demand it could not be sourced locally. Another locally available option was CFRP rod produced by Sika. This product has a textured finish generated by a layer of peel ply that is removed before installation. Given the expense of this option and the focus of the study the decision was made to use the V.ROD product.
3.2.2 Concrete Prism
The focus of this test is to determine the bond slip behaviour between the ECC, FRP and concrete prism, as such the design of the concrete prism should be completed in a manner which ensures the results are relevant to the study.
Characteristic strength (f’c)
Two issues govern the selection of concrete strength used in the prism
1. The Tensile strength of the concrete should be sufficient that the bond failure occurs prior to the concrete failure.
2. The characteristic strength should be representative of a typical concrete installation where such a NSM system would be installed.
To satisfy these requirements f’c of 40MPa was selected. A 40MPa mix with 10mm
Methodology 26 During the pour of the base prisms a number of samples were taken to confirm the concrete as specified. It was important the strength of the concrete prism was confirmed as the mathematical models used to predict capacity in the NSM system required accurate substrate concrete strength to determine fracture energy. The max concrete strength at 28 days was 41 MPa. The quality assurance test results are available at Appendix 4.
Groove Detail – Width and depth
Le and Cheng (2013) completed a review of previous studies to develop an understanding of the effects of groove detailing on NSM bond strength. Based on this study the optimum groove dimension should be in the range of 1.5 to 2.5dr, the value selected was 2dr, given
the typical physical diameter was 13mm groove dimensions used was 26mm. Note that the physical diameter of the reinforcing is used in this relationship rather than the nominal diameter of the structural component of the reinforcing rod.
Groove Detail – Edge Distance
The distance from the edge of the concrete to the centre of the FRP reinforcement (a’e) is
a critical dimension in the design of a near surface mounted system. Referred to as edge distance, a’e should be sized so there is no premature failure of the concrete. Lee & Cheng
(2013) references work by Kang et all that suggests an edge distance no less than 40mm to prevent premature failure in the concrete prism. Unfortunately the paper by Kang et al was not able to be sourced prior to the delivery of this report. Based on the summary information provide in Lee and Cheng’s report the minimum edge distance should considered a function of the reinforcement size, the reinforcement type, the strength of the base concrete as well as the groove filling material and dimensions. Hassan & Rizkalla (2004) acknowledge this in their studies, suggesting a minimum edge distance of four times the diameter of the reinforcement. This would suggest an edge distance no less than 52mm. An edge distance of 60mm was selected. This simplified the construction of the base prisms and provided further assurance that there would be no premature failure of the base prism.
Groove Detail – Required Bond length
Methodology 27 One particular research project completed by Yan et al (1999) studied effects of bond length on CFRP rod embedded in a concrete prism using an epoxy grout. This study found that the bond stress increased significantly until the bond length reached 9.1dr, after which
it began to drop off. While this experiment was completed using CFRP and epoxy adhesive, the development of maximum shear stress is linked to the dimensional detail (i.e. nominal diameter of reinforcing rod) and the base prism concrete strength. Based on 9.1dr this would be a 118mm bond length in this system, however the stress values in
Yan’s experiment for the samples with smaller bond lengths than 9.1dr are higher than
the stress values for those with larger bond lengths. This is consistent with other studies (Novidis & Pantazopoulou 2008) that have found a lower bond length (5dr) generates the
critical shear stress at the interfacial zones. The different findings could related back to the type of bars used in each experimental program. In the work by Yan (1999), the bars were either smooth or lightly treated. This resulted in a greater length required before the critical shear stress is generated. Conversely the materials used in Novidis’s (2008) experimental program had deformations along their length providing greater mechanical bond, hence the bonded length required to achieve critical stress is less than a non-deformed bar with little to no surface treatment.
The reinforcing used in this experimental program is coated in a coarse sand, with a nominal aggregate size of 1.5mm. This treatment provides the reinforcement with greater mechanical bond than a smooth or sandblasted bar, but less than a deformed bar. A bonded length of 100mm made construction of the samples much easier, this resulted in a bonded length of 7.7 dr. This is less than that used for smooth bar and greater than that
used for deformed bar. As this is a preliminary study this was deemed sufficiently suitable and one bond length was tested. Variations to bond length may be a suitable progression of this study.
3.2.2.1.1 Anchorage distance
Methodology 28
3.2.3 Final dimensions for prism.
The schematic presented in figure 3-1 details the final dimensions of the concrete prism
Figure 3-1 Base Prism
3.2.4 Construction of Base Prism
The prism molds were designed to cast the notch into the based using a timber 19mm x 19mm void former. The molds were coated in a lanolin based form release agent (Lanotec) to ease stripping. Once poured they were allowed to cure for 7 days in the mold prior to stripping. This ensured appropriate curing and reduced the risk of damaging the prisms during removal from the form.
Figure 3-2 Prism Molds - Ready for Casting
Methodology 29
Figure 3-3 Concrete Testing On Prisms
Figure 3-4 Base Prisms Cast
Methodology 30
Figure 3-5 Prisms Stripped ready for final notch detailing.
3.2.5 Engineered Cementitious Composite.
There has been significant study completed on ECC mix design. In order to reduce the volume of physical testing required for this project and reduce the demand for the Expensive PVA fibres, an exemplary mix design based on the work by Wang & Li(2005) was used in this project. This mix design has also been further in works by Zhuge (2014) and Hesse (2014) so there is a significant amount of experimental data that can be utilised by this research project .
After considering the goals of the research project, four adhesive types were tested.
Sample Set C1 – This samples set will be a simple cementitious paste with no fibres or fly ash. The purpose of this set is to get a simple understanding of the typical failure mode that should be expected using cement paste without any fibre reinforcement and low ductility
Sample Set ECC1 – This sample set is used to compare the capacity and failure mode of exemplary mix design. It is expected that the fibre content will improve tensile capacity but still demonstrate little ductility.
Sample Set ECC2 – This sample set will be based on Wang & Li’s exemplary mix design(Wang & Li 2007). The mix, identified as M45, has been proven to demonstrate the highest ductility of all the PVA based ECC mix designs. The key characteristics are a 1:1.2 cement/fly ash ratio and 2% super plasticiser.
Methodology 31
Sample Set ECC4 – This sample set will be another variation of the M45 mix design. In this case no superplasticiser will be used. It has been noted in some literature that ECC with little or no fly ash content require the super plasticiser to avoid clumping, however it is hoped the high proportion of fly ash in this mix will aide mixing and avoid clumping of the fibres. This variation is being tested to assess the workability of the ECC adhesive rather than the capacity of the NSM system
Expected variations in performance
The ECC is expected to demonstrate a level of ductility, so once peak load is achieved the bond should reduce in a controlled fashion before reaching residual friction stress between the ECC and reinforcement or prism, dependant on the failure mode. A typical cementitious grout will have very little tensile strength and it is expected to demonstrate a brittle failure once peak stress is reached. Therefore it is expected that the failure will be sudden and catastrophic with little or no residual strength. The zero fly ash mix, ECC1, should demonstrate greater tensile strength but little ductility. Wang & Li (2007) has identified that fly ash plays a critical role in the ductility of ECC. Fly ash reduces the cohesive bond between the PVA fibres and the cement matrix, this allows the PVA fibres to slip a little before taking load. This characteristic is critical in achieving a ductile behaviour.
Table 3-1 Adhesive mix designs
Mix ID Cement Water Sand
Super-plasticiser
PVA
Fibre
Cementitious Grout 1 0.25 0.363 2% 0
ECC 1 (No fly ash, reduced ductility)
1 0.25 0.363 2% 2%
ECC 2 (Li M45 Mix fly ash)
1
Ratio of 1:1.2 Cement:fly ash
0.25 0.363 2% 2%
ECC 3 (Reduced S.P. to improve overhead workability)
1
Ratio of 1:1.2 Cement:fly ash
0.25 0.363 0.5 2%
ECC 3 (Zero S.P. to improve overhead workability)
1
Ratio of 1:1.2 Cement:fly ash
Methodology 32 Based on the results of Hesse’s work (Hesse 2014), the ECC2 mix should demonstrate the characteristics as detailed in Table 3-2. The ECC2 mix will be used to compare the experimental results with predicted results based on mathematical models. The other mix designs are to be used to compare failure modes and workability. Further research will be required if these mix designs demonstrate greater performance than the ECC2 mix design. This is beyond the scope of this project.
The amount of superplasticiser should have no effect on the potential strength of the various mix designs, it is simply an admixture utilised to prevent clumping of the fibres. Any variation in strength would be a result of reduced workability and uneven distribution of fibres throughout the ECC adhesive.
Table 3-2 ECC Characteristics – Previous Studies
Engineered Cementitious Composite Characteristics (Hesse 2014)
Compressive Strength (MPa) Ultimate Tensile Strength (MPa)
65 5
3.2.6 ECC Materials
ECC consists of the following
Cement – The cement used in this project was Cement Australia G.P. Cement Powder
Fly ash – The fly ash was also a Cement Australia bagged product.
Sand – The sand used in this was River Sands W9 filter sand. In order to comply with Li’s exemplary mix design the sand had to be sieved further to ensure there were no particles greater than 250 µm.
PVA Fibres – PVA fibres provide the critical tensile capacity and strain hardening characteristics found in ECC materials. The PVA fibres used were Nycon – PVA RECS15
Table 3-3 Samples Summary
Sample Group Number of Samples Adhesive
C 6 Cementitious Grout
ECC1 6 ECC1
ECC2 6 ECC2
ECC3 2 ECC3
Methodology 33
3.2.7 Building the samples
The C and ECC1 samples were made on the 7th April within 1hr and allowed to cure for 28 days prior to testing. The ECC2-4 samples were made on 18th August within 2 hrs of each other.
To ensure a 100mm bond length the reinforcing rod was held in place with extruded polystyrene foam cubes. The foam cubes had 13mm holes drilled, the loaded end cubes had full penetration and the non-loaded end cubes were only drilled 5mm to hold the reinforcing bar. The cubes were set exactly 100mm apart with a silicon sealant used to hold the cubes in place. The sealant also ensured any cement slurry was not lost during curing.
Figure 3-6 Prism and reinforcing rod setup ready for ECC adhesive. The Prisms
were washed thoroughly prior to remove any dust that may affect the bond
strength.
Methodology 34
Figure 3-7 All materials ready for mixing. Note: syringe was used to measure out
super plasticiser.
Once the ECC was thoroughly mixed it was allowed to rest for 5 minutes prior to placement. The ECC was placed from one side carefully to ensure the notch was completely filled and no air pockets introduced underneath the reinforcing rod. A small pointing trowel was used to work the ECC adhesive into the groove and finish off the ECC to a neat finish on top. Discussion on the mixture consistency and workability is included in the results chapter.
Figure 3-8 Completed Specimen shortly after ECC pour.
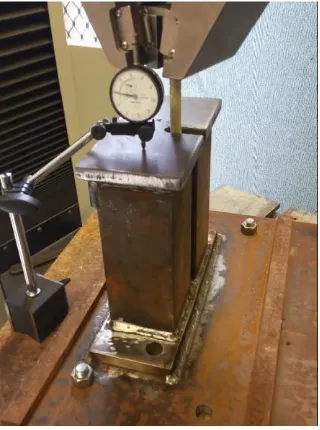
3.2.8 Tensile Testing
Methodology 35
Figure 3-9 Tensile Test Machine MTS Insite 100 (MTS 2011)
Using the Tensile test machine the force and displacement were measured until failure and resistance was 0 or residual stress levels had been reached. The tensile test was completed using displacement control method at 1mm/minute. In order to hold the samples in place a testing frame was designed and fabricated to hold the prism down while allowing free movement of the FRP reinforcement.
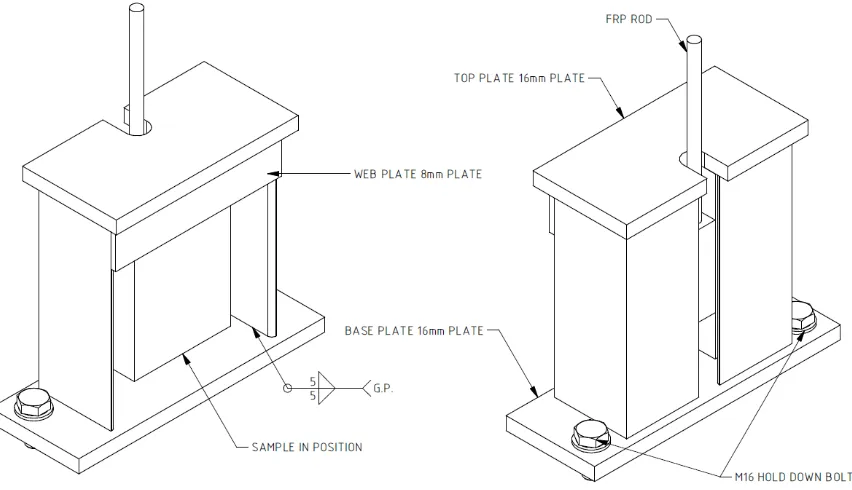
3.2.9 Design of Testing Base
The testing base was designed with a capacity of 80kN, this was based on the maximum tensile strength of the FRP rod. In the event that something unforeseen occurred within the prism and the ECC & concrete did not break, the maximum tensile capacity of the GFRP would become the highest failure load. This is overly conservative, but given the scale of the base it was not un-economical
The uprights were spaced so the sample could be inserted with the FRP rod protruding through the load plate so there would be no need to bolt down the sample. The gap between the uprights also provided a window that would allow observations during the testing. The uprights were fabricated using 90 x 90 equal angle to provide sufficient weld length and also sufficient depth to ensure no eccentricities were introduced when the FRP rod was loaded. Finally, a web plate was welded between the top plate and uprights to prevent any uneven deflection in the top plate under load.
Methodology 36 The base was fabricated using grade 350 steel and a combination of 16mm plate and 90x90x6 Equal angle welded together using 5mm G.P. fillet welds.
Figure 3-10 Test Base, Isometric View.
The Equal angle sections (90x90x6) were selected to match the geometry of the sample, their axial capacity is 240kN each. The critical element in the design was the weld length connecting the uprights to the base plate and the load plate. A quick check of the length of weld connecting the uprights confirms that there is a significant factor of safety in this connection.
Minimum Tensile strength of #3 GFRP V-Rod = 1100Mpa
Nominal Cross Sectional Area = 71.3mm2
Failure load of GFRP = 1100 x 71.3 = 78430N
5mm G.P Fillet weld capacity 0.7kN/mm
Millimetres of 5mm G.P. Fillet weld required = 78.4/0.7 = 112mm
Millimetres of 5mm G.P. Fillet weld completed = 540mm
F.O.S. 4.8
The rig is held to the test base using 2 M16 grade 8.8 bolts which have a tensile capacity of 66.5 kN each, this provides a F.O.S. of 1.7.
Methodology 37 Once installed on the Insite 100 machine, a dial gauge, accurate to 1/100th millimetre was setup to test for deflection between the Insite base plate and the top of the base prism. There was no recorded deflection.
Figure 3-11 Testing Base
3.3
Dye penetration
Upon completion of the testing the samples were subjected to a dye penetration test. This is something typically reserved for steel materials however it was employed to help identify the failure planes within the various samples to try and identify particular patterns. It works on the basis that the dye will find its way by the path of least resistant, and provided the dye is sufficiently low viscosity, it will track through the cracks, staining the areas as is passes through, making it easier to identify the cracks.
3.3.1 Method
Methodology 38 It is important to note that this is not a statistical test method. It is a means to assist observation of the test results by highlighting the cracks and failure planes.
This test was not completed on the C1 sample set as the failure mode was too catastrophic and it would provide no significant input to this research project.
3.4
Post processing of raw data
3.4.1 Correction for initial settlement
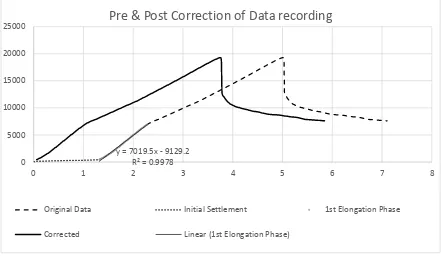
[image:52.595.84.527.328.584.2]With all samples there was a settling in process which included the vice grips getting enough grip as well as the prisms achieving correct bearing onto the load plate of the test base. A two stage process was used to eliminate this false reading and correct all subsequent slip values.
Figure 3-12 Correction of data for initial slip
The process is illustrated in figure 3-12 above. The initial settlement phase was identified visually from the original data plot. It was relatively simple to identify the limits of the initial settlement phase. Once this was removed the first elongation phase was identified and used to determine a line of best fit.
3.4.2 Example of Correction method Using Sample ECC3-1
1. Data points 1 -124 represent the initial settlement
y = 7019.5x - 9129.2 R² = 0.9978 0
5000 10000 15000 20000 25000
0 1 2 3 4 5 6 7 8
Pre & Post Correction of Data recording
Original Data Initial Settlement 1st Elongation Phase
Methodology 39 2. Data points 125 – 215 represent the 1st phase of elongation, from this subset linear regression is used to extract a line of best fit using Microsoft Excel. The quality of the fitted curve is checked using the R squared value, in this case it is 99%. The Resultant equation;
𝑃 = 7019.5𝑠 − 9129.2
3. The Curve needs to originate at 0 so the -9129.2 is dropped;
P = 7019.5𝑠
4. Using this equation and the known force value for the initial value in the first phase of elongation the corrected slip can be calculated;
𝑃 = 7019.5𝑠
442 = 7019.5𝑠
𝑠 = 442 7019.5 𝑠 = 0.063 𝑚𝑚
3.4.3 Correction for Elongation in the FRP
Given there would be significant length in the FRP bar it was elected to use the published tensile modulus to determine the elongation in the bar at a given load and deduct that value from the slip value.
𝜀 =∆𝑙 𝑙 =
𝜎
𝐸 𝑡ℎ𝑒𝑟𝑒𝑓𝑜𝑟𝑒
∆𝑙 = 𝑙 (𝜎
𝐸) 𝑤ℎ𝑒𝑟𝑒 𝑙 = 𝑙𝑒𝑛𝑔𝑡ℎ 𝑜𝑓 𝑏𝑎𝑟 𝑏𝑒𝑡𝑤𝑒𝑒𝑛 𝑏𝑜𝑛𝑑𝑒𝑑 𝑙𝑒𝑛𝑔𝑡ℎ 𝑎𝑛𝑑 𝑚𝑎𝑐ℎ𝑖𝑛𝑒 𝑔𝑟𝑖𝑝𝑠 𝐺𝑖𝑣𝑒𝑛 𝑓𝑜𝑟𝑐𝑒 𝑃 𝑖𝑠 𝑘𝑛𝑜𝑤𝑛, 𝑡ℎ𝑒 𝑓𝑜𝑟𝑚𝑢𝑙𝑎 𝑏𝑒𝑐𝑜𝑚𝑒𝑠
Methodology 40
3.4.4 Calculation of Bond Stress
As the bar being use was non-deformed bar, the system will depend on the cohesion between the ECC and the FRP as well as the friction generated by the sand coated surface on the FRP bar. This will be Therefore the ultimate bond stress was calculated based on the bonded length and the nominal bar diameter.
Results 41
4
RESULTS
The following chapter will present the results of the testing, with further discussion to follow in the next chapter.
4.1
Sample Set C1 Summary Results
Table 4-1 Sample Set C1 Quantitative Result Summary
Number of Samples Average Ultimate load (kN) Average Ultimate Bond Stress (MPa) Max Ultimate Load (kN) Max Average Stress (MPa) Average Slip at ultimate load (mm)
6 27.5 7.0 30.1 7.7 4.5
Table 4-2 Sample Set C1 Qualitative Observations
Typical Failure Mode Number of Erroneous Results
Workability
Brittle Failure, Cover cracking in cementitious adhesive.
1 – Prism cracked in half during test. Removed from dataset
Extremely Flowable, self-consolidating paste.
4.1.1 Discussion
Workability
Results 42
Curing
Initial hardening occurred within four hours of mixing with nominal bleed water still present five hours after initial set.
Performance
The Average Ultimate load was 27.5kN, with a range of 5.7kN. The standard deviation of the results wa