IT SERVICE MANAGEMENT: PROCESS CAPABILITY,
PROCESS PERFORMANCE, AND BUSINESS
PERFORMANCE
A Thesis submitted by
Suren Behari
BS (UKZN), PGCert in e-Business (USQ), MBA (USQ)
For the award of Doctor of Philosophy
i
Abstract
As technology is at the core of almost every leading industry, organizations are increasingly scrutinizing their Information Technology (IT) group’s performance so that it is more in line with overall business performance and contributes to the business’ bottom line. Many IT departments are not equipped to meet these increasing IT service demands. They continue to operate as passive-reactive service providers, utilizing antiquated methods that do not adequately provide the quality, real-time solutions that organizations need to be competitive.
Organizations need efficient Information Technology Service Management (ITSM) processes in order to cut costs, but ironically, in order to implement highly capable processes, there are significant costs involved, both in terms of time and resources. A potential way to achieve better performing and higher capable processes is to employ methods to compare an organization’s processes against best-practice standards to identify gaps and receive guidance to improve the processes. Many of the existing methods require large investments.
ii
maturity (process capability and performance) with financial performance for organizations that lack mature ITSM processes.
Previous studies have reported on cost savings, but there is currently no measurement model to associate ITSM maturity with financial profitability; which in turn prompts the research question: How can the association of ITSM process capability and process performance with financial performance of an organization be determined?
This research iteratively develops and applies a measurement model that presents a pragmatic and cost-effective method to link ITSM process capability and process performance with business performance by operationalizing Key Performance Indicators (KPIs) to support Critical Success Factors (CSFs) and associating CSFs with business risks to determine business performance.
This study employs a scholar-practitioner approach to changing/improving processes using action research and an adaptation of the Keys to IT Service Management Excellence Technique (KISMET) model to guide the process improvement initiative. This technique leads to the second research question: How can the ITSM measurement framework be demonstrated for CSI?
The research was based on a single case study of a global financial services firm
iii
Certification of Thesis
This Thesis is entirely the work of Suren Behari except where otherwise acknowledged. The work is original and has not previously been submitted for any other award, except where acknowledged.
Principal Supervisor: ___________________
Professor Aileen Cater-Steel
Associate Supervisor: __________________
Professor Jeffrey Soar
Associate Supervisor: __________________
Dr Anup Shrestha
iv
Candidate’s Publication List
During the course of this research, the researcher contributed to a conference, book chapter and co-authored a paper. The publication list follows.
Conference Proceedings
Behari, Suren and Cater-Steel, Aileen and Shrestha, Anup and Soar, Jeffrey (2016) A measurement model to link process operational measures to risks associated with attainment of business critical success factors. In: 6th International Engaged Management Scholarship Conference. Available at SSRN:
https://ssrn.com/abstract=2866873, 9-10 September 2016, Paris.
Book Chapter
Behari, Suren and Cater-Steel, Aileen and Soar, Jeffrey (2016) Data Science and Big Data Analytics in Financial Services: A Case Study. In: Handbook of Research on Driving Competitive Advantage through Sustainable, Lean, and Disruptive Innovation. IGI, pp. 396-423. ISBN 9781522501350
Co-Authored Papers
Shrestha, Anup and Cater-Steel, Aileen and Toleman, Mark and Rout, Terry and Behari, Suren (2016) The issue of reliability in software mediated process assessments. In: Software Process Improvement and Capability Determination 16th International Conference, SPICE 2016, 9-10 June 2016, Dublin, Ireland.
v
Acknowledgements
I would like to acknowledge the assistance of the many people who provided help, support, and encouragement, enabling me to complete this thesis. Being a distance student has meant that I could not meet my supervisors in person as often as I would have liked, yet all in their different ways have given me immeasurable support throughout my research and writing.
I would particularly like to express my sincere appreciation to my principal supervisor Professor Aileen Cater-Steel, who visited me in California to help me reign in the focus of my thesis at a crucial time. Her supervision, guidance, patience, and continual support has provided me with the direction and abilities to complete this thesis. I would also like to thank my associate supervisors Professor Jeffrey Soar and Dr Anup Shrestha. The support and encouragement they provided throughout the duration of this research has been appreciated.
I am very grateful to the University’s industry partner Assessment Portal Pty Ltd. for providing a software platform to conduct the surveys. Special thanks to Randy Steinberg for granting approval to use his ITSM Metrics Modeling tool as a foundation for the research. I thank the case study organization and participants for affording me the opportunity to play the dual role of scholar and practitioner. I thank Ms Libby Collett for her proofreading of my thesis that has enriched the composition of the thesis.
vi
Table of Contents
ABSTRACT ... I
CERTIFICATION OF THESIS ... III
CANDIDATE’S PUBLICATION LIST ... IV
CONFERENCE PROCEEDINGS ... IV
BOOK CHAPTER ... IV
CO-AUTHORED PAPERS ... IV
ACKNOWLEDGEMENTS ... V
LIST OF FIGURES ... XII
LIST OF TABLES ... XV
CHAPTER 1 INTRODUCTION ... 1
1.1 INTRODUCTION ... 1
1.2 BACKGROUND AND MOTIVATION ... 2
1.3 RESEARCH PROBLEM,RESEARCH QUESTIONS, AND CONTRIBUTIONS ... 4
1.3.1 Expected Contribution to Theory, ITSM Literature, and Research Methodology ... 6
1.3.2 Expected Contribution to ITSM Industry and Practice ... 8
1.4 JUSTIFICATION OF THE RESEARCH ... 10
1.5 METHODOLOGY ... 11
1.6 DEFINITION OF KEY TERMS ... 11
1.7 DELIMITATIONS OF SCOPE AND KEY ASSUMPTIONS ... 15
1.8 STRUCTURE OF THESIS ... 16
1.9 CHAPTER SUMMARY ... 17
CHAPTER 2 LITERATURE REVIEW ... 18
2.1 INTRODUCTION ... 18
2.2 LITERATURE REVIEW STRATEGY ... 19
2.3 LITERATURE REVIEW PROTOCOL ... 20
2.4 LITERATURE REVIEW FRAMEWORK ... 21
2.5 PARENT THEORIES ... 23
2.5.1 Agency Theory ... 23
2.5.2 Strategic Alignment ... 30
2.5.3 Resource-Based View and Knowledge-Based Theory ... 33
2.5.4 Actor-Network Theory ... 34
vii
2.6.1 ITSM Capability ... 38
2.6.2 ITSM Performance ... 45
2.6.3 Business Performance ... 50
2.7 CHAPTER SUMMARY ... 61
CHAPTER 3 RESEARCH METHODOLOGY ... 63
3.1 INTRODUCTION ... 63
3.2 PHILOSOPHICAL WORLDVIEW ... 64
3.2.1 Pragmatism ... 65
3.3 RESEARCH ORIENTATION ... 66
3.3.1 Epistemology ... 66
3.3.2 Ontology ... 67
3.3.3 Axiology ... 68
3.4 RESEARCH DESIGN ... 69
3.4.1 Applied Research ... 69
3.4.2 Case Study Research ... 71
3.4.3 Mixed Methods ... 73
3.4.4 Action Research ... 74
3.5 RESEARCH APPROACH ... 78
3.5.1 Definition of the Measurement Model ... 78
3.5.2 Application of the Measurement Model ... 79
3.6 CHAPTER SUMMARY ... 85
CHAPTER 4 DESIGN OF THE BEHARI ITSM MEASUREMENT FRAMEWORK ... 86
4.1 INTRODUCTION ... 86
4.2 THE DESIGN OF THE BEHARI ITSMMEASUREMENT FRAMEWORK ... 87
4.2.1 The ITSM Performance Pyramid ... 87
4.2.2 The ITSM Measurement Model ... 92
4.2.3 The Conceptual Model of the Behari ITSM Measurement Framework ... 94
4.3 DETAILS OF THE CONCEPTUAL MODEL CONSTRUCTS ... 96
4.3.1 IT Level ... 96
4.3.2 Business and IT Level ... 98
4.3.3 Business Level ... 99
4.4 CHAPTER SUMMARY ... 100
CHAPTER 5 ACTION RESEARCH - CYCLE 1 (ARC1) ... 101
5.1 INTRODUCTION ... 101
viii
5.3 KISMETPHASE 2:ASSESS PROCESS CAPABILITY AND PERFORMANCE ... 111
5.3.1 Process Capability Assessment ... 111
5.3.2 Financial Measurement ... 127
5.3.3 Operationalizing the Behari ITSM Measurement Model ... 135
5.4 KISMETPHASE 3:PLAN PROCESS IMPROVEMENT ACTION ... 157
5.4.1 Incident Management ... 157
5.4.2 Problem Management... 159
5.4.3 Change Management ... 161
5.5 KISMETPHASE 4:DESIGN PROCESS IMPROVEMENT GUIDELINES ... 161
5.6 KISMETPHASE 5:EXECUTE THE PROCESS IMPROVEMENT PLAN ... 162
5.6.1 Incident Management ... 162
5.6.2 Problem Management... 167
5.6.3 Change Management ... 169
5.7 KISMETPHASE 6:EVALUATE PROCESS IMPROVEMENT ... 169
5.7.1 Incident Management ... 170
5.7.2 Problem Management... 175
5.7.3 Change Management ... 176
5.8 KISMET PHASE 7–CONTINUAL PROCESS IMPROVEMENT ... 176
5.8.1 Process Capability ... 177
5.8.2 Process Performance ... 180
5.8.3 Market Events ... 185
5.9 CHAPTER SUMMARY ... 188
CHAPTER 6 ACTION RESEARCH - CYCLE 2 (ARC2) ... 191
6.1 INTRODUCTION ... 191
6.2 KISMETPHASE 1:CREATE A PROCESS IMPROVEMENT INFRASTRUCTURE ... 194
6.2.1 Reflection on creating a process improvement infrastructure ... 195
6.3 KISMETPHASE 2:ASSESS PROCESS CAPABILITY AND PERFORMANCE ... 197
6.3.1 Process Capability Assessment ... 197
6.3.2 Reflection on the process capability assessment results ... 205
6.3.3 Financial Measurement ... 214
6.3.4 Operationalizing the Measurement Model ... 223
6.3.5 Reflection on operationalizing the measurement model ... 238
6.4 KISMETPHASE 3:PLAN PROCESS IMPROVEMENT ACTION ... 281
6.4.1 Reflection on plan process improvement action ... 282
6.5 KISMETPHASE 4:DESIGN PROCESS IMPROVEMENT GUIDELINES ... 282
6.5.1 Reflection on design process improvement guidelines ... 283
ix
6.6.1 Incident Management ... 283
6.6.2 Problem Management... 284
6.6.3 Change Management ... 284
6.6.4 Reflection on execute the process improvement plan ... 285
6.7 KISMETPHASE 6:EVALUATE PROCESS IMPROVEMENT ... 285
6.7.1 Incident Management ... 285
6.7.2 Problem Management... 286
6.7.3 Change Management ... 286
6.7.4 Reflection on evaluate process improvement ... 286
6.8 FINAL REFLECTION ... 287
6.8.1 Political Conditions ... 287
6.8.2 Economic Factors ... 294
6.8.3 Social Environment ... 295
6.8.4 Technological Factors ... 295
6.8.5 Environmental Factors ... 296
6.8.6 Legal Environment ... 298
6.9 CHAPTER SUMMARY ... 299
CHAPTER 7 DISCUSSION ... 301
7.1 INTRODUCTION ... 301
7.2 DISCUSSION APPROACH ... 303
7.3 DISCUSSION ON FINDINGS RELATED TO RESEARCH QUESTION ONE ... 305
7.3.1 Process Capability ... 305
7.3.2 Process Performance ... 307
7.3.3 Business Performance ... 314
7.3.4 Response to Research Question One ... 319
7.4 DISCUSSION ON FINDINGS RELATED TO RESEARCH QUESTION TWO ... 325
7.4.1 Implementation of a method to demonstrate the ITSM Measurement Framework for CSI 325 7.4.2 Structure of the method to achieve CSI ... 327
7.4.3 Response to Research Question Two ... 328
7.5 DISCUSSION ON SCHOLAR-PRACTITIONER APPROACH ... 328
7.6 CHAPTER SUMMARY ... 330
CHAPTER 8 CONCLUSION ... 331
8.1 INTRODUCTION ... 331
8.2 SUMMARY OF THESIS ... 332
x
8.3.1 Contribution to Underpinning Theories ... 335
8.3.2 Contribution to ITSM Literature... 337
8.3.3 Contribution to Research Methodology ... 338
8.4 CONTRIBUTION TO ITSMINDUSTRY AND PRACTICE ... 339
8.5 LIMITATIONS AND AGENDA FOR FUTURE RESEARCH ... 341
8.5.1 Literature Review... 341
8.5.2 Methodology ... 341
8.5.3 Process Capability ... 344
8.5.4 Process Performance ... 345
8.5.5 Business Performance ... 346
8.6 CHAPTER SUMMARY ... 347
ACKNOWLEDGEMENTS ... 348
REFERENCES ... 349
LIST OF APPENDICES ... 386
APPENDIX A.1.LIST OF TERMS ... 388
APPENDIX A.2.LITERATURE REVIEW SYSTEMATIC MAP ... 398
APPENDIX B.1.ETHICS APPROVAL LETTER ... 410
APPENDIX B.2.COMPANY XAPPROVAL LETTER ... 412
APPENDIX B.3.INTERVIEW/MEETING PARTICIPANT INFORMATION SHEET ... 413
APPENDIX B.4.INTERVIEW/MEETING CONSENT FORM ... 416
APPENDIX B.5.FOCUS GROUP PARTICIPANT INFORMATION SHEET ... 417
APPENDIX B.6.FOCUS GROUP CONSENT FORM ... 419
APPENDIX B.7.STEINBERG’S CONSENT TO USE HIS ITSMMETRICS MODELLING TOOL ... 420
APPENDIX C.1.PROCESS ASSESSMENT SURVEY INVITATION EMAIL ... 421
APPENDIX C.2.FOLLOW-UP EMAIL ... 422
APPENDIX C.3.EMAIL TO EXTEND SURVEY DUE DATE ... 423
APPENDIX C.4.FOCUS GROUP INVITATION EMAIL ... 424
APPENDIX C.5.EMAIL COMMUNICATING PROCESS CAPABILITY RESULTS ... 425
APPENDIX C.6.INCIDENT MANAGEMENT SMPAPROCESS CAPABILITY ASSESSMENT REPORT WITH ACTION PLAN . 426 APPENDIX C.7.PROBLEM MANAGEMENT SMPAPROCESS CAPABILITY ASSESSMENT REPORT WITH ACTION PLAN . 438 APPENDIX C.8.CHANGE MANAGEMENT SMPAPROCESS CAPABILITY ASSESSMENT REPORT WITH ACTION PLAN .. 460
APPENDIX D.1.EMAIL COMMUNICATION OF PROCESS GUIDELINES ... 473
APPENDIX D.2.INCIDENT MANAGEMENT GUIDELINES ... 474
APPENDIX D.3.PROBLEM MANAGEMENT GUIDELINES ... 497
APPENDIX D.4.CHANGE MANAGEMENT GUIDELINES ... 516
xi
APPENDIX E.2.AUTO-GENERATED SURVEY INVITATION EMAIL ... 528
APPENDIX E.3.AUTO-GENERATED SURVEY REMINDER EMAIL ... 529
APPENDIX E.4.THANK YOU EMAIL ... 530
APPENDIX E.5.FOCUS GROUP INVITATION EMAIL ... 531
APPENDIX F.1.OPERATIONAL METRICS ... 532
APPENDIX F.2.KEY PERFORMANCE INDICATORS ... 532
APPENDIX F.3.CRITICAL SUCCESS FACTORS ... 533
xii
List of Figures
FIGURE 1-1OVERVIEW OF CHAPTER 1 ... 2
FIGURE 2-1OVERVIEW OF CHAPTER 2 ... 18
FIGURE 2-2NUMBER OF JOURNAL ARTICLES AND CONFERENCE PAPERS ... 19
FIGURE 2-3LITERATURE REVIEW FRAMEWORK ... 22
FIGURE 2-4FORBES INSIGHTS SURVEY LIST OF MOST PREVALENT ITSM FRAMEWORKS (FORBES 2017) ... 38
FIGURE 2-5FRAMEWORK FOR EVALUATING RESEARCH ON THE BENEFITS OF ITINVESTMENTS (DEHNING & RICHARDSON 2002) ... 50
FIGURE 3-1OVERVIEW OF CHAPTER 3 ... 63
FIGURE 3-2THE INTERLINKED PRACTICES PROPOSED BY CRONHOLM AND GOLDKUHL (2004, P.54)... 76
FIGURE 3-3APPLICATION OF THE INTERLINKED PRACTICES ... 77
FIGURE 3-4A BASIC ACTION RESEARCH MODEL (COSTELLO 2003, P.7) ... 84
FIGURE 4-1OVERVIEW OF CHAPTER 4 ... 86
FIGURE 4-2SMARTPERFORMANCE PYRAMID (ARTTO 1999, P.6) ... 88
FIGURE 4-3CONCEPTUAL MODEL OF THE ITSMPERFORMANCE PYRAMID ... 91
FIGURE 4-4STEINBERG'S METRICS MODEL (STEINBERG 2013, P.20) ... 92
FIGURE 4-5BEHARI ITSERVICE MANAGEMENT MEASUREMENT FRAMEWORK ... 95
FIGURE 5-1OVERVIEW OF CHAPTER 5 ... 102
FIGURE 5-2ACTION RESEARCH CYCLE 1TIMELINE ... 103
FIGURE 5-3COMPANY X'S ORGANIZATIONAL CHART ... 109
FIGURE 5-4ASSESSMENT SURVEY RESULTS ... 115
FIGURE 5-5INCIDENT MANAGEMENT PROCESS ASSESSMENT RESULTS ... 116
FIGURE 5-6PROBLEM MANAGEMENT ASSESSMENT RESULTS ... 116
FIGURE 5-7CHANGE MANAGEMENT ASSESSMENT RESULTS ... 117
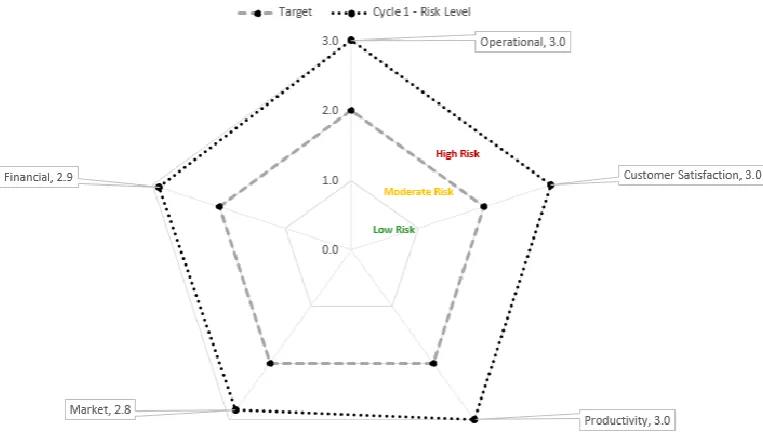
FIGURE 5-8ITSMP2RISK LEVEL SCORECARD FOR INCIDENT MANAGEMENT ... 155
FIGURE 5-9ITSMP2RISK LEVEL SCORECARD FOR PROBLEM MANAGEMENT ... 156
FIGURE 5-10ITSMP2RISK LEVEL SCORECARD FOR CHANGE MANAGEMENT ... 156
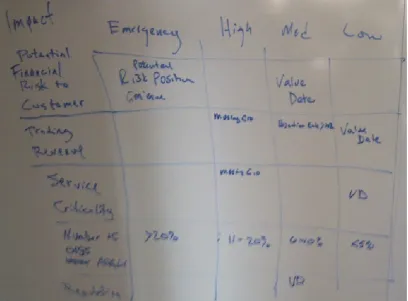
FIGURE 5-11PRIORITIZATION MATRIX (PHOTO BY RESEARCHER) ... 159
FIGURE 5-12NUMBER OF INCIDENTS BY SUBTYPE FOR THE PERIOD 16MAY 2016 TO 27MAY 2016 ... 163
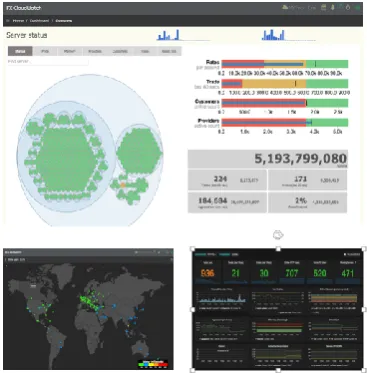
FIGURE 5-13FXCLOUDWATCH INTERFACE ... 164
FIGURE 5-14INCIDENT MANAGEMENT DASHBOARD (MAY-OCT 2015) ... 166
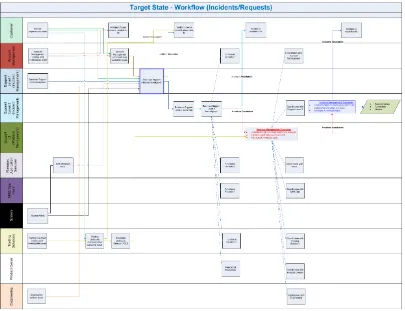
FIGURE 5-15INCIDENT MANAGEMENT PROCESS WORKFLOW ... 166
FIGURE 5-16BREAKDOWN OF INCIDENT SUBTYPE FOR CUSTOMER A ... 171
FIGURE 5-17TOP 50% OF CUSTOMER A TICKETS ... 171
FIGURE 5-18BREAKDOWN OF INCIDENT SUBTYPE FOR CUSTOMER B ... 172
xiii
FIGURE 5-20TOTAL NUMBER OF INCIDENTS PER MONTH (MAY-OCT 2015) ... 174
FIGURE 5-21SEASONALITY OF NUMBER OF INCIDENTS PER BUSINESS UNIT ... 181
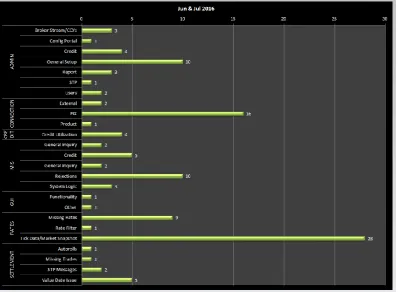
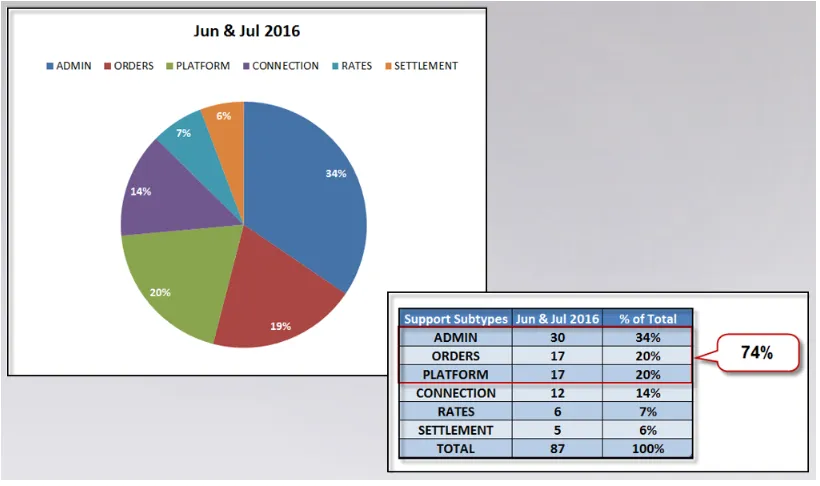
FIGURE 5-22BREAKDOWN OF THE NUMBER OF BUSINESS SUPPORT LEVEL 1 INCIDENTS ... 182
FIGURE 5-23BREAKDOWN BY SERVICE COMPONENT FOR 28JUNE 2015 ... 183
FIGURE 5-24NUMBER OF INCIDENTS,PROBLEMS, AND CHANGES AROUND MAJOR SOFTWARE RELEASES (MAR 2014-OCT 2015) ... 184
FIGURE 5-25SEASONAL INFLUENCE ON TRADING VOLUME (MAY-OCT;2012-2015)... 185
FIGURE 5-26CHART OF EUR/CHF(POPPLEWELL 2015) ... 186
FIGURE 6-1OVERVIEW OF CHAPTER 6 ... 192
FIGURE 6-2ACTION RESEARCH CYCLE 2TIMELINE ... 193
FIGURE 6-3CHANGE TO ORGANIZATIONAL STRUCTURE ... 196
FIGURE 6-4A COMPARISON OF THE NUMBER OF SMPA RECOMMENDATIONS BETWEEN ASSESSMENT 1 AND 2 FOR INCIDENT MANAGEMENT ... 208
FIGURE 6-5A COMPARISON OF THE NUMBER OF SMPA RECOMMENDATIONS BETWEEN ASSESSMENT 1 AND 2 FOR PROBLEM MANAGEMENT ... 208
FIGURE 6-6A COMPARISON OF THE NUMBER OF SMPA RECOMMENDATIONS BETWEEN ASSESSMENT 1 AND 2 FOR CHANGE MANAGEMENT ... 209
FIGURE 6-7EMPLOYEE SALARIES IN CYCLE 1 VS. CYCLE 2... 219
FIGURE 6-8ITSMP2RISK LEVEL SCORECARD FOR INCIDENT MANAGEMENT ... 237
FIGURE 6-9ITSMP2RISK LEVEL SCORECARD FOR PROBLEM MANAGEMENT ... 237
FIGURE 6-10ITSMP2RISK LEVEL SCORECARD FOR CHANGE MANAGEMENT ... 238
FIGURE 6-11INCIDENT MANAGEMENT ITSMP2RISK LEVEL SCORECARD FOR CYCLE 1 AND CYCLE 2 ... 239
FIGURE 6-12PROBLEM MANAGEMENT ITSMP2RISK LEVEL SCORECARD FOR CYCLE 1 AND CYCLE 2 ... 240
FIGURE 6-13CHANGE MANAGEMENT ITSMP2RISK LEVEL SCORECARD FOR CYCLE 1 AND CYCLE 2 ... 241
FIGURE 6-14ZENDESK METRICS FOR NUMBER OF INCIDENTS ... 249
FIGURE 6-15ZENDESK METRICS FILTERS FOR NUMBER OF INCIDENTS ... 249
FIGURE 6-16KPIWEIGHTED AVERAGE FORMULA ... 250
FIGURE 6-17COMPARISON OF THE INCIDENT MANAGEMENT ITSMP2 ATTAINMENT BETWEEN CYCLE 1 AND CYCLE 2 ... 278
FIGURE 6-18COMPARISON OF THE PROBLEM MANAGEMENT ITSMP2 ATTAINMENT FOR CYCLE 1 AND CYCLE 2 ... 279
FIGURE 6-19COMPARISON OF THE CHANGE MANAGEMENT ITSMP2 ATTAINMENT FOR CYCLE 1 AND CYCLE 2 ... 280
FIGURE 6-20INCIDENTS AND CHANGES PER MILLION TRANSACTIONS FOR 3-MONTH PERIOD IN 2015 AND 2016 AT COMPANY X ... 289
FIGURE 6-21STOCK MARKET VOLATILITY ON THE USELECTION NIGHT FROM CNN(2016) ... 290
FIGURE 6-22THE USSTOCK MARKET PERFORMANCE THE WEEK OF THE 2016USELECTIONS (CNN2016) ... 291
xiv
FIGURE 7-1OVERVIEW OF CHAPTER 7 ... 302
FIGURE 7-2INCIDENTS AND CHANGES PER MILLION TRANSACTIONS FOR 3-MONTH PERIOD AROUND BREXIT AND THE US2016PRESIDENTIAL ELECTIONS ... 311
FIGURE 7-3THE VIX CHART FOR JUNE-AUGUST 2017(MARKETWATCH 2017) ... 312
FIGURE 7-4VIX CHART SHOWING BIGGEST JUMP SINCE THE 2016USELECTION (MARKETWATCH 2017) ... 312
FIGURE 7-5A COMPARATIVE CHART OF GOLD AND THE JAPANESE YEN (THE ECONOMIC TIMES 2017) ... 313
FIGURE 7-6INCIDENTS AND CHANGES PER MILLION TRANSACTIONS FOR 3-MONTH PERIOD AUG-OCT 2016 AND 2017 ... 314
FIGURE 7-7TOTAL COST SAVINGS WHEN COMPARING THE LABOR COST OF PERFORMING PROCESSES IN CYCLE 1 WITH CYCLE 2 ... 316
FIGURE 7-8ASSOCIATION OF PROCESS CAPABILITY,PROCESS PERFORMANCE AND FINANCIAL PERFORMANCE ... 318
FIGURE 7-9CHANGES MADE TO EACH COMPONENT OF THE STEINBERG ITSMMETRICS MODELLING TOOL TO DEVELOP THE ITSM3 ... 324
FIGURE 7-10ACTION RESEARCH APPROACH USED IN THIS RESEARCH ... 327
xv
List of Tables
TABLE 2-1LITERATURE REVIEW PROTOCOL ... 20
TABLE 2-2SYSTEMATIC MAP OF THE UNDERPINNING THEORIES... 36
TABLE 2-3SYSTEMATIC MAP OF THE LITERATURE REVIEWED FOR ITSM ADOPTION, IMPLEMENTATION, AND THE OUTCOMES AND BENEFITS OF ITSM ... 40
TABLE 2-4ISO/IEC15504PROCESS CAPABILITY LEVELS AND PROCESS ATTRIBUTES ... 42
TABLE 2-5ATTRIBUTE RATINGS AND PROCESS CAPABILITIES ... 44
TABLE 2-6SYSTEMATIC MAP OF THE LITERATURE REVIEWED FOR ITSM PROCESS PERFORMANCE ... 48
TABLE 2-7SYSTEMATIC MAP OF THE LITERATURE REVIEWED FOR BUSINESS PERFORMANCE ... 60
TABLE 3-1ADAPTION AND MAPPING OF KISMET TO ACTION RESEARCH ... 79
TABLE 4-1PROCESS ATTRIBUTE RATING SCALE ... 96
TABLE 5-1NUMBER OF PARTICIPANTS ACROSS BUSINESS UNITS, PROCESSES, AND GEOGRAPHIC REGION ... 108
TABLE 5-2CRITICAL SUCCESS FACTORS FOR THREE PROCESSES AT COMPANY X ... 110
TABLE 5-3PROCESS ATTRIBUTE RATING SCALE ... 112
TABLE 5-4PARTICIPANT PROCESS ROLE CODES ... 113
TABLE 5-5CODES OF PARTICIPANTS BY PROCESS AND ROLE... 113
TABLE 5-6PARTICIPANT ROLES ... 118
TABLE 5-7CODED PARTICIPANT BREAKDOWN BY PROCESS AND PROCESS ROLE ... 118
TABLE 5-8SMPATOOL EVALUATION CRITERIA AND QUESTIONS ... 119
TABLE 5-9INCIDENT MANAGEMENT SURVEY RESULTS EVALUATION ... 121
TABLE 5-10SURVEY COMMENTS:INCIDENT MANAGEMENT ... 122
TABLE 5-11PROBLEM MANAGEMENT SURVEY RESULTS EVALUATION ... 122
TABLE 5-12SURVEY COMMENTS:PROBLEM MANAGEMENT ... 124
TABLE 5-13CHANGE MANAGEMENT SURVEY RESULTS EVALUATION ... 125
TABLE 5-14CHANGE MANAGEMENT SURVEY COMMENTS ... 126
TABLE 5-15SURVEY COMMENTS:SUMMARY BY PROCESS AND SELECTED OPTION ... 127
TABLE 5-16EXAMPLES OF SERVICE OUTAGES AND MAJOR INCIDENTS AT COMPANY X ... 128
TABLE 5-17COST OF OUTAGES AND MAJOR INCIDENTS AT COMPANY X(MAY-OCT 2015) ... 131
TABLE 5-18LABOR METRIC ASSUMPTIONS FOR COMPANY X ... 132
TABLE 5-19COMPANY X’S FULLY-BURDENED COSTS PER EMPLOYEE ... 133
TABLE 5-20INCIDENT MANAGEMENT COSTS PER BUSINESS UNIT AT COMPANY X(MAY-OCT 2015) ... 134
TABLE 5-21PROBLEM MANAGEMENT COSTS PER BUSINESS UNIT AT COMPANY X(MAY-OCT 2015) ... 134
TABLE 5-22CHANGE MANAGEMENT COSTS PER BUSINESS UNIT AT COMPANY X (MAY-OCT 2015) ... 135
TABLE 5-23INCIDENT MANAGEMENT OPERATIONAL METRICS (MAY-OCT 2015) ... 136
TABLE 5-24PROBLEM MANAGEMENT OPERATIONAL METRICS (MAY-OCT 2015) ... 136
xvi
TABLE 5-26KEY PERFORMANCE INDICATORS FOR INCIDENT MANAGEMENT ... 138
TABLE 5-27KEY PERFORMANCE INDICATORS FOR PROBLEM MANAGEMENT ... 139
TABLE 5-28KEY PERFORMANCE INDICATORS FOR CHANGE MANAGEMENT ... 140
TABLE 5-29KPITHRESHOLD TARGETS,RESULTS, AND SCORES FOR INCIDENT MANAGEMENT ... 141
TABLE 5-30KPITHRESHOLD TARGETS,RESULTS, AND SCORES FOR PROBLEM MANAGEMENT ... 142
TABLE 5-31KPITHRESHOLD TARGETS,RESULTS, AND SCORES FOR CHANGE MANAGEMENT ... 143
TABLE 5-32INCIDENT MANAGEMENT:MAPPING OF KPIS TO CSFS ... 145
TABLE 5-33PROBLEM MANAGEMENT:MAPPING OF KPIS TO CSFS ... 146
TABLE 5-34CHANGE MANAGEMENT:MAPPING OF KPIS TO CSFS ... 147
TABLE 5-35INCIDENT MANAGEMENT:CSFATTAINMENT AND CSFSCORES ... 148
TABLE 5-36PROBLEM MANAGEMENT:CSFATTAINMENT AND CSFSCORES ... 149
TABLE 5-37CHANGE MANAGEMENT:CSFATTAINMENT AND CSFSCORES ... 149
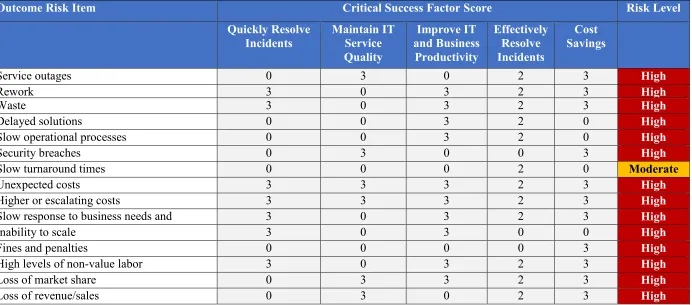
TABLE 5-38INCIDENT MANAGEMENT:MAPPING OF OUTCOME RISKS TO CSFSCORES ... 151
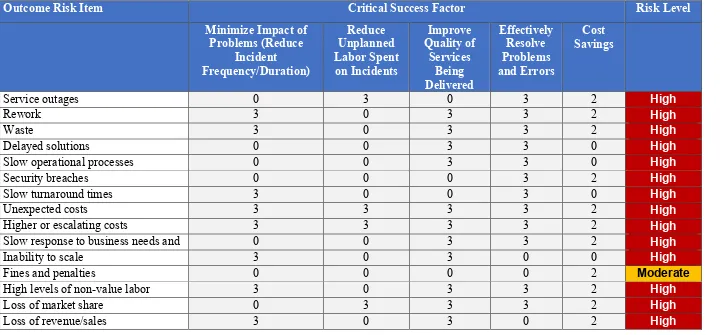
TABLE 5-39PROBLEM MANAGEMENT:MAPPING OF OUTCOME RISKS TO CSFSCORES ... 152
TABLE 5-40CHANGE MANAGEMENT:MAPPING OF OUTCOME RISKS TO CSFSCORES ... 153
TABLE 5-41INCIDENT MANAGEMENT:ITSMP2RISK LEVELS ... 154
TABLE 5-42PROBLEM MANAGEMENT:ITSMP2RISK LEVELS ... 154
TABLE 5-43CHANGE MANAGEMENT:ITSMP2RISK LEVELS ... 154
TABLE 5-44TOP 50% OF CUSTOMER ATICKETS ... 172
TABLE 5-45TOP 50% OF CUSTOMER BTICKETS ... 173
TABLE 5-46PROCESS ASSESSMENT RELIABILITY SCORES ... 178
TABLE 5-47DISTRIBUTION OF THE NUMBER OF PARTICIPANTS BY ORGANIZATION BUSINESS UNIT PER PROCESS ASSESSED ... 179
TABLE 5-48EVENTS OF ISSUE A FOR 15JANUARY 2015 ... 187
TABLE 5-49EVENTS OF ISSUE B FOR 15JANUARY 2015 ... 188
TABLE 6-1NUMBER OF PARTICIPANTS ACROSS BUSINESS UNITS, PROCESSES, AND GEOGRAPHIC REGION ... 194
TABLE 6-2SUMMARY OF PROCESS CAPABILITY FOR ASSESSMENT 2... 198
TABLE 6-3CODED PARTICIPANT BREAKDOWN... 199
TABLE 6-4INCIDENT MANAGEMENT SURVEY RESULTS EVALUATION ... 201
TABLE 6-5SURVEY COMMENTS:INCIDENT MANAGEMENT ... 202
TABLE 6-6SURVEY COMMENTS:PROBLEM MANAGEMENT ... 203
TABLE 6-7SURVEY COMMENTS:CHANGE MANAGEMENT ... 204
TABLE 6-8SURVEY COMMENTS:SUMMARY BY PROCESS AND SELECTED OPTION ... 205
TABLE 6-9COMPARISON OF PROCESS ATTRIBUTE RATINGS FOR ASSESSMENT 1 AND ASSESSMENT 2 ... 206
TABLE 6-10AVERAGE RECOMMENDATION RATIO FOR THE THREE PROCESSES ... 211
xvii
TABLE 6-12COST OF OUTAGES AND MAJOR INCIDENTS AT COMPANY X(MAY-OCT 2016) ... 214
TABLE 6-13COMPANY X’S FULLY-BURDENED ANNUAL COSTS PER EMPLOYEE FOR SIX GROUPS OF STAFF ... 216
TABLE 6-14INCIDENT MANAGEMENT COSTS PER BUSINESS UNIT AT COMPANY X(MAY-OCT 2016) ... 217
TABLE 6-15PROBLEM MANAGEMENT COSTS PER BUSINESS UNIT AT COMPANY X(MAY-OCT 2016) ... 217
TABLE 6-16CHANGE MANAGEMENT COSTS PER BUSINESS UNIT AT COMPANY X(MAY-OCT 2016) ... 218
TABLE 6-17A COMPARISON OF EMPLOYEE ANNUAL SALARIES BY BUSINESS UNIT FOR CYCLE 1 AND 2 ... 218
TABLE 6-18NORMALIZED 2016 SALARIES USING CPI-W FOR 2015&2016 ... 220
TABLE 6-19INCIDENT MANAGEMENT COSTS PER BUSINESS UNIT AT COMPANY X ... 221
TABLE 6-20PROBLEM MANAGEMENT COSTS PER BUSINESS UNIT AT COMPANY X ... 222
TABLE 6-21CHANGE MANAGEMENT COSTS PER BUSINESS UNIT AT COMPANY X ... 222
TABLE 6-22NORMALIZED COSTS PER PROCESS FOR 2015 AND 2916 ... 223
TABLE 6-23INCIDENT MANAGEMENT OPERATIONAL METRICS (MAY-OCT 2016) ... 223
TABLE 6-24PROBLEM MANAGEMENT OPERATIONAL METRICS (MAY-OCT 2016) ... 224
TABLE 6-25CHANGE MANAGEMENT OPERATIONAL METRICS (MAY-OCT 2016) ... 224
TABLE 6-26KPITHRESHOLD TARGETS,RESULTS, AND SCORES FOR INCIDENT MANAGEMENT ... 226
TABLE 6-27KPITHRESHOLD TARGETS,RESULTS, AND SCORES FOR PROBLEM MANAGEMENT ... 228
TABLE 6-28KPITHRESHOLD TARGETS,RESULTS, AND SCORES FOR CHANGE MANAGEMENT ... 229
TABLE 6-29INCIDENT MANAGEMENT:CSFATTAINMENT AND CSFSCORES ... 231
TABLE 6-30INCIDENT MANAGEMENT:MAPPING OF OUTCOME RISKS TO CSFSCORES ... 233
TABLE 6-31PROBLEM MANAGEMENT:MAPPING OF OUTCOME RISKS TO CSFSCORES ... 234
TABLE 6-32CHANGE MANAGEMENT:MAPPING OF OUTCOME RISKS TO CSFSCORES ... 235
TABLE 6-33INCIDENT MANAGEMENT:ITSMP2RISK LEVELS ... 236
TABLE 6-34A COMPARISON OF INCIDENT MANAGEMENT KPI RESULTS BETWEEN CYCLE 1 AND CYCLE 2 ... 243
TABLE 6-35A COMPARISON OF INCIDENT MANAGEMENT CSF ATTAINMENT LEVELS FOR BETWEEN CYCLE 1 AND CYCLE 2 ... 244
TABLE 6-36A COMPARISON OF PROBLEM MANAGEMENT KPI RESULTS BETWEEN CYCLE 1 AND CYCLE 2 ... 245
TABLE 6-37A COMPARISON OF PROBLEM MANAGEMENT CSF ATTAINMENT LEVELS FOR BETWEEN CYCLE 1 AND CYCLE 2 ... 246
TABLE 6-38A COMPARISON OF CHANGE MANAGEMENT KPI RESULTS BETWEEN CYCLE 1 AND CYCLE 2 ... 247
TABLE 6-39A COMPARISON OF CHANGE MANAGEMENT CSF ATTAINMENT LEVELS FOR BETWEEN CYCLE 1 AND CYCLE 2 ... 248
TABLE 6-40A COMPARISON OF INCIDENT MANAGEMENT KPI RESULTS USING THE ENHANCED ITSM3 ... 252
TABLE 6-41A COMPARISON OF PROBLEM MANAGEMENT KPI RESULTS USING THE ENHANCED ITSM3 ... 254
TABLE 6-42A COMPARISON OF CHANGE MANAGEMENT KPI RESULTS USING THE ENHANCED ITSM3 ... 256
TABLE 6-43INCIDENT MANAGEMENT CSFS AND RELATED WEIGHTED KPIS ... 258
TABLE 6-44PROBLEM MANAGEMENT CSFS AND RELATED WEIGHTED KPIS ... 260
xviii
TABLE 6-46COMPARISON OF INCIDENT MANAGEMENT CSF ATTAINMENT LEVELS FOR CYCLE 1 AND CYCLE 2 USING THE
ENHANCED ITSM3 ... 264
TABLE 6-47COMPARISON OF PROBLEM MANAGEMENT CSF ATTAINMENT LEVELS FOR CYCLE 1 AND CYCLE 2 USING THE ENHANCED ITSM3 ... 265
TABLE 6-48COMPARISON OF CHANGE MANAGEMENT CSF ATTAINMENT LEVELS FOR CYCLE 1 AND CYCLE 2 USING THE ENHANCED ITSM3 ... 265
TABLE 6-49WEIGHTED AVERAGE OF INCIDENT MANAGEMENT CSFS ASSOCIATED WITH BUSINESS RISKS ... 267
TABLE 6-50WEIGHTED AVERAGE OF PROBLEM MANAGEMENT CSFS ASSOCIATED WITH BUSINESS RISKS... 268
TABLE 6-51WEIGHTED AVERAGE OF CHANGE MANAGEMENT CSFS ASSOCIATED WITH BUSINESS RISKS ... 269
TABLE 6-52MAPPING OF THE NPLF SCALE TO BUSINESS RISK MITIGATION LEVELS ... 270
TABLE 6-53COMPARISON OF INCIDENT MANAGEMENT BUSINESS RISK LEVELS FOR CYCLE 1 AND CYCLE 2 ... 270
TABLE 6-54COMPARISON OF PROBLEM MANAGEMENT BUSINESS RISK LEVELS FOR CYCLE 1 AND CYCLE 2... 271
TABLE 6-55COMPARISON OF CHANGE MANAGEMENT BUSINESS RISK LEVELS FOR CYCLE 1 AND CYCLE 2 ... 272
TABLE 6-56WEIGHTED AVERAGE OF INCIDENT MANAGEMENT BUSINESS RISK MITIGATION SCORES ASSOCIATED WITH ITSMP2 DIMENSIONS ... 273
TABLE 6-57WEIGHTED AVERAGE OF PROBLEM MANAGEMENT BUSINESS RISK MITIGATION SCORES ASSOCIATED WITH ITSMP2 DIMENSIONS ... 274
TABLE 6-58WEIGHTED AVERAGE OF CHANGE MANAGEMENT BUSINESS RISK MITIGATION SCORES ASSOCIATED WITH ITSMP2 DIMENSIONS ... 275
TABLE 6-59COMPARISON OF INCIDENT MANAGEMENT ITSMP2 ATTAINMENT LEVELS FOR CYCLE 1 AND CYCLE 2 ... 276
TABLE 6-60COMPARISON OF PROBLEM MANAGEMENT ITSMP2 ATTAINMENT LEVELS FOR CYCLE 1 AND CYCLE 2... 276
TABLE 6-61COMPARISON OF CHANGE MANAGEMENT ITSMP2 ATTAINMENT LEVELS FOR CYCLE 1 AND CYCLE 2 .... 276
TABLE 6-62MOST PROMINENT MARKET MOVERS WITH POSSIBLE REASONS AND MARKET IMPACT ... 291
TABLE 7-1SUMMARY OF SIGNIFICANT REFLECTIONS AND THEIR OUTCOMES EXTRACTED FROM CHAPTERS 5 AND 6 .. 303
TABLE 7-2TOTAL COST SAVINGS YEAR-OVER-YEAR ... 316
TABLE 7-3COMPARISON OF PERFORMANCE KPIACHIEVEMENT:CYCLE 1&2 ... 317
TABLE 7-4COMPARISON OF KPIPERFORMANCE FOR INCIDENT MANAGEMENT:CYCLE 1&CYCLE 2 ... 320
TABLE 7-5INCIDENT MANAGEMENT CSFATTAINMENT LEVELS:CYCLE 1&CYCLE 2 ... 320
TABLE 7-6BUSINESS RISK MITIGATION LEVELS FOR THE ITSMP2PRODUCTIVITY DIMENSION:CYCLE 1&CYCLE 2 . 320 TABLE 7-7ITSMP2PRODUCTIVITY ATTAINMENT LEVELS ... 321
1
CHAPTER 1 INTRODUCTION
1.1 Introduction
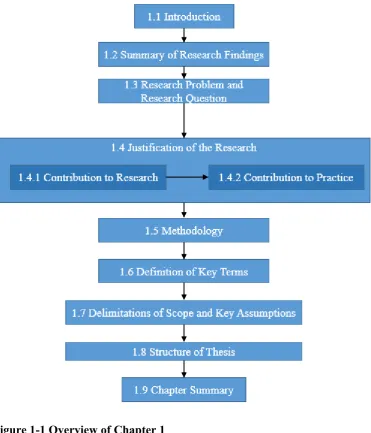
This research explores the association of IT Service Management (ITSM) Process Capability, Process Performance, and Business Performance. This first chapter introduces the research. The background and motivation to the research describe the context of the research and the need for the study. The background includes the description of ITIL® as the most widely accepted ITSM framework. The research problem and the research questions are then stated followed by the justification for the research in terms of contributions to knowledge and practice. The methodology for the collection and analysis of data is provided next. The definition of key terms used in the context of this research is provided, followed by the delimitations of scope and key assumptions. This chapter concludes with a description of the overall structure of this thesis.
This chapter is organized into nine sections. This section is an introduction to the first chapter. The background and motivation of the research are provided in section 1.2. The research problem and research questions are presented in section 1.3. Section 1.4
presents the contribution this research makes to theory and practice. The research methodology is provided in section 1.5. Section 1.6 defines the key terms used in this research. The delimitations of scope and the key assumptions of the study are presented in section 1.7. Section 1.8 provides the overall structure of the thesis. The chapter summary is provided in section 1.9.
2
Figure 1-1 Overview of Chapter 1
1.2 Background and Motivation
Global IT spending for 2018 is projected to total $3.7 trillion versus the 2017 estimated spending of $3.5 trillion (a 4.3% increase), according to a forecast by Gartner Incorporated (Gartner 2017). The forecast foresees that enterprise software and IT services will continue to exhibit strong growth, with IT spending on target to reach $931 billion in 2017, and increase 5.3 percent in 2018 to reach $980 billion (Gartner 2017).
3
throughout the forecast period of 2015 to 2020 as these industries invest in IT to advance their digital transformation efforts (International Data Corporation 2017). Academic research has shown that the cost of IT services can be as high as 60-90 percent of the total cost IT ownership (Addy 2007; Fleming 2005; Galup et al. 2009; Orlov 2005).
IT Service providers can no longer afford to only focus on technology, but instead, they now also have to consider the quality of the services they provide and their relationship with customers (Van Bon 2007). Other issues within the field of ITSM are that the cost of maintenance is too high, the speed of maintenance service is too slow and that there is difficulty in managing the priority of change requests (Marrone et al. 2014).
Many organizations are increasingly dependent on IT which is considered to be a critical enabler for transforming service industries (Chesbrough 2011; Huang, Wu & Chen 2013). Organizations expect that both internal and external IT suppliers continually improve the services provided (Galup et al. 2009; Pollard & Cater-Steel 2009) with a focus on customer service. IT Service Management (ITSM) focusses on customers as a core strategy for improving the delivery of IT services (Winniford, Conger & Erickson-Harris 2009). The benefits provided by ITSM can include an improved IT service at a lower cost with a focus on service rather than technology (Iden & Langeland 2010). ITSM is being increasingly implemented globally (Forbes 2017).
One ITSM framework often referred to as the best practice, is ITIL (Cannon 2011). See §2.4.1.3 for more details on ITIL. The ITIL framework eventually led to the creation of the international standard for ITSM: ISO/IEC 20000 (ISO/IEC 2011). Both ITIL and ISO/IEC 20000 provide a process-oriented framework to implement ITSM for organizations.
4
assessment is in line with the concept of continual improvement adopted in ISO/IEC 20000 (Shrestha 2015).
The principal goal of CSI is to continually align and realign IT services to changes in business practice by identifying and making appropriate improvements to ITSM processes (Shrestha 2015). CSI is vital to the business to provide relevance and responsiveness of IT services to customers, however, CSI activities are costly and resource intensive (OGC 2011b), and in addition, process improvement programs may be unsustainable over time if they are not effectively managed (Harkness, Kettinger & Segars 1996; Khurshid & Bannerman 2014). To dynamically align IT services to changes in business conditions and sustain process improvement projects, organizations have employed techniques that involve a systematic measurement of processes (Van Loon 2007).
A major challenge for organizations is to ensure that process improvement programs are cost-effective, and that assessments of processes are transparent in order to provide confidence in the assessment process and outcomes and to perform regular and consistent process assessments for CSI (Shrestha 2015).
An initial scan of the literature on ITSM and financial benefits revealed that there were no empirical studies that reported financial benefits from ITSM projects in actual monetary value. There is little academic research on the potential impact of ITSM processes to improve business performance and ultimately financial profitability (Gacenga, Cater-Steel & Toleman 2010).
1.3 Research Problem, Research Questions, and
Contributions
As technology is at the core of almost every leading industry, organizations are increasingly scrutinizing their IT group’s performance so that it is more in line with the overall business performance and contributes to the business’ bottom line
5
antiquated methods that do not adequately provide the quality, real-time solutions that organizations need at present to be competitive (Cater-Steel 2009).
Organizations need efficient ITSM processes in order to cut costs, but ironically, in order to implement highly capable processes, there are significant costs involved, both in terms of time and resources (Hochstein, Tamm & Brenner 2005). One way to achieve better performing and more capable processes is to employ methods to compare an organization’s processes against best practices and standards to identify gaps and receive guidance to improve the processes (Marrone et al. 2014).
One key issue reported in the industry is that most IT organizations have not yet embraced the business side (specifically Service Portfolio Management and IT Financial Management) aspects of ITSM (Steinberg 2013). Service Portfolio Management is used to manage investments in service management across the organization, in terms of financial values, that enables managers to assess the quality requirements and associated costs (Kohlborn et al. 2009). IT Financial Management aims to provide information on IT assets and resources used in delivering IT services (OGC 2011e). Providing an optimal Service Portfolio and practicing IT Financial Management requires a high level of maturity for an organization. It seems reasonable and logical that the organization’s Chief Information Officer should be able to articulate and justify the IT services provided, can report the costs (by service) to deliver these services, and can communicate the demand for those services, that is, how they are being consumed and will be consumed in the future. A major investment in terms of time and resources may be needed to catalogue such information and report on it.
The research problem that this study addresses is the lack of a pragmatic ITSM Measurement Framework that can be used to associate ITSM process capability and process performance with business performance. See §3.2.1 for a description of pragmatism research philosophy and why it was chosen for this research.
6
to associate ITSM process capability and process performance with financial profitability which prompts the first research question:
RQ1. How can the association of ITSM process capability and process performance with financial performance of an organization be determined?
The research develops and applies a measurement framework in iterative cycles to present a pragmatic and cost-effective method that links ITSM process capability, process performance, and financial performance by operationalizing Key Performance Indicators (KPIs) that support Critical Success Factors (CSFs) and associating CSFs with business risks to determine business financial performance (Behari et al. 2016). In order to test the association of ITSM process capability and process performance with business performance, a scholar-practitioner approach, based on action research principles, was followed to plan and implement a process improvement project in the case organization through active intervention. The outcome of the intervention is addressed through RQ1.
RQ2 examines the research project through a different lens, and affords the demonstration of how the intervention was conducted to answer RQ1. The Keys to IT Service Management Excellence Technique (KISMET) model (Jäntti, Lahtela & Kaukola 2010) was selected and justified to guide the application of the ITSM Measurement Framework to illustrate the efficiency and effectiveness of the method to achieve the outcomes. The output of RQ1 (the ITSM Measurement Framework) serves as input to answer RQ2. Application and evaluation of the KISMET model leads to the second research question:
RQ2. How can the ITSM measurement framework be demonstrated for CSI?
This exploratory study aims to develop and apply a pragmatic and cost-effective measurement framework for ITSM to determine the association of ITSM process capability and process performance with business financial performance, through a systematic process improvement approach that is grounded in theory.
7
1.3.1.1 Expected Contribution to Underpinning Theories
Agency Theory
By using Agency Theory as a backdrop to this research, it is expected that this research contributes to the problem of information asymmetry that is core to the principal-agent problem. It is anticipated that through collaboration of business (principal) and IT (agent) as well as the active intervention of the researcher, that this research informs theory by demonstrating how the information asymmetry gap can be bridged for the benefit of both the principal and agent.
Business-IT Alignment
It is expected that this research contributes to the literature on ITSM and Business-IT alignment by the application of a previously empirically tested process improvement framework to enable the alignment of business and IT. As a scholar-practitioner, the researcher endeavors to translate the theoretical prescriptions of the framework by using terminology more familiar in industry and practice.
Resource-Based View
This study draws on the resource-based view of the organization to demonstrate the attributes of a firm’s IT capability and its relationship to organizational performance. This study contributes to the growing body of literature linking IT and the resource-based view and provides a framework for understanding how IT may be aptly viewed as an organizational capability.
1.3.1.2 Expected Contribution to ITSM Literature
ITSM Adoption, Implementation, and Benefits
8
A contribution to the body of knowledge on process capability and process assessments is expected from this research, by the use of a standards-based maturity model and a transparent, efficient tool for process assessments.
ITSM Performance
By using a combination of CSFs and KPIs for the ITSM performance measurement, it is anticipated that this research will contribute to the literature on using CSFs and KPIs in IT performance measurement systems.
1.3.1.3 Expected Contribution to Research Methodology
Action Research
The use of action research in a real world environment (practice), using a process improvement model to guide the cycles, is expected to contribute to research methodology.
Actor-Network Theory
As an expected contribution to research methodology, the principles of ANT are followed to address the principal-agent issue in the industry at a broad level, and the business-IT alignment issue at the case study at a more specific level. ANT is operationalized throughout the research, rather than used as a methodological lens, to bridge the gap between IT and the business at the case organization. Through action research and frequent intervention, the researcher aligns the interests of actors through establishing a social and technological foundation for ITSM process improvement at Company X.
1.3.2 Expected Contribution to ITSM Industry and Practice
9
one from each ITIL lifecycle stage plus Service Desk and Workforce Worksheets. The Worksheet presents an inventory of recommended operational metrics, KPIs, and CSFs and the associated calculations for each one. The method of entering values for operational metrics and tolerance thresholds is generic. The model then automatically calculates the KPI values, compares them to the Tolerances and derives the KPI score. Critical Success Factors (CSFs) are automatically calculated based on the KPI values, Business Risk Mitigation levels are automatically calculated based on the derived CSF scores and the scores for the ITSM Performance Pyramid are automatically calculated based on the associated Business Risks.
The measurement framework designed and applied in this research project is expected to contribute to practice by providing an efficient and cost-effective method and model to identify opportunities to reduce costs and increase efficiency in ITSM processes that can ultimately lead to increased competitiveness.
Practitioners can expect to use the framework as a means for organizational self-improvement, to identify process gaps, to benchmark processes against best-practice standards within an organization, as well as guide an organization’s improvement efforts.
A practical measurement framework is developed to link ITSM process capability and process performance with financial performance. The measurement framework may be used to determine the effects on outcomes in a spreadsheet calculation through systematic changes in the input. The measurement framework presented in this study is designed so that it could be quickly implemented, adapted and evolved to meet the any organization’s needs (see section 3.5.2 Table 3-1 and section 7.3.4.1 Table 7-8). Practitioners can expect to drive continual service improvement by using the framework for process capability assessment, process perfromance measurement and financial measurement.
10
of the model establishes the link between ITSM process capability, process performance, and financial measures.
The next section justifies the research in terms of contribution to knowledge and practice.
1.4 Justification of the Research
There is no single approach to IT Service Management and organizations employ a variety of frameworks or processes to support their ITSM strategies. ITIL is the most widespread approach followed by Business Process Framework (eTOM) and Control Objectives for Information and Related Technologies (COBIT) (Forbes 2017). Organizations that implement ITIL do so with an expectation that the organization will benefit from its adoption. The expectations can be an improved IT service at a lower cost (Iden & Langeland 2010), standardized IT services (Marrone & Kolbe 2011), improved reliability and availability of IT services (Shang & Lin 2010), and cost savings (Cater-Steel, Tan & Toleman 2009a; Jäntti et al. 2013; Pollard & Cater-Steel 2009).
Implementing ITSM is costly (Göbel, Cronholm & Seigerroth 2013), and may be disruptive to an organization (Shang & Lin 2010), imposing business process changes to meet organizational goals (Tan, Cater-Steel & Toleman 2009).
In order to cut costs and become more efficient in ITSM related work, organizations need to use cost-effective methods to benchmark the organization’s processes against standards to identify gaps and receive guidance to improve processes (Göbel, Cronholm & Seigerroth 2013). Many of the existing methods require large investments in time and resources, and there is a lack of a systematic approach to process improvement (Göbel, Cronholm & Seigerroth 2013). The literature review confirmed the lack of a pragmatic model and method that demonstrates the association of ITSM process capability and process performance with business performance.
11
process performance with business performance and more specifically financial cost savings.
This research also addresses the need for academic research to be applied to practice, thus providing a rigor-relevance balance (Straub & Ang 2011) to propose a cost-effective method, model and approach to improve ITSM processes.
1.5 Methodology
This section provides an overview of the methodology used to address the research problem.
The exploratory study is a single-case study that follows a pragmatic research approach, enabling methodological triangulation (Denzin 1970), to explore the research problem. The case study method is well suited to this study as it allows rich data collection on service management processes, people, services, tools, and technologies. The case study approach is appropriate because this study focusses on modern-day events in a natural setting, and there is no robust theoretical base for the research (Yin 2013).
To enhance transferability, this case study uses methods such as surveys, interactive interviews, focus group workshops, observation, and secondary data (personal and official documents, physical data, and archived research data) to explore, describe and explain a complex situation in a real-life context.
A scholar-practitioner (American Psychological Association 2007) approach, which is similar to a participant-observer (Cochrane 1972) approach, was followed in this research.
Definitions of key terms in the context of this research are provided in the next section.
1.6 Definition of Key Terms
12
the research questions. Appendix A.1 has a complete alphabetical listing of all terms used in the context of this research.
Terms relating to RQ1: How can the association of ITSM process capability and process performance with financial performance of an organization be determined?
business unit - A segment of the business that has its own plans, metrics, income, and costs. Each business unit owns assets and uses these to create value for customers in the form of goods and services (OGC 2011e).
capability - The ability of an organization, person, process, application, IT service or other configuration item to carry out an activity. Capabilities are intangible assets of an organization (OGC 2011e).
cost - The amount of money spent on a specific activity, IT service or business unit. Costs consist of real cost (money), notional cost (such as people’s time) and depreciation (Van Bon et al. 2008).
critical success factor (CSF) - Something that must happen if an IT service, process, plan, project or other activity is to succeed (Rockart 1979).
first-line support - The first level in a hierarchy of support groups involved in the resolution of incidents where each level contains more specialist skills or has more time or other resources (OGC 2011d).
incident management - The process responsible for managing the lifecycle of all incidents to ensure that normal service operation is restored as quickly as possible and the business impact is minimized (OGC 2011d).
IT service - A service provided by an IT service provider that comprises a combination of information technology, people and processes (OGC 2011b).
13
ITIL® - A set of best-practice publications for IT service management that provides guidance on the provision of quality IT services and the processes, functions and other capabilities needed to support them (OGC 2011b)
key performance indicator (KPI) - A metric that is used to help manage an IT service, process, plan, project or other activity that is used to measure the achievement of each critical success factor (OGC 2011a, 2011c).
metric - Something that is measured and reported to help manage a process, IT service or activity (OGC 2011a).
operational - The lowest of three levels of planning and delivery (strategic, tactical, operational) that include operational activities such as the day-to-day or short-term planning or delivery of a business process or IT service management process (OGC 2011b).
operational cost - The cost resulting from running the IT services, which often involves repeating payments – for example, staff costs, hardware maintenance and electricity (OGC 2011b).
opportunity cost - A cost that represents the revenue that would have been generated by using the resources in a different way (OGC 2011e).
performance - A measure of what is achieved or delivered by a system, person, team, process or IT service (OGC 2011b).
process - A structured set of activities designed to accomplish a specific objective that takes one or more defined inputs and turns them into defined outputs. A process may define policies, standards, guidelines, activities and work instructions if they are needed (Van Bon et al. 2008).
14
second-line support – In ITIL Service Operation the second level in a hierarchy of support groups involved in the resolution of incidents and investigation of problems (OGC 2011d).
service - A means of delivering value to customers by facilitating outcomes customers want to achieve without the ownership of specific costs and risks (Van Bon 2004).
service management - A set of specialized organizational capabilities for providing value to customers in the form of services (Van Bon 2004).
Terms relating to RQ2: How can the ITSM measurement framework be demonstrated
for CSI?
Continual Service Improvement (CSI) - A stage in the lifecycle of a service. Continual service improvement ensures that services are aligned with changing business needs by identifying and implementing improvements to IT services that support business processes (OGC 2011a).
ITSM Process Capability - The ability of an organization, person, process, application, IT service or other configuration item to carry out an activity (OGC 2011e).
Process improvement – actions taken to change an organization’s processes so that they can more effectively and/or efficiently meet the organization’s business goals (ISO/IEC 2005).
KISMET – (Keys to IT Service Management and Effective Transition of Services) is an ITSM process improvement model, coordinated as a research project by the Software Engineering Research Unit of the Department of Computer Science at the University of Kuopio at the University of Eastern Finland (Jäntti, Lahtela & Kaukola 2010).
Scholar-Practitioner - expresses an ideal of professional excellence grounded in theory and research, informed by experiential knowledge, and motivated by personal values (Distefano, Rudestam & Silverman 2004).
15
1.7 Delimitations of Scope and Key Assumptions
A limitation of the study is that it depends on a single case study examining a single environment. A single case study sample limits generalizability (Myers 2008). The research is expected to make a contribution to the field through drawing attention to the details of processes and multiple stakeholder perspectives (Miles & Huberman 1994).
This study is limited to the extent that only the ITIL 2011 edition best practice framework will be used. While other best practice methodologies and related frameworks exist, such as the Microsoft Operations Framework or COBIT, this study confines the scope to only ITIL as the selected case study drives this decision. This may be seen as a limitation, as the outcome of the study may produce different results if other best practice frameworks are used.
An additional limitation is that the study will only focus on three ITSM processes: Incident, Problem and Change Management, as these are the processes currently implemented at the case organization. Studies have reported that these three processes are the most popular and are considered the highest priority (Marrone et al. 2014), as they have the least number of organizational constraints (Shrestha et al. 2012).
The survey data collection uses a pre-existing instrument, the Software Mediated Process Assessment (SMPA) tool (Shrestha 2015). This study used the SMPA tool for the process capability assessment, primarily for its transparency and convenience. A path for future research when using the SMPA approach is to further analyze the reliability of the assessment results before determining the capability rating of a process. The process attribute scores and corresponding capability level should be considered in light of the reliability measures. This study did not analyze the assessment reliability scores in detail but merely used the results at face value. Results from other process assessment methods can be easily incorporated into the measurement model by following the method outlined in Chapter 3.
16
undertaken to apply the framework in different industry sectors, using different tools for data collection and methods to calculate financial measures.
As indicated by the literature review, further research can be conducted using standard accounting measures and/or market measures to fit the model developed in this paper. As a result of these efforts, improvements in the performance of IT groups should contribute to overall business performance and profitability.
The overall structure of the thesis is presented in the next section.
1.8 Structure of Thesis
The structure of the thesis is based upon the recommendations of Perry (1998) and the University of Southern Queensland PhD guidelines (USQ 2017). The language used in this thesis is United States English, as the researcher is based in the United States. The thesis comprises eight chapters. For ease of readability, the section mark § is used to denote a chapter section of the document.
Chapter 1 (this chapter) provides the background and motivation to the research. The research problem and research questions are presented with the justification of the research. This chapter also includes the expected contributions to research and practice, an overview of the methodology, key definitions, limitations of the research and agenda for further research.
Chapter 2 consists of the review of the literature.
Chapter 3 presents the blueprint of the study, detailing the overall design and approach that is underpinned by the research philosophy, epistemology and ontology. The chapter also outlines the research method and the action research approach followed in the study. A detailed description of the research orientation, ethical considerations, trustworthiness and validity are also provided.
17
Chapter 5 presents the details of the first cycle of the action research study using the KISMET model as a guide. This chapter uses the model designed in chapter 4 to generate the results.
Chapter 6 presents the details of the second cycle of the action research study. This chapter uses and enhances the model designed in Chapter 4. The results of the first action research cycle are compared to the results of the second cycle.
Chapter 7 presents a discussion of the research findings. This chapter provides a critical examination of the research results with discussions based on the context of the research method and reviewed literature. Discussions are structured around the research questions with a reflection on research work conducted and the presentation of key themes emerging from this research.
Chapter 8 summarizes the research findings and how this research addressed the research problem. The contribution of research to the body of knowledge is discussed and implications of the research to theory and practice are presented. Then, the limitations of the research and directions for future research are presented.
1.9 Chapter Summary
18
CHAPTER 2 LITERATURE REVIEW
2.1 Introduction
Chapter 1 introduced the research topic: IT Service Management: Process Capability, Process Performance, and Business Performance. This chapter presents a review of the academic literature and practitioner knowledge to support the research problem as described in chapter 1. Section 2.1 introduces the chapter. Section 2.2 presents the literature review strategy used in this research and section 2.3 provides the literature review protocol. Section 2.4 presents the theoretical framework of the study and
section 2.5 discusses the theories specific to the research problem. Section 2.6
summarizes this chapter. Figure 2-1 illustrates an overview of chapter 2.
19
2.2 Literature Review Strategy
The literature review applied the Systematic Mapping (SM) methodology (Peersman 1996) as opposed to the Systematic Literature Review (SLR) (Cochrane 1972) approach. This decision to utilize the SM method instead of an SLR is in line with the views of Kitchenham et al. (2009).
Systematic mapping is a literature review methodology that has been neglected in Information Technology research but is common in medical research but (Petersen et al. 2008). A systematic mapping study delivers a structure of the type of research studies and results that have been published by categorizing them and providing a visual map of the results (Petersen et al. 2008). Systematic mapping requires less effort than the SLR and allows the evidence in a domain to be mapped at a high level of granularity. Systematic mapping studies have previously been recommended mainly for research areas where there is a lack of relevant, high-quality primary studies (Kitchenham & Charters 2007). The systematic map of the literature review forms the basis for this chapter (see Appendix A.2).
The number of journal articles and conference papers selected for further analysis are charted in Figure 2-2 showing their years of publication.
Figure 2-2 Number of journal articles and conference papers
20
2.3 Literature Review Protocol
The literature review protocol specifies the research questions being addressed, methods used to perform the review, the search strategy, inclusion and exclusion criteria, information to be obtained from each primary study, and the quality criteria by which to evaluate each primary study. Table 2-1 presents the literature review protocol used in this research.
Table 2-1 Literature Review Protocol
Literature Review Criteria
Search Measures
Search Strategy Keyword searches in ITSM and performance
measurement domains. Searches performed on Google Scholar, Association of Information Systems (AIS) electronic library, Decision Sciences, ScienceDirect, Elsevier, IEEE Xplore, SpringerLink.
Search Terms ITIL, IT Infrastructure Library, ITSM, IT service management, ITIL maturity, ITSM maturity, ITIL capability, ITSM capability, ITIL process assessments, ITSM process assessments, ITSM performance measurement, ITIL performance measurement, IT service, ITIL metrics, ITSM metrics, ITSM benefits, ITIL benefits, ITIL value, ITSM value, ITSM performance, ITIL performance, IT performance, IS performance, performance measurement design, performance measurement frameworks, BSC, Balance scorecard, Service management, Business-IT alignment, Strategic alignment, IT and Resource-Based View, IT and Knowledge-Based View, IT financial management, IT financial measures
Quality criteria for evaluating primary study
Academic books, peer-reviewed journal articles, conference papers, technical reports and electronic articles.
Industry books, whitepapers, and reports.
Inclusion and exclusion criteria
Included: Academic publications: books, peer-reviewed journal articles and conference papers, and technical reports. Industry publications: books, journal articles, white papers and technical reports.
21
Using the literature review protocol presented in Table 2-1 a review was performed on empirical and theoretical studies covering ITSM adoption, implementation, benefits, process capability, process improvement and financial performance. Both academic and industry publications were included. The review primarily used online searches of bibliographic online databases and library catalogs. Literature searches were performed on Google Scholar as well as the Association of Information Systems (AIS) basket of eight journals (AIS 2011): European Journal of Information Systems (EJIS), Information Systems Journal (ISJ), Information Systems Research (ISR), Journal of AIS (JAIS), Journal of Information Technology (JIT), Journal of MIS (JMIS), Journal of Strategic Information Systems (JSIS) and MIS Quarterly (MISQ). Literature searches were also performed on AIS conferences, including International Conference on Information Systems (ICIS), European Conference on Information Systems (ECIS), Americas Conference on Information Systems (AMCIS), Pacific Asia Conference on Information Systems (PACIS), Australasian Conference on Information Systems (ACIS), and Hawaii International Conference on System Sciences (HICSS). The articles retrieved in the search were reviewed and literature addressing ITSM benefits, IS, ITIL and ITSM performance measurement were further analyzed Articles from peer-reviewed academic publications were supplemented with industry press books, white papers, and web pages.
The theoretical framework of the research is presented next.
2.4 Literature Review Framework
22
23
Dichotomizing the research topic presents two main streams of literature: IT and Business. The theory that glues these streams of literature is Agency Theory- IT being the agent and business the principal. Based on the Agency theory, the literature review narrowed the focus to Strategic Alignment Theory and Business-IT Alignment. Working down the hierarchy from this level focusses the literature review on ITSM Process Maturity and Business Performance, using the Resource-Based View as a guide. Finally, all the lower levels of the hierarchical literature review framework were guided by the Actor-Network Theory.
The next two major sections of this chapter (§2.5 and §2.6) provide a review of the parent theories and focus theories. Theory in interpretive IS case studies can play different roles, that can be used as an initial guide to design and data collection; as part of an iterative process of data collection and analysis; and as a final product of the research (Walsham 1995). The theory reviewed in §2.4 was used to create an initial theoretical framework which takes account of previous knowledge to create a theoretical basis to inform the topics and approach of the early empirical work. The literature reviewed in §2.5 used theory as an iterative process of data collection and analysis, with initial theories being expanded and revised.
2.5 Parent Theories
2.5.1 Agency Theory
24
monitor and evaluate activity in the organization. The perceived view of IT governance is that the outcomes or focus of these measures is to create strategic alignment, risk management, performance management, delivery of business value through IT, as well as capability management (Bardhan et al. 2010; De Haes & Van Grembergen 2004; Luftman & McLean 2004; Papp 1999; Peppard & Breu 2003). Since IT governance is a form of corporate governance, §2.4.1.1 reviews the literature on corporate governance before the discussion on IT governance in § 2.4.1.2.
2.5.1.1 Corporate Governance
There has been increased scrutiny in the issue of corporate governance over the past decade, focusing on improved transparency and accountability (Subramanian 2015). The modern practice of corporate governance can be traced back to the 17th-century
Dutch Republic (Frentrop 2003; Gelderblom, De Jong & Jonker 2013; Lukomnik 2016), where, in 1609, the world’s first publically listed company, the Dutch East India Company (Funnell & Robertson 2013), had a corporate governance dispute between shareholders and directors (Mueller 2012). The seminal work of the legal scholars Adolf Augustus Berle and Gardiner Means in the 1930s is pivotal to an understanding of the changing role of modern corporations in society (Berle Jr & Means 1930). The principal-agent problem was established in the 1980s as an approach to understanding corporate governance (Fama & Jensen 1983), where a corporation is seen as a