Isoform Usage That Are Important for the Maintenance of Latency
Nicholas J. Homa,aRaul Salinas,aEleonora Forte,a,b* Timothy J. Robinson,a,bMariano A. Garcia-Blanco,a,bMicah A. Luftiga
Department of Molecular Genetics and Microbiology, Center for Virology, Duke University Medical Center,aand Center for RNA Biology,bDuke University, Durham, North
Carolina, USA
Oncogenic viruses promote cell proliferation through the dramatic reorganization of host transcriptomes. In addition to regu-lating mRNA abundance, changes in mRNA isoform usage can have a profound impact on the protein output of the transcrip-tome. Using Epstein-Barr virus (EBV) transformation of primary B cells, we have studied the ability of an oncogenic virus to al-ter the mRNA isoform profile of its host. Using the algorithm called SplicerEX with two complementary Affymetrix microarray platforms, we uncovered 433 mRNA isoform changes regulated by EBV during B-cell transformation. These changes were largely orthogonal with the 2,163 mRNA abundance changes observed during transformation, such that less than one-third of mRNAs changing at the level of isoform also changed in overall abundance. While we observed no preference for a mechanistic class of
mRNA isoform change, we detected a significant shortening of 3=untranslated regions and exclusion of cassette exons in
EBV-transformed cells relative to uninfected B cells. Gene ontology analysis of the mRNA isoform changes revealed significant enrich-ment in nucleic acid binding proteins. We validated several of these isoform changes and were intrigued by those in two mRNAs encoding the proteins XBP1 and TCF4, which have both been shown to bind and activate the promoter of the major EBV lytic
trans-activator BZLF1. Our studies indicate that EBV latent infection promotes the usage of mRNA isoforms of XBP1 and TCF4 that restrict BZLF1 activation. Therefore, characterization of global changes in mRNA isoform usage during EBV infection iden-tifies a new mechanism for the maintenance of latent infection.
E
pstein-Barr virus (EBV) is an oncogenic gammaherpesvirusthat is causally implicated in a number of malignancies, which include African endemic Burkitt’s lymphoma, diffuse large-B-cell lymphomas in the setting of immune suppression, and
nasopha-ryngeal carcinoma (1).In vitroinfection of primary B cells by EBV
drives proliferation and leads to the establishment of indefinitely proliferating lymphoblastoid cell lines (LCLs). This growth trans-formation is facilitated by the EBV latency-associated proteins, which include the Epstein-Barr virus nuclear antigens (EBNAs) EBNA1, EBNA2, EBNA3A, EBNA3B, EBNA3C, and EBNA-LP, as well as the latent membrane proteins (LMPs) LMP1, LMP2A, and LMP2B, in an infection program termed “latency III.” Upon
in-fection, EBV induces changes in host mRNA expression (2,3) via
EBNA2 and EBNA-LP that drive proliferation (4,5) and via LMP1
induction of the NF-B signaling pathway to promote cell survival
(3,6). The EBNA3 proteins serve as critical transcriptional
repres-sors in the cell (7,8), and EBNA1 ensures faithful replication and
maintenance of the EBV episome, as well as has important
tran-scriptional enhancer activity (9–13). The latent infection
estab-lished in LCLs also strongly represses lytic virus replication. The regulation of the EBV lytic cycle is primarily enacted
through the promoter of the major lytictrans-activator BZLF1, or
Z (1). The Z promoter receives inputs, including stressors, such as
DNA damage and phorbol ester treatment, signaling through the B-cell receptor (BCR), and cues downstream of plasma cell
differ-entiation (14–16). The criticalcis-acting elements in the Z
pro-moter have been well characterized, as have thetrans-acting
fac-tors that promote Z transcription (1). Histone acetylation also
plays an important role in the regulation of Z, and the balance between recruitment of histone acetyltransferases versus histone
deacetylases by thesetrans-acting factors promotes the switch
be-tween latency and lytic reactivation (17). The downstream cascade
of viral gene products activated by Z, including the transcription
factor BRLF1, or R, and the initiation of viral DNA replication, capsid assembly, and virion maturation follow the rubric
estab-lished in other lytic herpesvirus infections (18). The distinction in
the setting of EBV is that B-cell infection is typically tightly latent, and therefore, Z-promoting factors in these cells must be kept in check to prevent triggering of the lytic infection cycle.
The levels of mRNAs in cells are regulated by transcription as well as co- and posttranscriptional events that can generate diverse mRNA isoforms. Alternative isoform usage provides a means to greatly increase the diversity of protein species within a cell as well as to regulate the localization, stability, and translation of mRNAs through altering recognition by RNA binding proteins (RBPs)
and microRNAs (miRNAs) (19,20). Recent genome-wide studies
have demonstrated that 94% of all protein-coding genes generate
multiple mRNA transcripts (21). Indeed, a large number of
hu-man genetic diseases are thought to be caused by aberrant mRNA
splicing (22). Furthermore, alternative mRNA processing that
functionally alters protein output has been implicated in virus
infections and cancer (23–25). Therefore, it is likely that an
onco-genic virus such as EBV will dramatically alter not only cellular mRNA abundance but also cellular mRNA isoform usage during
Received27 August 2013 Accepted29 August 2013
Published ahead of print11 September 2013
Address correspondence to Micah A. Luftig, [email protected].
* Present address: Eleonora Forte, Department of Microbiology-Immunology, Northwestern University, Feinberg School of Medicine, Chicago, Illinois, USA.
Supplemental material for this article may be found athttp://dx.doi.org/10.1128 /JVI.02464-13.
Copyright © 2013, American Society for Microbiology. All Rights Reserved.
doi:10.1128/JVI.02464-13
on November 7, 2019 by guest
http://jvi.asm.org/
B-cell infection, and this may have important consequences for disease progression.
In this study, we used the SplicerEX algorithm to investigate changes in host mRNAs regulated by EBV infection of primary B cells upon transformation into LCLs at the level of both total mRNA abundance and mRNA isoform usage. We identified a novel set of mRNAs regulated at the level of isoform choice, and this was largely independent of EBV-regulated mRNA abundance changes. We validated several predicted isoform changes by iso-form-specific quantitative reverse transcription-PCR (qRT-PCR). We also identified two genes, XBP1 and TCF4, whose alternative isoform usage plays an important role in the regulation of the switch between latent and lytic replication of the virus through transcriptional regulation of the Z promoter.
MATERIALS AND METHODS
Cell lines and culture conditions.B cells were purified from healthy do-nor buffy coats through the Carolina Red Cross and Gulf Coast Regional Blood Center and transformed to monoclonal LCLs as described previ-ously (26). BL41 is an EBV-negative Burkitt’s lymphoma cell line. BL41/ B95-8 is BL41 latently infected with the B95-8 strain of EBV (BL41 lines were gifts of Elliott Kieff, Harvard Medical School). Akata is an EBV-positive Burkitt’s lymphoma cell line (kind gift of Kenzo Takada). ES-1 is an LCL that is deficient for LMP2A and was a gift from Richard Long-necker. Cells were grown in RPMI 1640 supplemented with 10% fetal bovine serum (FBS), 20 mML-glutamine, 1% penicillin, and 1%
strepto-mycin.
RNA and cDNA preparation and PCR.RNA was isolated from cells using a Qiagen RNeasy Plus kit or Qiagen RNeasy microkit. cDNA syn-thesis was performed using an Applied Biosystems high-capacity cDNA reverse transcription kit. Quantitative RT-PCR was performed using Quanta Biosciences SYBR green on an Applied Biosystems StepOne Plus quantitative PCR instrument in technical duplicate or triplicate with a standard deviation between technical replicates of⬍0.5. The threshold cycle (⌬⌬CT) method of relative abundance changes was used to
deter-mine the fold change in the abundance of targets relative to the average abundance of that target in the B cells tested. Reactions were normalized to those for exons from the genes SETDB1 and SYNE1, which were deter-mined by SplicerEX to remain stable between resting B cells and LCLs. All experiments reported were performed in biological triplicates (e.g., with cells from at least three healthy human donors), where the results for two representative donors are shown in each figure. Fold change data were used to perform the statistical analyses whose findings are presented in Results. RT-PCRs were performed using Invitrogen PlatinumTaqDNA polymerase high fidelity in an Eppendorf Mastercycler apparatus, and the results were visualized on 1% or 2% Tris-acetate-EDTA (TAE) agarose gels. Quantification of gel bands was performed using the GeneTools soft-ware from Syngene.
IRE1-dependent splicing of XBP1 assays were carried out by pretreat-ing cells for 1 h with either 0.1% dimethyl sulfoxide or 100M STF083010 (STF; Sigma-Aldrich). Cells were then washed in phosphate-buffered saline before being returned to RPMI 1640 and treated with 100g/ml anti-IgG antibody (Jackson ImmunoReasearch) for 0, 1, 2, 4, or 8 h. RNA was extracted and cDNA was synthesized as described above. PCR was performed using primers flanking the inositol-requiring protein 1 (IRE1) splice site. Following PCR, one half of the reaction mixture was digested with the PstI restriction enzyme (NEB) for 2 h at 37°C, while the other half was left undigested. The reactions were visualized on a 2% TAE agarose gel. In the Akata and ES-1 cells, XBP1h is a hybrid product that is gener-ated as a result of the annealing of one strand of the spliced XBP1 (XBP1s) PCR product and one strand of the unspliced XBP1 (XBP1u) PCR prod-uct, which is resistant to PstI digestion, as described in references27and 28. Here, XBP1h indicates the presence of the spliced transcript.
Plasmids and cloning.The pCEP4-EGFP plasmid was a generous gift from Seiji Maruo. Full-length TCF4 (TCF4-FL) was cloned from cDNA purchased from Open Biosystems (material no. MHS4426-99625743) by Gateway recombination cloning technology (Life Technologies). pDONR221 (a gift from Bryan Cullen) was used as the donor vector, and pSG5 engineered for Gateway cloning with an N-terminal 6⫻His tag and a hemagglutinin-tagged protein expression cassette (a gift from Eric Jo-hannsen) was used as the destination vector.
Primers.All primers for all RT-PCR, qRT-PCR, and cloning reactions are listed in Table S1 in the supplemental material.
Microarray analysis.The analysis of U133 and human exon (HuEx) arrays from resting human B cells and LCLs from four independent do-nors (GEO accession numberGSE29301) was performed as described in reference26. Briefly, SplicerEX uses a maximum likelihood ratio (MLR) to compare the relative likelihood that changes in probe set expression levels are described by alternative processing versus overall transcription level changes. This base MLR is modified by a multiple-probe-set correc-tion to adjust for multiple paired groups of probe sets, an expression cutoff modifier for the minimum required change between isoforms, and a centering modifier that preferentially ranks genes with probe sets whose levels are changing in opposite directions. These parameters are used to generate a final splice score. For SplicerEX to categorize an mRNA to be undergoing alternative processing, it must have a positive splice score and analysis of variance and SplicerEXPvalues of⬍0.01.
SplicerEX computed the overall mRNA abundance from the U133 arrays using the probe set that reported the most statistically significant change in expression by a simplettest of log2expression values between B
cells and LCLs. SplicerEX computed overall mRNA abundance for the HuEx arrays by identifying the largest meta-probe set within each gene (composed of the most individual probe sets) and then performed a two-tailed, homoscedasticttest of meta-probe set expression values in B cells and LCLs. For an mRNA to be called increasing or decreasing in overall abundance it had to have a⬎2-fold change. Correction for multiple-hypothesis testing was not performed to minimize the likelihood of falsely rejecting an overlap between overall and isoform-specific mRNA expres-sion changes.
Gene ontology analysis.Gene ontology analyses were performed us-ing the PANTHER classification system (29). SplicerEX-predicted mRNA isoform changes (splice score,⬎0;P⬍0.01) and abundance changes (⬎2-fold change;P⬍0.01) were compared to the values for a reference set of all genes whose U133 probe sets had log2expression of⬎6 or whose
HuEx probe sets had log2expression of⬎8. Analysis was carried out for
the SplicerEX data generated from each microarray platform indepen-dently, as well as combined. A gene ontology group in Data Sets S3 and S4 in the supplemental material had to havePvalues of⬍0.05 to be called significantly enriched or depleted (indicated by green or red font, respec-tively).
Transfections and anti-Ig antibody treatment. Akata cells were transfected using a Digital Bio MicroPorator MP-100 system with one pulse at 1,470 V for 30 ms in a 100-l tip at a cell density of 10 million cells/ml using a Neon transfection system (Life Technologies). Five mi-crograms pCEP4-EGFP plasmid or 1g pCEP4-EGFP and 4g pSG5-TCF4-FL plasmids were used per 1 million cells. Cells were allowed to grow in RPMI 1640 supplemented with 15% FBS (R15) for 48 h posttrans-fection. Green cells were sorted using a BD DiVa cell sorter on the basis of green fluorescent protein (GFP) positivity with a 488-nm argon laser and a 530/30-nm filter. GFP-positive cells were placed back in the R15 me-dium and treated for 0 or 8 h with 100g/ml anti-IgG antibody from Jackson ImmunoResearch before harvesting for RNA.
Western blotting and antibodies. Western blots were run on NuPAGE 4 to 12% bis-Tris polyacrylamide gels (Life Technologies) and were transferred to a polyvinylidene difluoride membrane in the presence of 20% methanol in Tris-glycine at 60 V for 75 min. TCF4 membranes were blocked with 3% milk in Tris-buffered saline–Tween 20 for 1 h at room temperature, blotted with primary antibody (sc-48947; Santa Cruz
on November 7, 2019 by guest
http://jvi.asm.org/
Biotechnology) in 1% bovine serum albumin (BSA) overnight at 4°C, and blotted with horseradish peroxidase (HRP)-conjugated secondary anti-body (705-035-003; Jackson ImmunoResearch) in 3% milk for 1 h at room temperature. The exon junction complex component MAGOH was used as a control for protein expression between uninfected and infected cells. MAGOH membranes were blocked with 5% BSA for 1 h at room temperature, blotted with primary antibody (sc-56724; Santa Cruz Bio-technology) in 5% BSA overnight at 4°C, and blotted with HRP-conju-gated secondary antibody (715-035-150; Jackson ImmunoResearch) in 5% BSA for 1 h at room temperature. EBNA3C membranes were blocked with 5% milk for 1 h at room temperature, blotted with primary antibody (F125P; Exalpha Biologicals) in 5% milk overnight at 4°C, and blotted with HRP-conjugated secondary antibody (713-035-003; Jackson Immu-noResearch) in 5% milk for 1 h at room temperature. Blots were devel-oped using SuperSignal West Femto maximum-sensitivity substrate (Thermo Scientific). Quantification of bands was performed using Gene-Tools software from Syngene.
RESULTS
EBV infection of primary B cells induces changes in alternative
mRNA exon usage.Infection of primary B cells by EBV
dramati-cally reorganizes the cellular transcriptome via multiple mecha-nisms, ranging from transcriptional activation, effects on RNA
stability, and alternative splicing (3,6,26,30). While most studies
have focused on EBV-induced mRNA abundance changes, we used the primary B-cell infection system to assay the effects of EBV on mRNA isoform usage. Resting primary B cells from four healthy donors were infected with the B95-8 strain of EBV at lim-iting dilution to generate monoclonal LCLs. Transcript isoform changes were analyzed using two microarray platforms: the U133 Plus 2.0 array and the Human Exon 1.0 ST array. U133 arrays
predominantly detect the 3=untranslated regions (UTRs) of
mR-NAs, while HuEx arrays detect exons throughout the entirety of mRNAs, and the combined use of these two platforms provides better coverage of all events occurring across entire transcripts
(26,31). HuEx arrays detect nearly every exon in the genome, with
56,598 probe sets querying 8,006 expressed genes, with an average of 7 exons being interrogated per gene. Importantly, 2,613 genes (of 8,409 expressed) are detected on the U133 array targeting mul-tiple exons, such that differential expression of mRNA isoforms
can be studied on this platform (32). The SplicerEX algorithm was
used to assess alternative exon usage and overall mRNA abun-dance changes mediated by EBV infection from data obtained
using both microarray platforms (Fig. 1A; see Data Set S1 in the
supplemental material).
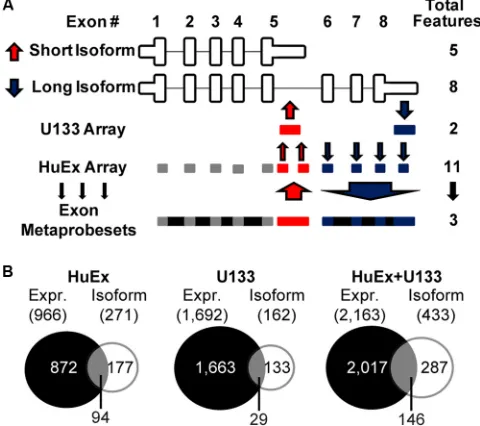
HuEx arrays detected 966 mRNAs whose abundance changed
⬎2-fold between B cells and LCLs (P⬍0.01), with 723 increasing
and 243 decreasing, while U133 arrays detected 1,692 mRNAs whose abundance changed, with 1,484 increasing and 208 de-creasing. Importantly, there was substantial overlap in mRNA abundance changes among commonly detected genes on these
two platforms (26). EBV infection changed 433 cellular mRNAs at
the level of isoform usage, with 271 of these events detected on the
HuEx array and 162 detected on the U133 array (Fig. 1B; see Data
Set S2 in the supplemental material). Only 34% of the mRNAs that displayed altered isoform usage were also changed in overall
abun-dance (Fig. 1B; HuEx array, 94/271; U133 array, 29/162; total,
146/433). Similarly, only⬃7% of total differentially expressed
mRNAs changed at the level of isoform usage (146/2;163 were common between both platforms). As has been noted in other
analyses (33), our data indicate that the set of mRNA isoforms
regulated by EBV is largely orthogonal with the set of mRNAs changed at the level of overall abundance.
EBV infection induces host cell mRNA 3=UTR shortening
and exon exclusion.The SplicerEX algorithm categorizes mRNA
alternative isoform usage into distinct classes of transcriptional or
processing events, including (i) alternative 5=initiation, (ii)
inter-nal cassette exon inclusion or exclusion, (iii) alternative 3=
termi-nal exon choice, (iv) tandem 3=UTR choice, and (v) changes in
transcript length that do not fall into any of the aforementioned categories (see Data Set S2 in the supplemental material). Consis-tent with their focused array design, the EBV-induced mRNA iso-form changes detected on the HuEx platiso-form were predominantly
internal and 5=initiation changes, and those detected on the U133
platform were predominantly tandem 3=UTR length or 3=
termi-nal exon choice changes (Fig. 2A). When combining the data from
both platforms, however, we failed to identify a preferential
mRNA isoform event class regulated by EBV (Fig. 2A).
In contrast, EBV infection preferentially altered the direction-ality of cellular mRNA isoform choice. Specifically, EBV infection
strongly favored the shortening of tandem 3=UTRs, with 86/96 of
mRNAs whose 3= UTR changed being shortened rather than
lengthened (Fig. 2B). These data are consistent with recent
obser-vations indicating that cell proliferation triggers mRNA 3=UTR
shortening (20,34). EBV infection also favored exclusion of
inter-nal cassette exons (54 excluded/83 total cassette events). No pref-erence of EBV-regulated mRNA isoforms with regard to the di-rectionality (upstream versus downstream sites) of alternative
FIG 1SplicerEX analysis of alternative mRNA expression and isoform usage. (A) Schematic of SplicerEX method used to identify alternative isoforms in a generic mRNA. SplicerEX combines probes that are changing similarly into larger meta-probe sets. Probes detecting upregulated exons (UP probes) are represented in red and increase in abundance relative to the other probes for sequences within the gene upon transformation. Probes detecting downregu-lated exons (DOWN probes) are represented in blue and decrease in abun-dance relative to the other probes for sequences within the gene. Gray blocks, probe sets that are not changing significantly upon transformation. SplicerEX uses the UP and DOWN features to predict the alternative isoform usage. (B) Venn diagrams of genes whose mRNAs are changing either in abundance or at the level of alternative isoforms, as predicted by SplicerEX between the two arrays. Expr., expression.
on November 7, 2019 by guest
http://jvi.asm.org/
[image:3.585.300.540.69.282.2]transcription initiation or alternative 3=-terminal exon choice was observed.
Diverse biological processes and pathways are regulated by EBV infection at the level of alternative mRNA isoform usage.In order to assess the biological significance of the EBV-regulated mRNA isoform changes, the PANTHER algorithm was used to identify pathways and biological processes that were enriched in the set of 433 genes whose mRNA isoforms changed following EBV infection. A parallel PANTHER analysis was performed us-ing the 2,163 genes whose overall mRNA abundance changed due to EBV infection. Genes associated with the biological processes of cell cycle and mitosis were strongly enriched in both of these gene
sets (Table 1; see Data Sets S3 and S4 in the supplemental
mate-rial); however, genes associated with exocytosis and protein trans-port were exclusively enriched among those regulated at the
mRNA isoform level (see Data Sets S3 and S4 in the supplemental material).
Molecular functions, cellular components, and protein classes were even more divergent between mRNAs regulated at the level of abundance versus isoform. The proteins encoded by the set of genes corresponding to those mRNAs changed at the level of iso-form were enriched for cysteine proteases and nucleic acid
bind-ing proteins (Table 1; see Data Set S3 in the supplemental
mate-rial). More specifically, RNA binding proteins, including splicing factors, and DNA binding proteins were enriched. In contrast, nucleic acid binding proteins, including splicing factors, were strongly depleted in the set of mRNAs regulated by EBV at the
level of overall transcript abundance (Table 1; see Data Set S4 in
the supplemental material). These data further strengthen the ob-servation that the mRNAs regulated by isoform change are
dis-FIG 2Categorization and directionality of SplicerEX-predicted mRNA isoform changes. (A) Categories of isoform changes, as described in the text and (26) detected on each array individually or on both arrays combined. Categories include tandem 3=UTRs, an alternative 3=terminal exon (TE) choice, alternative 5=
[image:4.585.136.447.66.311.2]initiation (Init) sites, inclusion/exclusion of an internal cassette exon, changes in the length of the transcript that could not be categorized in any of the previous groups, or a null hypothesis if the two primary distinguishing features (most significant UP or DOWN meta-probe sets) do not overlap a known University of California, Santa Cruz (UCSC) transcript. (B) Directionality of specific categories of isoform changes detected on both arrays combined. Relative to the isoforms present in B cells, tandem 3=UTRs are classified as lengthened or shortened 3=-terminal exon choice, 5=initiation sites are classified as more 5=or more 3=, and internal cassette exons are classified as inclusion or exclusion.Pvalues were calculated using a binomial probability distribution.
TABLE 1Enrichment or depletion of gene ontology groups of alternatively regulated mRNAsa
Biological process or pathway
Alternative mRNA isoform Total mRNA abundance
Observed abundance Expected abundance Pvalue Observed abundance Expected abundance Pvalue
Cellular processes, cell cycle
Molecular function Nucleic acid binding
DNA binding RNA binding Splicing factors
aGreen, enrichment of genes in a given group; red, depletion of genes in a given group.
on November 7, 2019 by guest
http://jvi.asm.org/
[image:4.585.39.554.612.715.2]tinct from those regulated at the level of abundance, both in ab-solute terms and in broad functional terms.
EBV regulates mRNA isoform usage of RBPs.Strong
enrich-ment of RNA binding proteins (RBPs) was observed in EBV-reg-ulated mRNAs changing at the level of isoform usage, while less than the expected number of RBPs changed at the level of overall
mRNA abundance (Table 1; see Data Set S3 in the supplemental
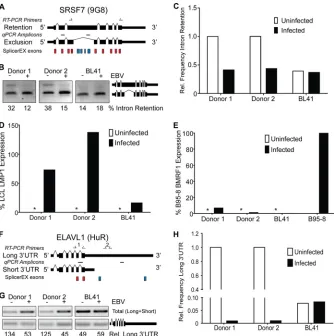
material). EBV infection altered the mRNA isoform of 24 RBPs, 12 of which were splicing factors. To validate our microarray-based observations, we assessed a subset of the predicted isoform changes in primary B cells and EBV-transformed LCLs using RT-PCR and qRT-RT-PCR. We focused on two significant mRNA iso-form changes: those in the splicing factor SRSF7, also known as 9G8, and those in the mRNA stability factor ELAVL1, also known as HuR.
SplicerEX predicted that EBV infection inhibited the retention of an intron between exons 3 and 4 of SRSF7, which represents a
previously well-characterized mRNA isoform of SRSF7 (Fig. 3A)
(35,36). To validate this prediction, we assayed the retention of
intron 3 in B-cell (with B cells from two healthy human donors) and LCL pairs by RT-PCR. EBV infection decreased the relative
expression level of SRSF7 mRNAs containing intron 3 (Fig. 3B).
To determine whether latent EBV infection contributed to the loss of SRSF7 intron 3 or if EBV-driven proliferation of resting B cells was responsible, we assayed this event in the EBV-negative Burkitt’s lymphoma cell line BL41 and its latent EBV-infected counterpart, BL41/B95-8. In this case, BL41 cells already displayed minimal expression of the intron 3-retained SRSF7 isoform, and
latent EBV infection of BL41 cells did not change this (Fig. 3B).
Moreover, qRT-PCR confirmed that the exclusion of intron 3
FIG 3Validation of RNA binding proteins predicted to change at the isoform level by SplicerEX. (A) Exon schematics of SRSF7 gene. Red blocks, SplicerEX UP probe sets; blue blocks, DOWN probe sets; single-headed arrows above the schematics, the primers used in RT-PCRs; horizontal hashes between the isoform schematics, amplicons generated in qRT-PCRs. (B) Gel of RT-PCR using the primers shown in panel A flanking the retained/excluded intron in SRSF7 from two donor-matched B-cell and LCL pairs and BL41 versus BL41/B95-8 cells. The upper band represents intron retention, and the lower band represents intron exclusion. The quantification below the gel represents the frequency of intron retention. (C) Isoform-specific qRT-PCR depicting the frequency of intron retention in SRSF7 relative to the B-cell average using the amplicons shown in panel A. Rel., relative. (D) qRT-PCR depicting the latency-associated LMP1 mRNA expression in the B-cell and LCL pairs and BL41 versus BL41/B95-8 cells. A value of 100% represents the average LMP1 expression in the LCLs. *, a signal that was not detectable over the background or where the standard deviation between technical replicates did not meet our threshold of 0.5 cycle. (E) qRT-PCR depicting lysis-associated BMRF1 mRNA expression in the B-cell and LCL pairs and BL41 versus BL41/B95-8. A value of 100% represents the BMRF1 expression in the B95-8 cell line. *, a signal that was not detectable over the background. (F) Exon schematics of ELAVL1 gene. The color scheme is the same as that described for panel A. (G) Gel of RT-PCR targeting the coding sequence and the long 3=UTR (primer sets 1 and 2, respectively, in panel F) of ELAVL1 from two donor-matched B-cell and LCL pairs and BL41 versus BL41/B95-8 cells. Upper band, total amount of ELAVL1 mRNA in the cells (primer set 1); lower band, amount of the long 3=UTR isoform specifically (primer set 2). The quantification below the gel represents the relative frequency of the long 3=UTR isoform. (H) Isoform-specific qRT-PCR of the frequency of ELAVL1 mRNAs containing the long 3=UTR relative to the total amount using the amplicons shown in panel F and normalized to the B-cell average.
on November 7, 2019 by guest
http://jvi.asm.org/
[image:5.585.125.459.65.401.2]from SRSF7 was favored upon EBV infection of primary B cells, but the level of the intron 3-retained isoform was already low in
BL41 cells and unchanged in BL41/B95-8 cells (Fig. 3C). Latent
infection was verified by LMP1 expression in LCLs and BL41/ B95-8 cells, but not in uninfected cells, while little lytic BMRF1 transcript was detected compared to the amount detected in lytic
B95-8 cells (Fig. 3DandE). Therefore, EBV-driven B-cell
prolif-eration rather than latent infectionper seled to the loss of an
SRSF7 mRNA isoform retaining intron 3 in LCLs.
Another RNA binding protein, ELAVL1, which has a role in
mRNA stability (reviewed in reference37), was also changed at the
mRNA isoform level upon EBV infection of resting B cells. Spe-cifically, in LCLs the ELAVL1 mRNA was predicted to have a
shortened 3=UTR relative to the length of the 3=UTR in the
isoform in resting B cells (Fig. 3F). RT-PCR experiments
con-firmed this predicted change, as the total ELAVL1 mRNA level increased from B cells to LCLs, while the level of ELAVL1 with the
long 3=UTR did not increase (Fig. 3G). These experiments were
corroborated by quantitative RT-PCR specific for the long
iso-form (Fig. 3H). These data suggest that the ELAVL1 mRNA
iso-form containing the long 3=UTR represents a significantly smaller
proportion of the total ELAVL1 mRNA species in LCLs than in resting B cells.
Similar to what was observed in the case of SRSF7, EBV infec-tionper sedid not affect the change in the ELAVL1 mRNA iso-form. BL41 cells and EBV-infected BL41/B95-8 cells displayed
similar levels of the ELAVL1 mRNA species with a long 3=UTR
(Fig. 3GandH). This level, however, was already quite low as a percentage of the total relative to that observed in resting B cells, suggesting that B-cell proliferation was likely responsible for the change. This observation is consistent with the previously
recog-nized widespread 3=UTR shortening observed in proliferating
cells and tissues (20).
EBV latency alters XBP1 mRNA isoform usage and sup-presses IRE1-dependent XBP1 splicing, thereby preventing Z
activation.In addition to proliferation-associated changes that
may be important for EBV latency, we were interested in identi-fying EBV-specific changes in mRNA isoform usage. We therefore investigated genes that are known to be associated with the EBV-specific process of reactivation from latency. A number of stimuli,
including treatment with anti-immunoglobulins (38), histone
deacetylase inhibitors (HDACi) (39), and phorbol esters (40),
have been shown to induce reactivation in EBV-infected cell lines. Each of these stimuli ultimately induces activation of
transcrip-tion of the major EBV lytictrans-activator BZLF1, or simply Z,
which is capable of upregulating its own transcription and begin-ning the cascade of lytic transcriptional events that ultimately
leads to the production of infectious virions (41,42). During
la-tency, Z expression is tightly repressed by both host transcription
factors (43–46) and chromatin structure (17,47–49).
XBP1 and TCF4 were two of the transcription factors regulated by EBV at the level of mRNA isoform change (see Data Set S2 in the supplemental material). Both of these proteins have been
im-plicated in regulation of Z expression (14,15,27,50). SplicerEX
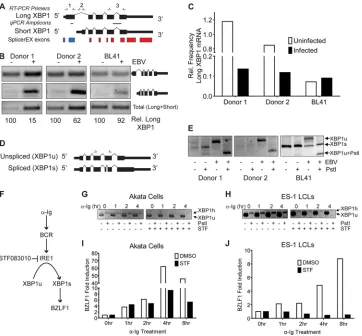
predicted an alternative 5=initiation of the plasma cell
differenti-ation factor XBP1, yielding a shorter mRNA (Fig. 4A). We
con-firmed that EBV infection of primary B cells increased the levels of the short XBP1 mRNA isoform, thereby substantially decreasing
the frequency of long XBP1 (Fig. 4B). EBV latent infection of BL41
cells modestly increased short XBP1 mRNA levels but did not
substantially decrease the frequency of long XBP1 (Fig. 4B). We
corroborated these findings by qRT-PCR, where the B-cell-to-LCL transition led to a strong reduction in the frequency of long
XBP1 relative to the total amount of XBP1 (Fig. 4C). BL41 cells
already contained a reduced frequency of long XBP1 mRNA rela-tive to the total amount, and this was unaffected by EBV infection. As suggested above for the cases of the SRSF7 and ELAVL1 tran-scripts, B-cell proliferation is likely responsible for this isoform change in XBP1.
While the HuEx array identified changes in the 5=end of the
mRNA, another splicing event that regulates XBP1 function is the noncanonical processing of XBP1 mRNA in the cytoplasm by the endonuclease IRE1 downstream of endoplasmic reticulum
(ER) stress (51). IRE1-dependent splicing of the inactive XBP1u
mRNA to the active XBP1s mRNA in response to ER stress is due to an endonucleolytic cleavage event that removes 26 nucleotides from the coding sequence and generates a frame-shifted protein
product (51) (Fig. 4D). The exon in which this event takes place
was not queried by the microarrays, but given the importance of this gene in EBV biology, we sought to assess the status of this IRE1-dependent splicing event in XBP1, as this event ultimately controls its activity as a transcription factor. We therefore assayed the extent of IRE1-dependent splicing in resting B cells and LCLs by RT-PCR at the IRE1-spliced site. XBP1u contains a PstI restric-tion site, and this restricrestric-tion site is lost in XBP1s, making it resis-tant to PstI digestion. We were therefore able to assess the pres-ence of XBP1u and XBP1s by susceptibility to PstI digestion. We found that EBV infection strongly increased overall XBP1u levels but potently suppressed XBP1s, consistent with inhibition of lytic
gene expression in the tightly latent LCL system (Fig. 4E).
Simi-larly, latent EBV infection of BL41 cells reduced the spontaneous splicing of XBP1u to XBP1s.
In order to discern the functional significance of IRE1-depen-dent splicing of XBP1 in lytic reactivation, we took advantage of a new small-molecular inhibitor of the IRE1 endonuclease,
STF083010 (STF) (52). Cross-linking of the B-cell receptor (BCR)
with anti-Ig antibody has been shown to induce IRE1-dependent
cleavage of XBP1u transcripts to generate XBP1s (27), which
ac-tivates the Z promoter (14,15). We hypothesized that inhibition
of IRE1-dependent splicing of XBP1u would suppress
Z-pro-moter activation (Fig. 4F). We first demonstrated that STF is
ca-pable of inhibiting IRE1 endonuclease activity by preventing
XBP1s formation after anti-Ig cross-linking in Akata BL cells (Fig.
4G). In addition, we queried the role of XBP1 splicing in
LMP2A-deficient LCLs (ES-1), which are primed to trigger Z expression in response to anti-Ig due to loss of B-cell receptor antagonism by
LMP2A (53) (Fig. 4H). Importantly, IRE1 inhibition markedly
suppressed anti-Ig-induced Z activation in both Akata cells (Fig.
4I) and ES-1 LCLs (Fig. 4J). These data indicate that strong
sup-pression of the IRE1-dependent splicing of XBP1 in LCLs likely prevents the aberrant activation of the promoter of the key lytic
trans-activator Z, thereby maintaining latency in immortalized B cells. Interestingly, the strong increase in XBP1u levels also sug-gests that these latently infected cells are primed to transition to the lytic cycle upon sensing IRE1-activating stimuli.
EBV latent infection inhibits expression of the full-length
mRNA for TCF4 to suppress Z expression. We identified an
mRNA isoform change of the TCF4 gene product upon EBV in-fection of primary B cells (see Data Set S2 in the supplemental material). TCF4, also known as E2-2, is an E-box binding protein
on November 7, 2019 by guest
http://jvi.asm.org/
that plays a major role in B-cell development and has previously
been shown to bind elements in the EBV lytic Z promoter (50). We
were therefore interested in characterizing this isoform change
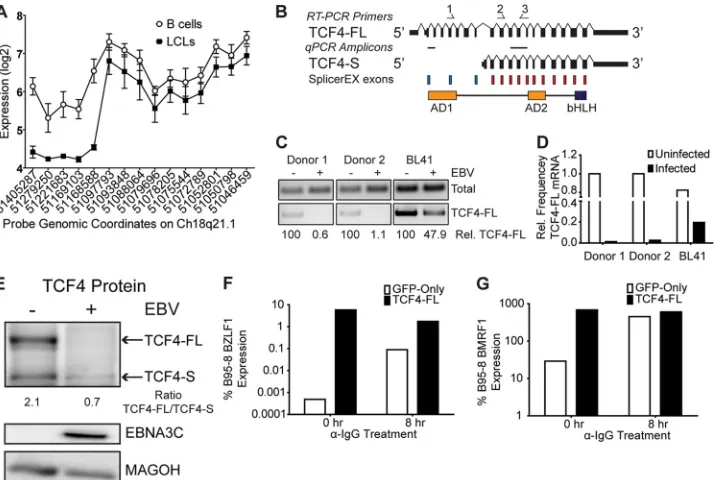
and its significance. As shown inFig. 5A, we detected similar
ex-pression of TCF4 across all exons in resting B cells. However, in LCLs, the expression of the first five meta-probe sets detecting the
5=end of the mRNA was significantly lower than that in B cells
(Fig. 5A). These data suggest that the TCF4 gene is transcribed
from an alternative 5=initiation site, which would give rise to a
protein product lacking the first transcriptional activation do-main, AD1, but retaining AD2 and the basic helix-loop helix
dimerization and DNA binding domain (Fig. 5B). To confirm this
hypothesis, we used exon-specific RT-PCR primers and observed downregulation of the full-length TCF4 isoform (TCF4-FL) in EBV-infected LCLs relative to its regulation in EBV-negative B
cells (Fig. 5C). These data were corroborated by a quantitative
RT-PCR specific for TCF4-FL mRNA relative to total TCF4,
where LCLs contained much less TCF4-FL (Fig. 5D). We also
assessed the relative levels of TCF4-FL in BL41 cells that were either uninfected or latently infected with EBV. In this setting, TCF4 also displayed a preference for lower expression of the
full-length isoform in the infected cells (Fig. 5CandD). Finally,
West-ern analysis of the TCF4 protein product indicated a reduction of the full-length isoform expressed in EBV-negative BL41 cells rel-ative to that in the latently infected BL41/B95-8 cells, where the
full-length protein was essentially undetectable (Fig. 5E).
TCF4 has previously been shown to bind E boxes present in the
Z promoter (50), and EBV preferentially downregulates the
TCF4-FL isoform, which contains both transactivation domains. Therefore, we hypothesized that TCF4-FL would be capable of inducing transcription at the endogenous Z promoter. Indeed, transfection of TCF4-FL into EBV-positive Akata BL cells was
FIG 4XBP1 alternative isoform usage and lytic reactivation. (A) Exon schematics of the XBP1 gene. Red blocks, SplicerEX UP probe sets; blue blocks, DOWN probe sets; arrows above the schematics, the primers used in RT-PCRs; horizontal hashes between the isoform schematics, amplicons generated in qRT-PCRs. (B) Gels of RT-PCR specifically targeting the long (top; primer set 1) and short (middle; primer set 2) XBP1 isoforms as well as a downstream region common to both isoforms (bottom; primer set 3) from two donor-matched B-cell and LCL pairs and BL41 versus BL41/B95-8 cells using the primers shown in panel A. The quantification below the gel represents the frequency of the long XBP1 isoform relative to the total amount of XBP1 mRNA present. (C) Isoform-specific qRT-PCR depicting the frequency of long XBP1 relative to the total amount of XBP1 using the amplicons shown in panel A. (D) Exon schematics depicting the IRE1-dependent alternative splicing of XBP1. Arrows above the schematics, the primers used in RT-PCRs. (E) Gel of RT-PCR querying IRE1-mediated splicing. XBP1u contains a PstI restriction site, and this site is lost in XBP1s. Digestion of the PCR product with PstI results in selective cleavage of the XBP1u product. (F) Schematic of Ig antibody-induced transcriptional activation of Z via IRE1-dependent splicing of XBP1. (G) Gel of RT-PCR of Akata cells treated with 5g/ml anti-IgG antibody for the indicated times in the presence or absence of the IRE1 inhibitor STF. Arrows, XBP1u, the unspliced transcript, and XBP1h, the hybrid product. (H) Gel of RT-PCR of ES-1 cells treated with anti-Ig antibody in the presence or absence of STF, as described for panel G. (I) qRT-PCR of the induction of endogenous Z by Ig antibody and inhibition by STF in EBV-positive Akata cells. DMSO, dimethyl sulfoxide. (J) qRT-PCR of the induction of endogenous Z by anti-Ig antibody and inhibition by STF in ES-1 LCLs.
on November 7, 2019 by guest
http://jvi.asm.org/
[image:7.585.113.475.65.401.2]sufficient to induce endogenous Z mRNA at levels comparable to
those induced by cross-linking the B-cell receptor (Fig. 5F).
Fur-thermore, TCF4-FL expression also induced expression of a downstream Z target, the EBV polymerase processivity factor
BMRF1, to the levels observed upon B-cell cross-linking (Fig. 5G).
These results support the hypothesis that EBV latent infection suppresses TCF4-FL expression to prevent the spontaneous in-duction of Z expression and downstream targeting of lytic genes.
DISCUSSION
In this study, we aimed to understand how virus infection alters the cellular mRNA landscape of the infected cell. We studied changes in both mRNA abundance and isoform usage altered by Epstein-Barr virus infection of primary human B cells using SplicerEX, a novel algorithm to analyze human exon and conven-tional microarray data. We identified 433 mRNAs changing at the level of isoform usage and 2,163 host mRNAs changing in overall abundance after EBV infection. These two sets of mRNAs were largely orthogonal, where less than one-third of those regulated by isoform usage were also changed at the level of abundance. This result suggests that mRNAs regulated at the level of the isoform may have functions distinct from those regulated by abundance, consistent with the findings of other global transcriptomic studies
(33). Indeed, mRNAs changing at the level of the isoform were
enriched for nucleic acid binding proteins, including splicing fac-tors and transcription facfac-tors, while these protein classes were
depleted among the mRNAs regulated at the level of abundance. We validated several of the mRNA isoform changes and found that EBV altered the isoform-level expression of two transcription factors, XBP1 and TCF4, which prevented accumulation of active forms capable of inducing lytic EBV reactivation. Therefore, EBV latent infection is maintained, in part, through the regulation of specific cellular mRNA isoforms.
The SplicerEX algorithm generates hypotheses regarding the mechanism and directionality of mRNA isoform changes. While analysis of combined data from both the HuEx and U133 array platforms failed to identify any preferential mechanistic class of isoform change driven by EBV infection, EBV infection and pro-liferation of primary resting B cells promoted a strong preference
for shortening rather than lengthening of the 3=UTRs of
tran-scripts. This result is consistent with the findings of other studies indicating that proliferation correlates with expression of mRNAs
containing shorter 3=UTRs (20,34). The mRNAs with shortened
3=UTRs are often translated more efficiently due to the loss of
negative regulatory elements, such as miRNA binding sites (20,
34). In addition to shorter 3=UTRs, we also observed a preference
toward exclusion rather than inclusion of internal cassette exons during EBV transformation. While most of what is known about miRNA-mediated mRNA repression comes from studies of the
regulatory effects of miRNA binding sites within 3= UTRs,
miRNAs also bind to and may regulate translation through sites
located in the coding sequence of mRNAs (54). Therefore, the 3=
FIG 5TCF4 alternative isoform usage and lytic reactivation. (A) Plot of expression levels of TCF4 meta-probe sets in the 5=¡3=direction from left to right in B cells and LCLs. (B) Exon schematics of the TCF4 gene. Red blocks, SplicerEX UP probe sets; blue blocks, DOWN probe sets, single-headed arrows above the schematics, the primers used in RT-PCRs; horizontal hashes between isoform schematics, amplicons generated in qRT-PCRs. Below the isoform schematics is a representation of the TCF4 protein organization. bHLH, basic helix-loop-helix. (C) Gel of isoform-specific RT-PCR of two donor-matched B-cell and LCL pairs and BL41 versus BL41/B95-8 cells using the primers depicted in panel B. Upper band (primers 2 and 3), total amount of the TCF4 transcript in the cells; lower band (primers 1 and 3), amount of TCF4-FL specifically. (D) Isoform-specific qRT-PCR depicting the frequency of TCF4-FL relative to the B-cell average using the amplicons shown in panel B. (E) Western blot of TCF4-FL in BL41 and BL41/B95-8 cells. Densitometry was performed, and the ratio of TCF4-FL/TCF4-S detected is shown. The results for EBNA3C as a control for EBV latent infection are shown. The results for MAGOH as a loading control are shown. (F) Endogenous BZLF1 expression in Akata cells in response to anti-IgG antibody treatment and/or TCF4-FL overexpression. GFP-only, samples transfected with GFP only; TCF4-FL, samples were cotransfected with GFP and a plasmid expressing TCF4-FL. Values are relative to the Z mRNA levels in B95-8 cells. (G) BMRF1 expression in Akata cells in response to anti-IgG antibody treatment and/or TCF4-FL overexpression. Values are relative to the BMRF1 levels in B95-8 cells.
on November 7, 2019 by guest
http://jvi.asm.org/
[image:8.585.115.472.66.306.2]UTR-shortened and cassette exon-excluded transcripts regulated by EBV likely derive from changes induced by EBV-mediated B-cell proliferation and may consequently alter the infected B-cell pro-teome through changes in mRNA regulatory elements. Examples of transcripts with these proliferation-associated mRNA isoform changes include ELAVL1 and SRSF7, which may play an impor-tant role in B-cell transformation through promoting translation and alternative splicing of viral and cellular mRNAs. In addition to proliferation-associated changes, we hypothesized that other mRNAs may be regulated by EBV latent infection even in the background of a proliferating cell. Such changes were illuminated in the characterization of gene ontology groups enriched in the set of EBV-regulated mRNA isoform changes.
Strong enrichment of nucleic acid binding proteins, including splicing factors and transcription factors, was detected within the set of mRNAs regulated by EBV at the level of isoform usage. Interestingly, genes in these protein classes were depleted in the set of mRNAs regulated by overall abundance, suggesting distinct modes of regulating gene expression. It is not uncommon for RBPs and splicing factors to be regulated themselves by alternative
splicing (55,56). In fact, a recent study identified enrichment in
splicing factors among mRNAs changing at the isoform level in Kaposi’s sarcoma-associated herpesvirus-infected versus
unin-fected endothelial cells (23). In our study, we identified 24 RNA
binding proteins to be regulated at the isoform level in EBV-in-fected cells, with 12 of these being splicing factors, including SF1, SRSF7, SRSF15, CUGBP2, MBNL1, MBNL2, and RAVER1. We would propose that these factors may be important in EBV-regu-lated processing and the stability of viral latent mRNAs as well as cellular mRNAs during infection.
Another important category of mRNAs regulated by EBV at the isoform level is the group of transcripts encoding DNA bind-ing proteins. Previous reports have identified IRF5 to be a gene whose mRNA transcripts undergo alternative isoform changes as
a result of latent EBV infection (57). While our arrays did not
differentially detect those specific IRF5 isoforms, we did identify several transcription factors that were regulated at the isoform level, including STAT5B, MEF2B, EGR1, XBP1, and TCF4. The last two proteins have been shown to bind to the promoter of the
key EBV lytic switch gene, Z (15,50). Interestingly, EBV latent
infection suppressed isoforms of XBP1 and TCF4 capable of acti-vating the Z promoter.
XBP1 is a basic leucine zipper protein and plasma cell dif-ferentiation factor that responds to the unfolded protein re-sponse (UPR) pathway and ER stress. IRE1 is embedded in the ER membrane, and upon ER stress, IRE1 endonucleolytically cleaves XBP1u transcripts, leading to the generation of an mRNA, termed XBP1s, that encodes the active XBP1
transcrip-tion factor (51). XBP1s has been shown to activate
transcrip-tion at the Z promoter (14, 15, 27), and recently, EBV lytic
reactivation has been shown to be activated by ER stress,
sug-gesting a role for XBP1s in this process (58).
SplicerEX detected an alternative 5=initiation of XBP1 mRNA
in LCLs relative to resting B cells, and we additionally queried the IRE1-dependent splicing of XBP1 in LCLs. While XBP1u was dra-matically upregulated, the levels of XBP1s were suppressed, sug-gesting inhibition of IRE1-mediated splicing during latent infec-tion. Importantly, we demonstrated that inhibition of IRE1 endonuclease activity prevented XBP1 splicing and Z induction downstream of B-cell receptor activation. It remains unclear
whether the alternative 5=initiation of XBP1 directly contributes
to the high XBP1u/XBP1s ratio in LCLs. It has been suggested that alternative splicing may in some cases be dependent on promoter
usage (59). In the case of XBP1, the alternative 5=initiation could
potentially alter the secondary structure of the mRNA in such a way as to suppress the ability of IRE1 to bind and/or cleave the XBP1u transcript. Alternatively, EBV latent infection may broadly antagonize the IRE1-mediated splicing pathway, perhaps through
EBNA3C (60), resulting in suppression of XBP1s and, therefore,
suppression of Z transcription and lytic reactivation.
A complementary EBV-regulated isoform change is in an mRNA encoding the E-box binding protein TCF4 (also known as E2-2). EBV latent infection suppressed the expression of full-length TCF4 (TCF4-FL), while it retained expression of a shorter isoform (TCF4-S). TCF4-FL contains a basic helix-loop-helix DNA binding and dimerization domain along with two activation domains (AD1 and AD2), while TCF4-S lacks AD1. TCF4 shares high amino acid sequence homology in its AD1 with AD1 from TCF3 (also called E2A), particularly in a conserved motif that
recruits the transcriptional coactivators CBP and p300 (61,62).
We would therefore expect that TCF4-FL, which contains AD1 and is downregulated in LCLs, promotes transcription at the Z promoter through recruitment of CBP and p300. The absence of AD1 in TCF4-S is likely to reduce its ability to activate
transcrip-tion at target promoters (63), including Z, thereby preventing lytic
reactivation. Furthermore, TCF4-S retains DNA binding activity and may potentially bind to the E boxes (HI sites) in the Z
pro-moter (50) and act as a dominant negative inhibitor of Z
tran-scription by blocking the activity of residual TCF4-FL in LCLs. The data presented here demonstrate an important role for mRNA isoform regulation in the maintenance of EBV latency. We have shown that SplicerEX is capable of predicting isoform changes that are functionally relevant to EBV infection of primary B cells, specifically, in the regulation of lytic reactivation. We an-ticipate that in the future, analysis of the RNA binding proteins that are regulated by EBV may provide clues into how viral tran-scripts are spliced and processed during latency as well as how global isoform changes in cellular mRNAs may be regulated. Our studies provide a new angle in understanding virus-host interac-tions with regard to mRNA processing. This important area of study is now significantly more tractable with new technologies and computational approaches, and our study has provided us with a solid foundation for the detailed analysis of mRNA isoform regulation in EBV transformation.
ACKNOWLEDGMENTS
We acknowledge Meron Ghidey, Yi-Fan Lu, and Cristina Salinas for their contributions to the manuscript, Mike Cook and Lynn Martinek from the Duke Flow Cytometry Shared Resource, and Yuan Zhuang for helpful discussion. We also thank other members of the M. A. Luftig laboratory for helpful discussions.
We thank the Duke Center for AIDS Research (5P30-AI064518) and the NIH/NCI (R01-CA140337) for funding. N.J.H. was supported by 5T32-CA009111.
REFERENCES
1.Kieff E, Rickinson A. 2007. Epstein-Barr virus and its replication, p 2603–2654.InKnipe DM, Howley PM, Griffin DE, Lamb RA, Martin MA, Roizman B, Straus SE (ed), Fields virology, 5th ed, vol 2. Lippincott Wil-liams & Wilkins, Philadelphia, PA.
2.Faumont N, Durand-Panteix S, Schlee M, Gromminger S,
on November 7, 2019 by guest
http://jvi.asm.org/
acher M, Holzel M, Laux G, Mailhammer R, Rosenwald A, Staudt LM, Bornkamm GW, Feuillard J.2009. c-Myc and Rel/NF-kappaB are the two master transcriptional systems activated in the latency III program of Ep-stein-Barr virus-immortalized B cells. J. Virol.83:5014 –5027.
3.Price AM, Tourigny JP, Forte E, Salinas RE, Dave SS, Luftig MA.2012. Analysis of Epstein-Barr virus-regulated host gene expression changes through primary B-cell outgrowth reveals delayed kinetics of latent mem-brane protein 1-mediated NF-kappaB activation. J. Virol.86:11096 – 11106.
4.Sinclair AJ, Palmero I, Peters G, Farrell PJ.1994. EBNA-2 and EBNA-LP cooperate to cause G0to G1transition during immortalization of resting human B lymphocytes by Epstein-Barr virus. EMBO J.13:3321–3328. 5.Wang F, Gregory CD, Rowe M, Rickinson AB, Wang D, Birkenbach M,
Kikutani H, Kishimoto T, Kieff E. 1987. Epstein-Barr virus nuclear antigen 2 specifically induces expression of the B-cell activation antigen CD23. Proc. Natl. Acad. Sci. U. S. A.84:3452–3456.
6.Cahir-McFarland ED, Carter K, Rosenwald A, Giltnane JM, Henrickson SE, Staudt LM, Kieff E.2004. Role of NF-kappa B in cell survival and transcription of latent membrane protein 1-expressing or Epstein-Barr virus latency III-infected cells. J. Virol.78:4108 – 4119.
7.Maruo S, Zhao B, Johannsen E, Kieff E, Zou J, Takada K. 2011. Epstein-Barr virus nuclear antigens 3C and 3A maintain lymphoblastoid cell growth by repressing p16INK4A and p14ARF expression. Proc. Natl. Acad. Sci. U. S. A.108:1919 –1924.
8.Skalska L, White RE, Franz M, Ruhmann M, Allday MJ.2010. Epige-netic repression of p16(INK4A) by latent Epstein-Barr virus requires the interaction of EBNA3A and EBNA3C with CtBP. PLoS Pathog.
6:e1000951. doi:10.1371/journal.ppat.1000951.
9.Marshall D, Sample C.1995. Epstein-Barr virus nuclear antigen 3C is a transcriptional regulator. J. Virol.69:3624 –3630.
10. Radkov SA, Bain M, Farrell PJ, West M, Rowe M, Allday MJ.1997. Epstein-Barr virus EBNA3C represses Cp, the major promoter for EBNA expression, but has no effect on the promoter of the cell gene CD21. J. Virol.71:8552– 8562.
11. Robertson ES, Grossman S, Johannsen E, Miller C, Lin J, Tomkinson B, Kieff E.1995. Epstein-Barr virus nuclear protein 3C modulates transcrip-tion through interactranscrip-tion with the sequence-specific DNA-binding protein J kappa. J. Virol.69:3108 –3116.
12. Waltzer L, Perricaudet M, Sergeant A, Manet E.1996. Epstein-Barr virus EBNA3A and EBNA3C proteins both repress RBP-J kappa- EBNA2-activated transcription by inhibiting the binding of RBP-J kappa to DNA. J. Virol.70:5909 –5915.
13. Altmann M, Pich D, Ruiss R, Wang J, Sugden B, Hammerschmidt W.
2006. Transcriptional activation by EBV nuclear antigen 1 is essential for the expression of EBV’s transforming genes. Proc. Natl. Acad. Sci. U. S. A.
103:14188 –14193.
14. Bhende PM, Dickerson SJ, Sun X, Feng WH, Kenney SC.2007. X-box-binding protein 1 activates lytic Epstein-Barr virus gene expression in combination with protein kinase D. J. Virol.81:7363–7370.
15. Sun CC, Thorley-Lawson DA.2007. Plasma cell-specific transcription factor XBP-1s binds to and transactivates the Epstein-Barr virus BZLF1 promoter. J. Virol.81:13566 –13577.
16. Hagemeier SR, Barlow EA, Meng Q, Kenney SC.2012. The cellular ataxia telangiectasia-mutated kinase promotes Epstein-Barr virus lytic re-activation in response to multiple different types of lytic rere-activation- reactivation-inducing stimuli. J. Virol.86:13360 –13370.
17. Jenkins PJ, Binne UK, Farrell PJ.2000. Histone acetylation and reacti-vation of Epstein-Barr virus from latency. J. Virol.74:710 –720. 18. Miller G, El-Guindy A, Countryman J, Ye J, Gradoville L.2007. Lytic
cycle switches of oncogenic human gammaherpesviruses. Adv. Cancer Res.97:81–109.
19. Keene JD.2007. RNA regulons: coordination of post-transcriptional events. Nat. Rev. Genet.8:533–543.
20. Sandberg R, Neilson JR, Sarma A, Sharp PA, Burge CB.2008. Prolif-erating cells express mRNAs with shortened 3=untranslated regions and fewer microRNA target sites. Science320:1643–1647.
21. Wang ET, Sandberg R, Luo S, Khrebtukova I, Zhang L, Mayr C, Kingsmore SF, Schroth GP, Burge CB.2008. Alternative isoform regu-lation in human tissue transcriptomes. Nature456:470 – 476.
22. Faustino NA, Cooper TA.2003. Pre-mRNA splicing and human disease. Genes Dev.17:419 – 437.
23. Chang TY, Wu YH, Cheng CC, Wang HW.2011. Differentially regu-lated splice variants and systems biology analysis of Kaposi’s
sarcoma-associated herpesvirus-infected lymphatic endothelial cells. Nucleic Acids Res.39:6970 – 6985.
24. Venables JP.2006. Unbalanced alternative splicing and its significance in cancer. Bioessays28:378 –386.
25. Misquitta-Ali CM, Cheng E, O’Hanlon D, Liu N, McGlade CJ, Tsao MS, Blencowe BJ.2011. Global profiling and molecular characterization of alternative splicing events misregulated in lung cancer. Mol. Cell. Biol.
31:138 –150.
26. Robinson TJ, Forte E, Salinas RE, Puri S, Marengo M, Garcia-Blanco MA, Luftig MA.2012. SplicerEX: a tool for the automated detection and classification of mRNA changes from conventional and splice-sensitive microarray expression data. RNA18:1435–1445.
27. McDonald C, Karstegl CE, Kellam P, Farrell PJ.2010. Regulation of the Epstein-Barr virus Zp promoter in B lymphocytes during reactivation from latency. J. Gen. Virol.91:622– 629.
28. Shirley CM, Chen J, Shamay M, Li H, Zahnow CA, Hayward SD, Ambinder RF.2011. Bortezomib induction of C/EBPbeta mediates Ep-stein-Barr virus lytic activation in Burkitt lymphoma. Blood117:6297– 6303.
29. Thomas PD, Campbell MJ, Kejariwal A, Mi H, Karlak B, Daverman R, Diemer K, Muruganujan A, Narechania A.2003. PANTHER: a library of protein families and subfamilies indexed by function. Genome Res.13:
2129 –2141.
30. Keller SA, Schattner EJ, Cesarman E.2000. Inhibition of NF-kappaB induces apoptosis of KSHV-infected primary effusion lymphoma cells. Blood96:2537–2542.
31. Bemmo A, Benovoy D, Kwan T, Gaffney DJ, Jensen RV, Majewski J.
2008. Gene expression and isoform variation analysis using Affymetrix exon arrays. BMC Genomics9:529. doi:10.1186/1471-2164-9-529. 32. Robinson TJ, Dinan MA, Dewhirst M, Garcia-Blanco MA, Pearson JL.
2010. SplicerAV: a tool for mining microarray expression data for changes in RNA processing. BMC Bioinformatics11:108. doi:10.1186/1471-2105 -11-108.
33. Shapiro IM, Cheng AW, Flytzanis NC, Balsamo M, Condeelis JS, Oktay MH, Burge CB, Gertler FB.2011. An EMT-driven alternative splicing program occurs in human breast cancer and modulates cellular pheno-type. PLoS Genet.7:e1002218. doi:10.1371/journal.pgen.1002218. 34. Mayr C, Bartel DP.2009. Widespread shortening of 3=UTRs by
alterna-tive cleavage and polyadenylation activates oncogenes in cancer cells. Cell
138:673– 684.
35. Popielarz M, Cavaloc Y, Mattei MG, Gattoni R, Stevenin J.1995. The gene encoding human splicing factor 9G8. Structure, chromosomal local-ization, and expression of alternatively processed transcripts. J. Biol. Chem.270:17830 –17835.
36. Lejeune F, Cavaloc Y, Stevenin J.2001. Alternative splicing of intron 3 of the serine/arginine-rich protein 9G8 gene. Identification of flanking ex-onic splicing enhancers and involvement of 9G8 as a trans-acting factor. J. Biol. Chem.276:7850 –7858.
37. Brennan CM, Steitz JA.2001. HuR and mRNA stability. Cell. Mol. Life Sci.58:266 –277.
38. Takada K.1984. Cross-linking of cell surface immunoglobulins induces Epstein-Barr virus in Burkitt lymphoma lines. Int. J. Cancer33:27–32. 39. Luka J, Kallin B, Klein G.1979. Induction of the Epstein-Barr virus
(EBV) cycle in latently infected cells by n-butyrate. Virology94:228 – 231.
40. Flemington E, Speck SH.1990. Identification of phorbol ester response elements in the promoter of Epstein-Barr virus putative lytic switch gene BZLF1. J. Virol.64:1217–1226.
41. Flemington E, Speck SH. 1990. Autoregulation of Epstein-Barr virus putative lytic switch gene BZLF1. J. Virol.64:1227–1232.
42. Garcia-Blanco MA, Cullen BR.1991. Molecular basis of latency in patho-genic human viruses. Science254:815– 820.
43. Schwarzmann F, Prang N, Reichelt B, Rinkes B, Haist S, Marschall M, Wolf H.1994. Negatively cis-acting elements in the distal part of the promoter of Epstein-Barr virus trans-activator gene BZLF1. J. Gen. Virol.
75:1999 –2006.
44. Liu P, Liu S, Speck SH.1998. Identification of a negative ciselement within the ZII domain of the Epstein-Barr virus lytic switch BZLF1 gene promoter. J. Virol.72:8230 – 8239.
45. Ellis AL, Wang Z, Yu X, Mertz JE.2010. Either ZEB1 or ZEB2/SIP1 can play a central role in regulating the Epstein-Barr virus latent-lytic switch in a cell-type-specific manner. J. Virol.84:6139 – 6152.
46. Yu X, McCarthy PJ, Lim HJ, Iempridee T, Kraus RJ, Gorlen DA, Mertz
on November 7, 2019 by guest
http://jvi.asm.org/
JE.2011. The ZIIR element of the Epstein-Barr virus BZLF1 promoter plays a central role in establishment and maintenance of viral latency. J. Virol.85:5081–5090.
47. Daigle D, Gradoville L, Tuck D, Schulz V, Wang’ondu R, Ye J, Gorres K, Miller G.2011. Valproic acid antagonizes the capacity of other histone deacetylase inhibitors to activate the Epstein-Barr virus lytic cycle. J. Virol.
85:5628 –5643.
48. Murata T, Kondo Y, Sugimoto A, Kawashima D, Saito S, Isomura H, Kanda T, Tsurumi T.2012. Epigenetic histone modification of Epstein-Barr virus BZLF1 promoter during latency and reactivation in Raji cells. J. Virol.86:4752– 4761.
49. Ramasubramanyan S, Osborn K, Flower K, Sinclair AJ.2012. Dynamic chromatin environment of key lytic cycle regulatory regions of the Ep-stein-Barr virus genome. J. Virol.86:1809 –1819.
50. Thomas C, Dankesreiter A, Wolf H, Schwarzmann F.2003. The BZLF1 promoter of Epstein-Barr virus is controlled by E box-/HI-motif-binding factors during virus latency. J. Gen. Virol.84:959 –964.
51. Yoshida H, Matsui T, Yamamoto A, Okada T, Mori K. 2001. XBP1 mRNA is induced by ATF6 and spliced by IRE1 in response to ER stress to produce a highly active transcription factor. Cell107:881– 891. 52. Papandreou I, Denko NC, Olson M, Van Melckebeke H, Lust S, Tam
A, Solow-Cordero DE, Bouley DM, Offner F, Niwa M, Koong AC.
2011. Identification of an Ire1alpha endonuclease specific inhibitor with cytotoxic activity against human multiple myeloma. Blood117:
1311–1314.
53. Miller CL, Lee JH, Kieff E, Longnecker R.1994. An integral membrane protein (LMP2) blocks reactivation of Epstein-Barr virus from latency following surface immunoglobulin crosslinking. Proc. Natl. Acad. Sci. U. S. A.91:772–776.
54. Hausser J, Syed AP, Bilen B, Zavolan M.2013. Analysis of CDS-located miRNA target sites suggests that they can effectively inhibit translation. Genome Res.23:604 – 615.
55. Wollerton MC, Gooding C, Wagner EJ, Garcia-Blanco MA, Smith CW.2004. Autoregulation of polypyrimidine tract binding protein by
alternative splicing leading to nonsense-mediated decay. Mol. Cell13:
91–100.
56. Dembowski JA, Grabowski PJ.2009. The CUGBP2 splicing factor regu-lates an ensemble of branchpoints from perimeter binding sites with implications for autoregulation. PLoS Genet. 5:e1000595. doi:10.1371 /journal.pgen.1000595.
57. Martin HJ, Lee JM, Walls D, Hayward SD.2007. Manipulation of the Toll-like receptor 7 signaling pathway by Epstein-Barr virus. J. Virol.81:
9748 –9758.
58. Taylor GM, Raghuwanshi SK, Rowe DT, Wadowsky RM, Rosendorff A.
2011. Endoplasmic reticulum stress causes EBV lytic replication. Blood
118:5528 –5539.
59. Mancl ME, Hu G, Sangster-Guity N, Olshalsky SL, Hoops K, Fitzger-ald-Bocarsly P, Pitha PM, Pinder K, Barnes BJ.2005. Two discrete promoters regulate the alternatively spliced human interferon regula-tory factor-5 isoforms. Multiple isoforms with distinct cell type-specific expression, localization, regulation, and function. J. Biol. Chem.280:21078 –21090.
60. Garrido JL, Maruo S, Takada K, Rosendorff A.2009. EBNA3C interacts with Gadd34 and counteracts the unfolded protein response. Virol. J.
6:231.
61. Hyndman BD, Thompson P, Bayly R, Cote GP, LeBrun DP.2012. E2A proteins enhance the histone acetyltransferase activity of the transcrip-tional co-activators CBP and p300. Biochim. Biophys. Acta1819:446 – 453.
62. Hyndman BD, Thompson P, Denis CM, Chitayat S, Bayly R, Smith SP, LeBrun DP.2012. Mapping acetylation sites in E2A identifies a conserved lysine residue in activation domain 1 that promotes CBP/p300 recruitment and transcriptional activation. Biochim. Biophys. Acta1819:375–381. 63. Sepp M, Kannike K, Eesmaa A, Urb M, Timmusk T.2011. Functional
diversity of human basic helix-loop-helix transcription factor TCF4 iso-forms generated by alternative 5’ exon usage and splicing. PLoS One
6:e22138. doi:10.1371/journal.pone.0022138.