FACULTY OF ENGINEERING AND SURVEYING
Industrial Wireless Network Mapping
A dissertation submitted by
Glenn Lumsden
In fulfilment of requirements of
Bachelor of Computer Systems Engineering
Abstract
Wireless network mapping is the process of displaying quality and performance information related to
wireless access points over a relational map. As business systems utilising wireless technologies
demand sufficient coverage and performance of their networks under all conditions, it is important to
continue to study new methods to monitor wireless networks to detect emerging deficiencies to reduce
negative business impacts. The project aims to develop a system that utilises client infrastructure to
capture and forward wireless network quality with global positioning system (GPS) coordinates for
use in open cut mining activities.
Whilst commercial Wi-Fi mapping software exists, some use information from the access points (AP)
to estimate the coverage and other quality factors. Whilst this can be live information it cannot
provide suitable information about the network as seen by clients on the network. Others methods
employ a technique known as war-driving that can map GPS and Wi-Fi data at a client level but only
producing a snap shot in time. This project is developing software allowing clients on a wireless
network to report Wi-Fi and GPS information back to a centrally located server for live analysis and
reporting.
The project employed researching existing techniques and coding for gathering GPS telemetry and
Wi-Fi data including data storage methods. Research provided access to code and methods that have
been tested and critiqued. The system has been conceptualised and alternative programming
languages and database programs compared. A trial system has been designed and tested to retrieve
available Wi-Fi information with GPS telemetry, storing the data in a local database to be installed on
existing computing hardware on mining vehicles. A remote/central database has been developed and
tested in conjunction with the client application to receive the information buffered on the network
University of Southern Queensland
Faculty of Health, Engineering and Sciences
ENG4111/ENG4112 Research Project
Limitations of Use
The Council of the University of Southern Queensland, its Faculty of Health, Engineering & Sciences,
and the staff of the University of Southern Queensland, do not accept any responsibility for the truth,
accuracy or completeness of material contained within or associated with this dissertation.
Persons using all or any part of this material do so at their own risk, and not at the risk of the Council
of the University of Southern Queensland, its Faculty of Health, Engineering & Sciences or the staff
of the University of Southern Queensland.
This dissertation reports an educational exercise and has no purpose or validity beyond this exercise.
The sole purpose of the course pair entitled “Research Project” is to contribute to the overall
education within the student’s chosen degree program. This document, the associated hardware,
software, drawings, and other material set out in the associated appendices should not be used for any
University of Southern Queensland
Faculty of Health, Engineering and Sciences
ENG4111/ENG4112 Research Project
Certification of Dissertation
I certify that the ideas, designs and experimental work, results, analyses and conclusions set
out in this dissertation are entirely my own effort, except where otherwise indicated and
acknowledged.
I further certify that the work is original and has not been previously submitted for
assessment in any other course or institution, except where specifically stated.
Glenn Lumsden
Student Number: 0019322995
Signature of Candidate
28 October 2015
Acknowledgments
The author would like to sincerely thank the following people for their help and support during the
project:-
My wife Jenn and my three children, for their support, patience and understanding during the
completion of the project. I am looking forward to more quality time after so many busy years
studying.
My work and study colleague, Jason Lang, whom assisted me greatly during the project development
and final years of study.
Table of Contents
ABSTRACT
... I
LIMITATIONS OF USE
... II
CERTIfiCATION OF DISSERTATION
... III
ACKNOWLEDGMENTS
...IV
LIST OF FIGURES
... IX
LIST OF TABLES
... X
LIST OF APPENDICES
... XI
NOMENCLATURE AND ACRONYMS
... XII
CHAPTER 1 INTRODUCTION
... 1
1.1 Outline of the Study ... 1
1.2 Introduction ... 1
1.3 Problem Statement ... 2
1.4 Research Aim and Objectives ... 2
1.5 Conclusions ... 3
CHAPTER 2 BACKGROUND
... 4
2.1 Introduction ... 4
2.2 Open Cut Coal Mining ... 4
2.3 Fleet Management System ... 5
2.4 High Precision GPS ... 6
2.5 Meandu Mine ... 7
2.6 Conclusion ... 8
CHAPTER 3 LITERATURE REVIEW
... 9
3.1 Introduction ... 9
3.2 Networking for Mining ... 9
3.4 Wireless Design and Monitoring ... 11
3.4.1 Modelling and Survey ... 11
3.4.2 Sensor Based Monitoring ... 13
3.4.3 Crowdsourcing ... 14
3.5 Global Navigation Satellite System ... 16
3.5.1 Data Protocols ... 17
3.6 Conclusion ... 19
CHAPTER 4 METHODOLOGY
... 20
4.1 Introduction ... 20
4.2 Philosophy... 20
4.3 Requirements Engineering ... 20
4.3.1 Functional Requirements ... 21
4.3.2 Non-functional Requirements ... 21
4.4 System Modelling ... 22
4.4.1 Waterfall Analysis... 22
4.4.2 Incremental Development ... 23
4.4.3 Re-use Oriented Development ... 25
4.5 Software Strategy ... 25
4.5.1 Constraints ... 26
4.5.2 IDE ... 26
4.5.3 Simulation ... 26
4.5.4 Database ... 27
4.5.5 Web Server ... 27
4.5.6 Programming Languages ... 27
4.6 Client Design Overview ... 28
4.7 Software Testing ... 32
4.7.1 GPS Testing ... 32
4.7.2 Wi-Fi Testing ... 32
4.7.3 Database Testing ... 33
4.7.4 Transmission Testing ... 33
4.8 Conclusion ... 33
CHAPTER 5 DETAILED DESIGN
... 34
5.2 Collection User Interface ... 34
5.2.1 Main Menu ... 34
5.2.2 Form Interface ... 36
5.2.3 Systems Health ... 39
5.3 Transmit User Interface ... 41
5.3.1 Main Menu ... 41
5.3.2 Form Interface ... 42
5.3.3 System Health ... 43
5.4 Coding Overview ... 44
5.4.1 Client Overview ... 44
5.4.2 Transmit Overview ... 45
5.5 GPS Interface Coding ... 46
5.6 Wi-Fi Interface Coding ... 46
5.6.1 ManagedWiFi ... 46
5.7 MySQL ... 47
5.8 Graphical User Interface ... 47
5.9 Conclusion ... 47
CHAPTER 6 ANALYSIS AND PERFORMANCE
... 48
6.1 Introduction ... 48
6.2 Analysis Section ... 48
6.2.1 Normal Operation ... 49
6.2.2 Data Buffering ... 50
6.2.3 Performance ... 52
6.3 Conclusion ... 53
CHAPTER 7 CONCLUSION
... 54
7.1 Introduction ... 54
7.2 Achievement of Objectives ... 54
7.3 Further Work ... 55
LIST OF REFERENCES
... 56
BIBLIOGRAPHY
... 59
APPENDIX B:
WENCOMINE FLEET MANAGEMENT
... 62
APPENDIX C:
CODE DEVELOPED IN C#
... 65
APPENDIX D:
CODE DEVELOPED IN PHP
... 84
List of Figures
Figure 1 - Mining Topology Challenges
... 8
Figure 2 - 2.4 Gigahertz Channel Plan (Gunther, 2015)
... 14
Figure 3 - Channel Crossover Interference
... 15
Figure 4 - Waterfall Model
... 23
Figure 5 - Incremental Development
... 24
Figure 6 - Reuse-oriented Development
... 25
Figure 7 - Client Overview Data Flow
... 29
Figure 8 - Client Data Capture
... 30
Figure 9 - Transmit Application
... 31
Figure 10 - Client Interface 1
... 35
Figure 11 -Basic GPS Info
... 36
Figure 12 - NMEA Stream
... 37
Figure 13 - WiFi Data
... 38
Figure 14 - COM Port Error
... 39
Figure 15 - GPS Health Good vs Bad
... 40
Figure 16 - COM Port Disconnect
... 40
Figure 17 - Transmit Application
... 42
Figure 18 - Transfer Failed!
... 44
Figure 19 - VirtualBox
... 48
Figure 20 - GPS Mount
... 49
Figure 21 - Application Testing
... 50
Figure 22 - Initial Display Design
... 51
Figure 23 - Raw data XML
... 52
Figure 24 - Minevision
... 63
Figure 25 - Out of Network Range
... 63
List of Tables
List of Appendices
APPENDIX A:
PROJECT SPECIFICATION
... 60
APPENDIX B:
WENCOMINE FLEET MANAGEMENT
... 62
APPENDIX B1:
MINEVISION ... 63
APPENDIX B2:
FLEET CONTROL ... 64
APPENDIX C:
CODE DEVELOPED IN C#
... 65
APPENDIX C1:
PROGRAM.CS
... 66
APPENDIX C2:
CLIENT.CS ... 67
APPENDIX C3:
TRANSMIT.CS ... 76
APPENDIX C4:
MYSQLDB.CS ... 79
APPENDIX C5:
CONFIGURATION FILE ... 83
APPENDIX D:
CODE DEVELOPED IN PHP
... 84
APPENDIX D1:
GPSDATA1.PHP ... 85
APPENDIX D2:
PHPSQLAJAX_GENXML.PHP... 87
APPENDIX D3:
PHPSQLAJAX_DBINFO.PHP ... 88
APPENDIX E:
MYSQL CONFIGURATION
... 89
APPENDIX E1:
MYSQL SERVER CONFIGURATION ... 90
APPENDIX E2:
LOCAL DATABASE DESIGN ... 97
Nomenclature and Acronyms
AP Access point
BSSID Basic service set identifier
COM Port Serial communication port
FMS Fleet management system
GLONASS Global Navigation Satellite System - Russian
GNSS Global Navigation Satellite System
GPS Global positioning system
IDE Integrated development environment
IEEE Institute of Electrical and Electronic Engineers
LAN Local area network
MAC Media access control
NAVSTAR-GPS Navigation system with timing and ranging global positioning system
NMEA Nation Marine Electronics Association
OBD On-board diagnostics
PtP Point to point
RSSI Received signal strength indication
RTCM Radio technical commission for marine services
RTK Real time kinematic
SSID Service set identifier
TTL Transistor-transistor logic
USB Universal serial bus
VHD Virtual hard disk
Wi-Fi Wireless fidelity
WLAN Wireless local area network
Chapter 1
Introduction
1.1
Outline of the Study
The need to investigate new methods in monitoring wireless networks was identified from
experienced gained whilst working with wireless networking for open cut mining. The processes used
to determine the health and effectiveness of the network did not provide information relating directly
to the mobile clients operating in the field leading to the investigation to use the mining fleet
computing system to assist in reporting network health information.
1.2
Introduction
Wireless networks are now common place, domestically, commercially and industrially. For the
commercial and industrial implementations the importance for network coverage and performance is
becoming a high priority for business systems leveraging the technologies. The introduction of the
IEEE 802.11 standard has provided manufactures the ability to produce a standard suite of products
and systems now utilised by these businesses; specifically to this study in open cut mining
applications.
For many businesses the wireless network is required to perform over a fixed topology but for mining
applications the site is continually changing and tends to cover large areas. In this case present form
Meandu Mine the site covers approximately twenty five square kilometres. The ability to simulate the
coverage requires up-to-date modelling information not always available and survey work takes time,
By utilising the client computing, GPS receivers and wireless network adaptors on mining fleet
vehicles to report live information about the wireless network coverage based on GPS location, an
alternative method is tested to improve wireless network monitoring.
1.3
Problem
Statement
With a continually changing topology, large distances and depths involved with open cut mining, the
network infrastructure, required to support the mobile fleet operation, cannot monitor or report the
areas affected, as seen at the client interface.
1.4
Research Aim and Objectives
The aim of this project is to develop a system that can utilise mobile fleet, computing, GPS and
wireless client infrastructure to report network coverage based on GPS telemetry for early detection of
problem areas.
There are two main objectives for this project and each section requires the creation and integration of
software systems:
Data Collection - Continuously sample available Wi-Fi data tagged with GPS telemetry,
including capturing vehicle location during loss of network connection.
Data Storage - Server/client arrangement to store all the incoming client information in a
1.5
Conclusions
This dissertation aims to determine a suitable process to monitor wireless network performance based
on client information. The research resulted in the development of software that is suitable to report
wireless network and GPS information, collected at each client on the network.
A review of the literature for this research identified alternative methods to analyse Wi-Fi systems and
suitable processes that can be employed to achieve the aim. The outcome of this study produced a
design and preliminary development of software that can integrate with existing computing, wireless
Chapter 2
Background
2.1
Introduction
This chapter discusses the background behind the projects aims. The background information is
drawn from personal experience by the author with over 20 years of experience working in the power
generation and mining industries. The study has focused on open cut mining operations at Meandu
Mine.
2.2
Open Cut
Coal
Mining
The general requirement of an open cut coal mine is to relocate unwanted material, such as topsoil,
rock and other overburden to uncover the seams of coal beneath. The coal is then extracted and
processed to meet quality metrics, such as moisture, ash content and the energy per tonne of final
product. The excavation process first involves removing and storing the top soil; for later land
rehabilitation. The layers between the topsoil and coal seam are then relocated through a cycle of
fracturing through drilling and blasting followed by excavation. The excavation is usually performed
with combinations of excavators, shovels, rear dump trucks, bulldozers and draglines. As an open cut
mine progresses along the seams of coal, the areas now depleted of the useful minerals can be
rehabilitated. Rehabilitation requires bulk waste material from the mining activities to fill the mine
voids and built up to a profile deemed appropriate for the area. The profile is then capped with the
stored top soil and revegetation activities occur. In order to minimise erosion of the new deposited top
soil the ground profile, in particular slope, require precise design and construction. It is the use of
high precision GPS (refer 2.4) on board machinery such as bulldozer and graders that ensure the
The cost of the final product represented as dollars per tonne or possibly dollars per energy unit.
Either way, one primary business objective is to produce the final product at the lowest cost. The
costs are measure through wages, fuel and maintenance activities versus the amount of final product
delivered or the total energy delivered. In the case for Meandu mine the figures are measured as
dollars per gigajoule. The commercial goals for the business include meeting delivery targets, at the
required quality, for the lowest cost.
2.3
Fleet
Management
System
In order to evaluate the cost of the final product, the running cost of the mine and the amount of final
delivered product must be sourced. The modern mine has incorporated a fleet management system as
one of the tools to capture the production information from the mining fleet (refer Appendix B). The
production information recorded varies depending on the vehicle in the fleet. The fleet for Meandu
consists of excavators, rear dump trucks, bulldozers, scrapers, graders, water carts and a dragline. The
production rates of the excavators ranges from 1000 tonne per hour to 2500 tonne per hour. The
variability is dependent on the size of the excavator, the number and size of the dump trucks, the
distance from working face to dump location and the density of material being moved.
A fleet management system (FMS) provides information collected from the mining fleet back to a
central location to measure fleet performance against the expected metrics, provides the fleet
operators with a user interface to track their operational status and operation plan. The primary
information collected from the dump trucks is a count of the number of loads of material, the weight
of each load and the time taken to complete a complete cycle from dump to dump. This provides the
key information to determine the production rates for each dump truck.
In order to capture this information each vehicle in the fleet must have the available sensors to
measure the physical information connected to the on-board diagnostic (OBD) processor, usually
to the fleet management hardware; in the case for Meandu mine each vehicle is fitted with a
ruggedized, on-board computer. The computer operates on a Windows XP embedded operating
system running the FMS software Wencomine, from Wenco. The FMS computer is interconnected to
the proprietary OBD systems for each vehicle to extract the raw data, as well as extra technology
including wireless networking and GPS receivers.
2.4
High
Precision
GPS
Another function of the FMS is to support high precision GPS operations. High precision GPS
requires a time correction signal to be sent from a nearby base station to the mobile equipment. The
corrections made increase the GPS accuracy to a few centimetres. At Meandu Mine the high precision
GPS system use the real time kinematic (RTK) signal to provide the necessary correction information
to bring the accuracy of the GPS to within a few centimetres.
Equipment and activities now requiring the use of high precision GPS include:
Rehabilitation by bulldozers and graders for correct sloping to minimise the erosion during
early stages of revegetation.
Excavating equipment removing overburden or coal follow the mine plan set out by the
mining engineers.
Drilling and blasting requires precise location and depths of holes required as per the blast
plan. The volume of the explosive products required for blasting the overburden and raw coal
over large areas means the use of explosives must be managed effectively to minimise losses.
Rework is a high cost for mines when machinery is required to readdress an area to meet the mine
plan. The cost of running the large machines along with wages can be thousands of dollars per hour.
So the time and areas during which this equipment is not accessing the GPS correction data the mine
can suffer significant losses reworking those areas.
2.5
Meandu Mine
The wireless local area network (WLAN) at Meandu utilises the IEEE 802.11 a/b/g/n/s standards for
wireless networking operating on the 2.4 gigahertz (IEEE 802.11b/g/n) and 5 gigahertz (IEEE
802.11a) unlicensed frequency bands. The specific design of the network is that of a wireless mesh
network (WMN). It is not the intention of this paper to review the operating principles of wireless
mesh networking as regardless of the wireless technology implemented, the primary issue related to
this study, is maintaining reliable network coverage for all mining activities requiring access to a
wireless network. This reliability issue stems from the mining activities dramatically altering the
topology of the landscape. These changes come about through excavator and dump truck operations
relocating thousands of tonnes of material per day. This creates changes to areas around the working
face, where the excavator is operating, also the dump location is receiving this material which may be
either filling a void or creating a new dump. The dumps can reach hundreds of meters in height
blocking network links and creating shadows with network transmission. A second source to the
change in topology is with dragline activity. Draglines remove large quantities of overburden at
several thousand tonnes per hour. This material is dumped within the span of the dragline boom thus
the topological changes are localised.
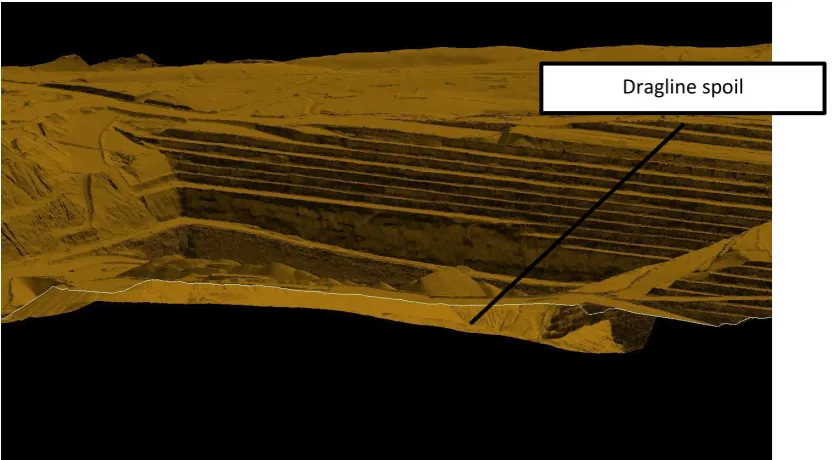
An example of topology challenges is where over the course of a few days a dragline has raised a
spoil pile by over 50 meters between itself and the nearest access point (refer Figure 1) causing
network interruption to the dragline and other vehicles operating at the base of this pit, which is over
Figure 1 - Mining Topology Challenges
With the implementation of wireless networking in open-cut mining operations the constantly
changing terrain, vehicle location and environmental conditions can lead to poor or no coverage in
operational areas, causing delays or loss of vital information resulting in costly rework.
2.6
Conclusion
Overviews of mining operations and equipment that utilise wireless network infrastructure have been
discussed, as well as the importance of the network supporting these operations. There can be large
losses in operational efficiency when the network is not able to provide coverage to areas required,
costing the business time and money. Whilst the network may have been deployed and tested to
ensure effective coverage initially, the nature of open cut mining causes the topology to change
rapidly potentially creating areas affecting network coverage. Investigation into methods capable of
supporting the business to analyse the network coverage utilising the client hardware available can
provide an additional tool to determine areas affected.
Chapter 3
Literature Review
3.1
Introduction
The literature review supports the background information relating to the use of wireless networking
in mining operations. The different techniques available to support wireless network monitoring and
development, relating to network coverage, are compared to the problem statement and the proposed
solution.
3.2
Networking for Mining
As explained by Vellingiri et al. (2013) one of the primary reasons for the installation of a WLAN in
mining is for remote monitoring and diagnosis. A fleet management system allows mining operations
to be continuously optimised through real-time monitoring, assignment of fleet resources, monitoring
production information, and telemetry and machine health.
Another advance in efficient mining operations has been the implementation of high precision GPS.
High precision GPS corrections are sent to equipment such as drill and blast equipment, bulldozers,
graders and draglines for critical operation that require accuracy of a few centimetres. This is
achieved through the use of a base station situated in a fixed location with a known GPS reference.
Some other uses for a WLAN are real-time video surveillance for monitoring key infrastructure, such
as explosive facilities and monitoring fleet operation for feedback in training. Safety system
monitoring is also becoming increasing reliant on WLAN infrastructure, such as man-down systems,
geological monitoring, and collision avoidance and tracking systems. Maintenance systems now also
integrate with data from boom stress monitoring, fuel tracking, and tire pressure monitoring and
Information system access so personnel in the field can access site specific and corporate information
systems.
As more advanced communication systems become integrated into mining activities, the demand for
these systems to function with a high reliability also increases. Vellingiri et al. (2013) addressed that
business systems for production and maintenance planning as well as monitoring of mining assets can
be adversely affected. Monitoring of the assets can lead to increased operational efficiencies by
analysing the health of the machines and the operational behaviours of operators. This can then lead to
improved workflow implementation through operator training.
Reliable networking is becoming increasingly important for tracking systems for mining. Kloos et al.
(2004), Novak et al. (2010) and Jun et al. (2010) all discuss the methods used by tracking systems for
mine safety. To determine the location of equipment underground, without the ability for GPS
tracking, the distance to APs is calculated using various techniques and so becomes reliant on the
quality of the network coverage. Novak et al (2010) recommends communications for emergency
systems and post-accident recordings also demand reliable and effective network coverage and that
the implementation of wireless mesh technology can meet those needs, due to the systems inherent
redundancy and ease of extensibility. They however did highlight these systems are becoming
increasingly complex and is still a relatively new technology.
3.3
Wireless Network Challenges
Deploying a wide-scale wireless network is not an exact science. There are many factors to account
for in the design phase such as the performance requirements, topology, interferences, security and
cost. For fixed infrastructure, such as offices, warehousing or university campuses the design for the
given topology tends to remain constant for extended periods. Some of the factors that can change
rapidly for these installations are interference due to other networks extending past the boundary of
the network, the loading on a given access point due to increased users at a particular location or a
In the case of an open cut mining environment a primary difference to fixed infrastructure
installations is the continually changing landscape. The initial design and deployment of the access
points and backhaul network may have been suitable to meet the performance criteria initially but in
some cases, within days, the coverage and thus performance of localised areas can be adversely
affected. Operational personnel are generally not trained to fault find or analyse the network
performance, thus a problem may only be reported after some time and the detail of the event for
further investigation not captured.
Analysing network performance can be a time and resourcing consuming exercise, particularly in an
open cut mine where distances can be upwards of 20 kilometres from maintenance workshops. The
network infrastructure needs to be reviewed for faults and performance issues; localised inspection at
the problem site is surveyed, the machine/s reporting the issue inspected for damage. If the root
problem is the location of access points, the network may require additional nodes added to the
system or infrastructure relocated. Relocation of network hardware needs to be critically analysed to
ensure further network issues are not encountered due to the relocation.
3.4
Wireless
Design
and Monitoring
There are several phases to a wireless network lifecycle. The system must first be planned based on
the requirements specification.
3.4.1
Modelling
and SurveyThere are two mainstream methods in designing a WLAN; site survey using empirical measurements
and planning software using propagation modelling. Zvenovec. et al. (2003) explore the advantages
and disadvantages of these two methods. The testing and modelling were both for indoor office
environments and showed that reasonable predictions of the effects of walls, corridors and openings
can be simulated with reasonable confidence. Through their study they conclude that planning
software has many advantages over site surveys. In the case here of open cut mining, the distances
measurements across even a small mine or quarry would take significant time and only be valid for a
short period. Their study was focused on the comparison of the two techniques but did consider the
use of both systems where a modelled design could be deployed and a site survey used to test and or
improve the models design, perhaps for a sub-set of the area.
In this manner, a report on the statistical validation of WLAN range calculated with propagation
models for industrial environments by chipset-level received signal strength measurements was
undertaken by Tanghe et al. (2008). The study was again limited to indoor industrial environments
such as warehouses and factories. The issue concerning the validation of modelling compared to site
survey was addressed with a key finding being that the results between the two methods were
statistically in agreement. They did note that the physical environment did cause some deviation
between the two methods, notably due to large obstacles causing severe attenuation degradation in
local area. Similar to a mining environment, the general topology of the site would remain unchanged
for long periods of time but local areas are radically modified with large earth moving equipment
removing or depositing material.
Open cut and underground mining both have similar challenges in design, implementation and
monitoring of any form of wireless network. Both environments are constantly changing and
line-of-sight is regularly affected. A survey of wireless network methods was researched by Forooshani et al.
(2013) on underground mining. They found that the mesh network was the most reliable due to the
redundant, self-learning and self-healing fundamentals of the technology. Their preference was for
empirical measurements via survey as the results are definitive but with the limitations of physically
accessing all areas required for survey this approach is becoming less common.
Where a network may be required for emergency communications, more so for underground mining,
Moutairou et al.(2006) develop a generic algorithm for a backhaul network design. The link was
based on a mesh network operating in the 5 Gigahertz spectrum. Backhaul design is not concerned
with coverage but point to point (PtP) links, ensuring each node has adequate throughput available to
designed by modelling then installed, the system is easy to test as all the nodes on the link should be
active on the network. Unfortunately their study did not compare their results to a physical system and
they do not investigate the potential to simulate the access layer.
These studies highlight that survey and modelling have their advantages and disadvantages. The
studies above all prefer the practical advantage of design by simulation and modelling but this does
not provide empirical data to ensure an effective and efficient network.
3.4.2 Sensor
Based
MonitoringAn alternative method to perform live data analysis of wireless network coverage would be to deploy
another network of sensors that sense the wireless network. One such system as developed by Zhou et
al. (2013), called WizNet, utilises a network of ZigBee-based sensors. ZigBee is a wireless mesh
network standard built on the IEEE 802.15.4 standard. The concept is to use the ZigBee modules to
listen in to the shared frequency spectrum that 802.11 and 802.15 both operate within. As the ZigBee
modules are low cost, low power devices they can be cheaply deployed into areas that require
continuous monitoring. Where the studies of Zvenovec et al. (2003), Tanghe et al.(2008) and
Moutairou et al.(2006) all see the use of modelling as a suitable approach to determine network
penetration, Zhou et al.(2013) believe these methods do not produce the granularity and are location
constrained by using the existing network infrastructure. Granularity is becoming essential for
wireless networking in mining and so having a system that operates outside the WLAN has its own
strengths. Some of the major disadvantages for an open cut mining operation to utilise a system such
as WizNet are the distances required for the low power devices to transmit. To be effective, the
devices may need to be mounted directly on the mining fleet and so the same problem can occur that
the WizNet mesh network does not have suitable penetration for its own mesh system to adequately
3.4.3
Crowdsourcing
Crowdsourcing can be defined as the practice of obtaining needed services, ideas, or content by
soliciting contributions from a large group of people and especially from the online community rather
than from traditional employees or suppliers (merriam-webster.com, 2015).
From my review of others works there is a reasonable degree of interest and development in the use of
crowdsourcing for wireless network monitoring. With the use of mobile device capable of collecting
network information that can be sent to central location prevalent on most WLANs, as is the case for
the mining fleet at Meandu mine, is readily achievable. Frangoudis et al. (2015) presented results
showing a significant performance improvement using crowdsourcing on an indoor WLAN. Their
study was limited to indoor wireless, as too was the work on Pazl by V.Radu et al.(2013), MCNet by
Rosen et al. (2014) and R.K. Ganti et al. (2010).
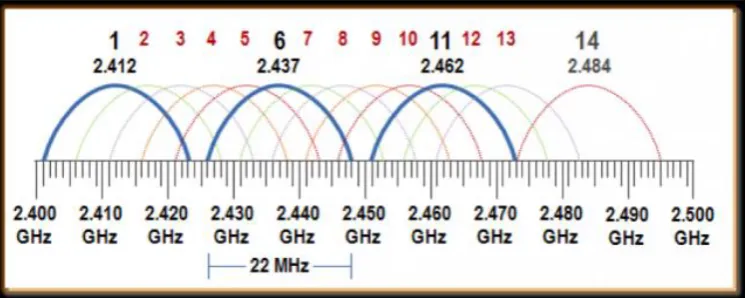
Besides wireless network coverage another area of interest for P.A. Frangoudis et al. (2015) was
cross-channel interference. In Australia the 2.4 gigahertz IEEE 802.11b/g unlicensed spectrum is
divided into 14 channels. Each channels bandwidth extends over its neighbour. As shown in Figure 2
the use channels 1, 6 & 11 provide a spread of frequencies that do not interact.
[image:27.595.112.487.527.676.2]
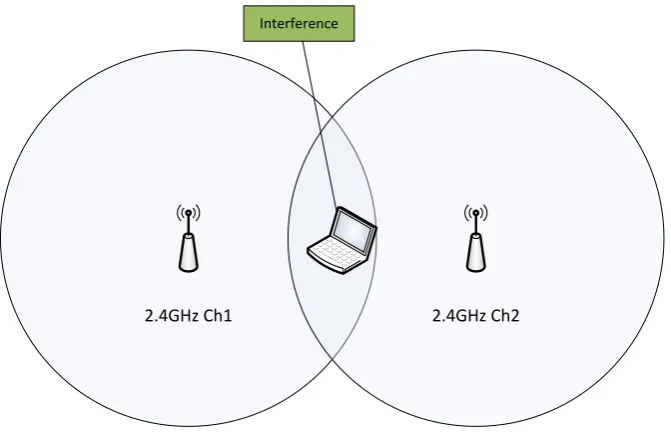
A network design should ensure to minimise any channel crossover and usually each AP can observe
what is nearby and report any conflicts accordingly. This is fine when the APs are within reach of one
another. With the case of cross channel interference (refer Figure 3) where two APs are not within
range of on another but their radiated signals do overlap at a location where a user is trying to operate,
interference is experienced by the client but is not seen by the monitoring system.
2.4GHz Ch1 2.4GHz Ch2
[image:28.595.131.467.246.462.2]Interference
Figure 3 - Channel Crossover Interference
A common theme amongst the literature from P.A. Frangoudis et al. (2015), V. Radu et al. (2013),
Rosen et al. (2014) and R.K. Ganti et al. (2010) is that of security and trustworthiness. The security
of personal information if tracking of a device is being used to map to WLAN coverage was discussed
and so methodology was derived to ensure the most basic of information was made available This
would be reasonable for a system that is designed to monitor untrusted networks or extended to
3G/4G mapping systems where a user’s regular movements can be tracked. In the case for mining
network coverage, the user is a known user on a known and trusted network. The location of the user
i.e. haul truck etc. is a vital piece of information to assist in network mapping. The other concern
Frangoudis et al. (2015) and Rosen et al. (2014) in that the user may present false data to the system
and so care must be taken to validate the data. This would not be the case for the mining environment
as no uncontrolled user would be connected to the network or the monitoring system.
V. Radu et al. (2013) and Rosen et al. (2014) developed systems called Pazl and MCNet, respectively,
for crowdsourcing network information using mobile devices. Both studies were limited to indoor
wireless networks utilising basic localisation techniques to determine the user’s position. Obviously
knowing a client position indoors presents its own challenges and there are many studies relating to
this. The authors also compare their work to AP vantage point surveying and manual site survey
showing a significant improvement in reporting fidelity. The Pazl system was not live but instead
buffered the data locally and waits for an opportunity to download the data from each client. This
would be a requirement for the GPS-based system during periods of no signal coverage but GPS
tracking can still occur.
A limitation with these systems is the ability to track the user in areas of no network coverage.
Obviously if the clients are using estimated distance to APs to determine their rough position and
there are no APs, then location tracking is difficult. Both systems consider the additional use of GPS
positioning for outdoor tracking but rule this out due to the power consumption required on the
mobile devices. This is not a concern for vehicle mounted systems but consideration should be made
if a vehicle is out of service for an extended period as battery drain will occur eventually.
3.5
Global
Navigation
Satellite System
Satellite navigation is used extensively across the world in almost all industries, commercial and
domestic applications. Employing a Global Navigation Satellite System (GNSS) provides the
information required to accurately determine position and time anywhere on Earth. The fleet
Currently there are two operational global operational GNSSs, NAVigation System with Timing And
Ranging Global Positioning System (NAVSTAR-GPS) or commonly known as GPS, operated by the
United States of America and the Russian GLObal NAvigation Satellite System (GLONASS).
3.5.1 Data
Protocols
GNSS receivers can be developed either with manufacturer (proprietary) formats and protocols, or
they can utilise the two international standards (NMEA or RTCM).
The NMEA-0183 data interface, standardised by the National Marine Electronics Association, is a
serial communications interface (TTL or RS232). The data is relayed according to the NMEA-0183
specification as data sets:
GGA (GPS Fix Data, fixed data for the Global Positioning System)
GGL (Geographic Position – Latitude/Longitude)
GSA (GPS DOP and Active Satellites, degradation of accuracy and the number of active
satellites in the Global Satellite Navigation System)
GSV (GNSS Satellites in View, satellites in view in the Global Satellite Navigation System)
RMC (Recommended Minimum Specific GNSS Data)
VTG (Course over Ground and Ground Speed, horizontal course and horizontal velocity)
ZDA (Time & Date)
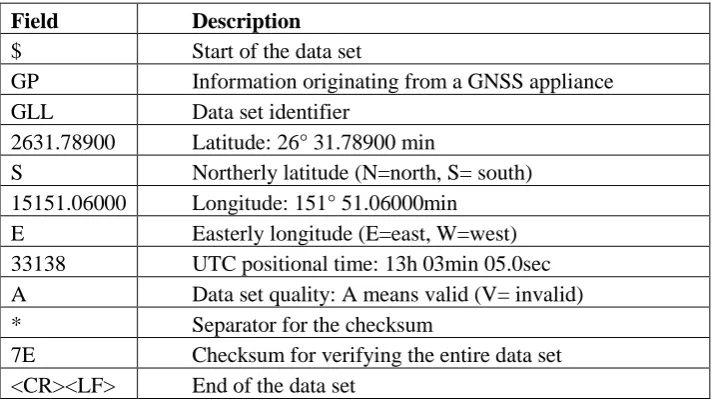
The data sets of relevance are the:
GLL data set (geographic position –latitude/longitude) contains information on latitude and
longitude, time and health status of the information. Table 1 shows the deconstruction of the
NMEA sentence $GPGLL,2631.78856,S,15151.05565,E,033138.00,A,A*7E
ZDA data set (time and date) contains information on UTC time; the date and local time (refer
Field Description
$ Start of the data set
GP Information originating from a GNSS appliance
GLL Data set identifier
2631.78900 Latitude: 26° 31.78900 min
S Northerly latitude (N=north, S= south)
15151.06000 Longitude: 151° 51.06000min
E Easterly longitude (E=east, W=west)
33138 UTC positional time: 13h 03min 05.0sec
A Data set quality: A means valid (V= invalid)
* Separator for the checksum
7E Checksum for verifying the entire data set
[image:31.595.120.478.96.299.2]<CR><LF> End of the data set
Table 1 - GLL Data Set
Field Description
$ Start of the data set
GP Information originating from a GNSS appliance
ZDA Data set identifier
035418.00 UTC time: 03h 54min 18.00sec
03 Day (00 -31)
09 Month (01-12)
2015 Year
00 Reserved for data on local time (h), not specified here
00 Reserved for data on local time (min), not specified here
* Separator for the checksum
61 Checksum for verifying the entire data set
<CR><LF> End of the data set
[image:31.595.118.480.373.587.2]3.6
Conclusion
The available literature for wireless network surveying revealed that there is scope for a GPS based
crowdsourcing application to be developed. Similar studies and software development has occurred
for indoor Wi-Fi monitoring but these studies have not explored the option to integrate GPS telemetry
in any detail. As shown in the literature, deployment of a client application for network monitoring is
a cheap solution that can provide the fidelity required that modelling cannot guarantee.
The network utilisation for the mining application will have trusted and controlled clients accessing it.
Therefore security concerns with tracking users movements is not an issue and is in fact a requirement
for the monitoring system. The possibility for corrupt data to be sent from a client due to intentional
Chapter 4
Methodology
4.1
Introduction
The methodology section discusses the choice and justification of design methodology. This consists
of how the system will be modelled and justification of using an incremental development approach
mixed with reuse software engineering techniques. What software packages will be utilised and the
programming languages chosen.
4.2
Philosophy
The use of open source software that is well supported and documented is a criterion during
development to provide a cost effective but reliable process.
The programming languages needed to be readily available whilst utilising the strength from others
works where permitted. This follows a re-use policy for code development.
Development of programs was best supported using proven modelling techniques for small
development software systems.
4.3
Requirements
Engineering
The requirements engineering process provides a framework to document the user and system
4.3.1
Functional
RequirementsThe user requirements are:
a) The user shall be able to pause and restart data collection
b) The user shall be able to stop the program anytime
c) Multiple sampling times for data collection shall be selectable by the user during operation
The system requirements are:
a) The system requires to operate on a Windows XP Embedded operating system
b) The system shall have a Windows form interfaces for all user interaction
c) The system will display the current GPS and Wi-Fi information
d) The system shall collect GPS data via a serial interface
e) Information from the GPS data sets shall be the NMEA-0183 specification
f) The system will record any locations with no Wi-Fi data
g) All GPS/Wi-Fi related data will be transmitted to a central database
4.3.2 Non-
functional
RequirementsProduct requirements:
a) The client system shall be able to buffer at least 10 minutes of sequential GPS locations at the
lowest sampling rate
Organisational requirements:
a) None
Development requirements:
a) The system shall be developed in standard, supported languages
4.4
System
Modelling
There are three main software process models that could have been used for the development of this
software, as described by Sommerville (2011). Whilst not mutually exclusive, any combination can be
applied to suit the size and complexity of the project. The three models are:
Waterfall model
Incremental development
Reuse-oriented software engineering
4.4.1
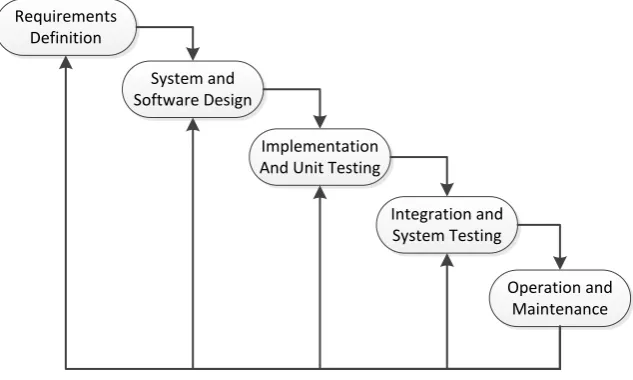
Waterfall Analysis
The waterfall model requires a plan-driven process where all the process activities require a plan and
schedule before starting. This approach is simple and easy to understand producing a rigid model.
Management of each phase of development would provide specific deliverables and a review process
for each of the processes. As each phase (refer Figure 4) is developed and completed one at a time
with no overlap, the programmer can direct their attention to a single task until completed. Where the
requirements are very well known the waterfall model can work well and had the potential to satisfy
Requirements Definition
System and Software Design
Implementation And Unit Testing
Integration and System Testing
[image:36.595.141.458.74.264.2]Operation and Maintenance
Figure 4 - Waterfall Model
The problem with the waterfall model is that once the application is in the testing phase, it is difficult
and time consuming to introduce changes that had not been well thought out in the concept phase.
Working software is not produced until late in the life cycle of this modelling technique which can
present high amounts of risk and uncertainty for software success. As this project is predominately
experimental there is not a defined end point in its development and it is expected that the
requirements will change throughout development, which conceptually is not supported by the
waterfall model. As the software development was expected to be developed though a set of smaller
units, each being tested and then later combined for complete system testing the waterfall model was
not chosen.
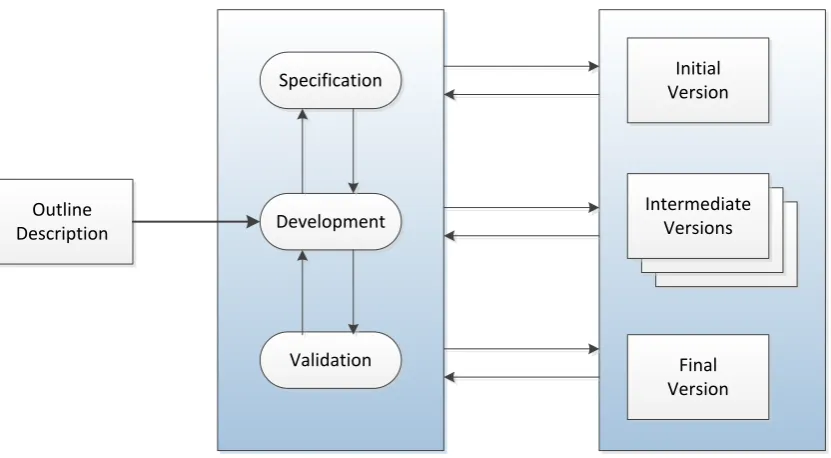
4.4.2
Incremental Development
The incremental development model (refer Figure 5), a fundamental part of the agile method, allows
for a staged approach to software development. This approach allows for the specification,
development and validation to be interleaved providing a fast response to requirement alterations. As
the software can be developed incrementally, working code can be generated quickly and early in the
provided the flexibility to accept the changes with minimal cost to change the scope and requirements
as they developed. Testing and debugger smaller iterations of code are also favourable as it is easier
to rectify and retest. As each unit of code is developed the end user can provide feedback to any
required specification changes early in the software’s development and testing.
Outline Description
Specification
Development
Validation
Initial Version
Intermediate Versions
[image:37.595.80.496.225.454.2]Final Version
Figure 5 - Incremental Development
The disadvantages to this model are that it requires good planning and design. Before the system can
be broken down and created incrementally, there needs to be a clear and complete definition of the
whole system. Not having a rigid structure allows the scope to drift potentially risking deadlines to
complete the project.
The requirements for the complete system were clearly defined and understood, with details being
expected to evolve during time. The time frame to develop the software was short, thus early
development of code to be tested and debugged was essential. The incremental model did lend itself
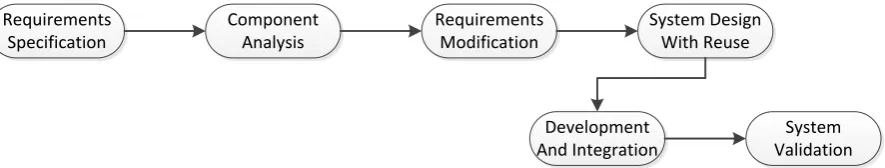
4.4.3
Re-use Oriented Development
The concept of retrieving GPS data, Wi-Fi access point information and store and forward data are
not new concepts or designs. It was therefore feasible that a large portion of the software project
would entail the reuse of software and integrated to suit the specifications. The advantage of code
reuse is the development phase builds on previous work thus reducing development time (refer
Figure 6). The components intended for reuse can be validated prior to implantation into the
developing software, thus the potential errors can be debugged prior to continued development.
Requirements Specification
Component Analysis
Requirements Modification
System Design With Reuse
Development And Integration
[image:38.595.81.524.300.384.2]System Validation
Figure 6 - Reuse-oriented Development
After review of the three basic models the combination of incremental development and
reuse-oriented software engineering were chosen for the project. This was due to the expectation that the
design will be altered many times during the development and that there would be suitable reuse of
software.
4.5
Software
Strategy
The methodology reviewed software applications capable to support the development and operation
of the system. The software strategy includes the use of programing languages suited to developing
the data collection application, data storage methods and the systems graphical user interfaces for the
4.5.1
Constraints
The Fleet Management System (FMS) at Meandu utilises a ruggedized computer mounted onboard
the fleet vehicles. These computers run a Windows XP Embedded operating system supporting the
.NET framework 4.0 on an X86 processor. Being a Windows operating system all the development
work was also completed in the Windows environment capable of supporting .NET 4.0.
4.5.2
IDE
To develop software in any language the use of a source code editor is required. The source code also
requires a compatible compiler that supports the libraries and operating systems. A widely used and
support method for software development is Microsoft Visual Studio. Visual Studio is an integrated
development environment (IDE). The advantages of using Visual Studio, is a developer can work
with C#, PHP, JavaScript and Visual C++ all supporting the .NET framework for language
interoperability. The IDE selected was Microsoft Visual Studio 2013 IDE Community Edition.
4.5.3
Simulation
As a full production based FMS computer operating in the production environment was not available
for developmental system testing, a virtualised testing platform was utilised. VirtualBox is a free,
open source application that is capable of supporting the Windows operating system both as a host
and client. Using the disk2vhd application, freely available, a virtual hard drive (VHD) of a running
FMS computer was created for use with VirtualBox. This provided access to a simulated working
system, with some limitations regarding wireless network adaptor access on the host, but still allowed
some testing during development; importantly that the project application was compatible with the
4.5.4
Database
The type of database for the system to operate was not a key requirement. However the criteria based
on the overall philosophy during development was to utilise free, open source software were possible.
MySQL met these criteria, is commonly used and well supported. A common suite of software
packages for web serving data is known as WAMP; Windows, Apache, MySQL, PHP. These
packages working together is a pseudo standard amongst developers. The selection based on the
research suggested MySQL as a suitable package to utilise both as the local and remote database
tools. Appendix E contains the database configuration information. The datatypes were selected based
on the information being gathered by the application and the ability to filter and display information
on a Google Map; in particular the format for latitude and longitude. Both the client computer and the
remote database required each instance to have the MySQL server configured all ensuring the correct
database server and schemas are aligned with all installations.
4.5.5
Web Server
Leading on from the WAMP concept, some display interfacing was desired with a logical interface to
the information being via a web server. Apache web server is the most commonly used web server in
the world and is well supported and documented (W3Techs, 2015). It also complies with the free and
open source philosophy with the development for displaying information on via a web page being
written in the PHP language. The Visual Studio IDE also supported PHP coding.
4.5.6
Programming
LanguagesThere are numerous software programming languages that can be utilised for such a project. The
perception as to the best language is subjective to the programmer based on personal and professional
preferences. The approach was to survey available code developed by others that provided a potential
wireless network scanning. Other factors included the ability to use a simple display for testing and
validating all iterations of the process. The choice was dependent on familiarity to the C family and
the review of available examples of similar coding to the aim of the project. Some reuse of code, such
as the use of the ManagedWiFi.dll and the ease of use in developing Windows forms for use GUI, the
C# language is predominately used for the project. For development on web page design the review
led to the Apache development being created with the use of PHP.
4.6
Client
Design
Overview
The core process for the entire system is for the software to be installed on the client machines; being
the FMS computing system. The remote database is capable of storing all the information transmitted
from multiple clients. The data being transmitted from each client must align with the central server
such that all data types match and each entry is a unique entry.
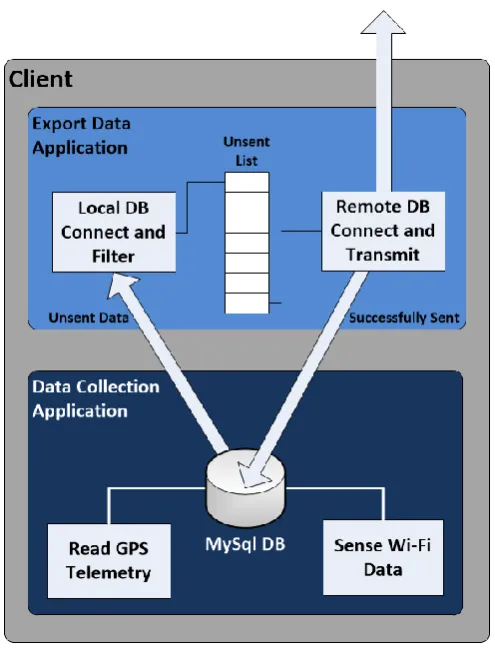
The design of the system to be installed on the clients was split into two distinct applications (refer
Figure 7). The first was the collection of the information and storage to a local database. The second
application was to retrieve unsent information and transmit it to a central database. The separation of
these activities allows each to operate at distinct, adjustable, time intervals to collect and transmit the
data, without affecting the performance of the other. The performance of this approach is discussed in
Figure 7 - Client Overview Data Flow
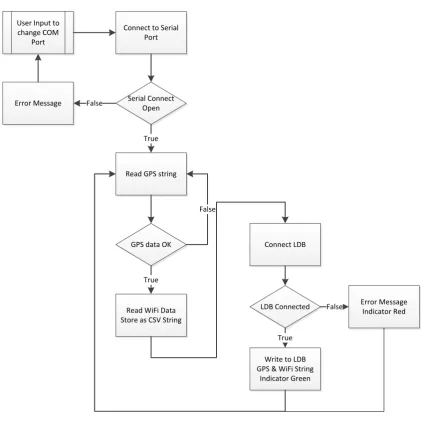
As shown in Figure 8, the data collection application retrieves the GPS location and all the available
SSID information for each available access point. This information is then stored into a local
Connect to Serial Port
Serial Connect Open Error Message False
Read GPS string True
Read WiFi Data Store as CSV String
GPS data OK
True
False
Connect LDB
LDB Connected Error Message Indicator Red False
Write to LDB GPS & WiFi String
Indicator Green True User Input to
[image:43.595.85.512.62.496.2]change COM Port
Figure 8 - Client Data Capture
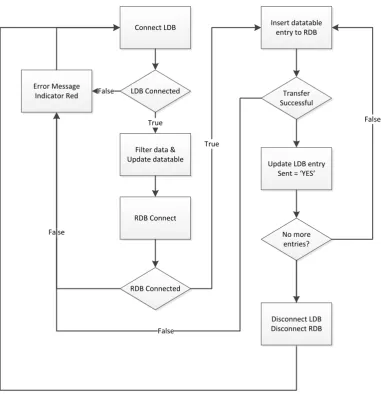
Whilst the client data collection application is running, the second application is exporting the local
information to a remote database (refer Figure 9). For each iteration of the timer in the export data
application, the local database is filtered for all unsent data into a list; the database contains a table
entry for sent data as a string for ‘Yes’ or ‘No’. As each list item is sent to the remote database the
Connect LDB
LDB Connected
Filter data & Update datatable
True
RDB Connected Error Message
Indicator Red False
RDB Connect
False
Insert datatable entry to RDB
True
Transfer Successful
Update LDB entry Sent = ‘YES’
No more entries?
False
False
[image:44.595.93.475.67.462.2]Disconnect LDB Disconnect RDB
Figure 9 - Transmit Application
The concept of this approach allows the local database to buffer the GPS locations during periods of
ineffective wireless network coverage associated with the network the client should be connected to.
Once network connection is re-established, the buffered GPS locations are sent to the remote database
providing vital location data to allow accurate analysis of the wireless network coverage. Also if the
data collection application has stopped, for any reason, the export functionality can continue until all
4.7
Software
Testing
The system was segregated into several modules: GPS, Wi-Fi, Local Database and Transmission.
Each unit tested to ensure there was no inadvertent failure of the program as well as the system
providing an accurate and desired response during normal and abnormal operation.
4.7.1
GPS
TestingTesting of the GPS unit established reliable reading of the NMEA sentence streams. More importantly
all the possible failure mechanisms were tested. The importance of the location information is central
to the systems functionality. Testing of possible failure mechanisms included:
GPS receiver disconnected at system start.
GPS receiver disconnection during operation
No satellite information available
NMEA sentence unavailable
For a successful GPS read, the latitude, longitude, time and date information must all be successfully
read from the NMEA sentence.
4.7.2 Wi-Fi
Testing
The desired response of the functioning system is to report GPS locations with whatever wireless
information is or isn’t available. Any failure of the local wireless adaptor on the client provides the
same result as no wireless network information. The unit was tested for the scenario where the local
wireless adaptor was not available, when no wireless networks were available and also when the
4.7.3
Database
TestingIf the client application has no access to the local database or there is a failure to store the information
the client application will not buffer the required information for transmission back to the remote
storage. The system requires specific datatypes for each table entry which was tested against
simulated data and data types, including incorrect formats to ensure the system did not fail
unexpectedly. The remote database was tested in conjunction with the transmission unit described
below.
4.7.4
Transmission
TestingThis application relies on the successful connection and manipulation of the local database and remote
database. The transmission application was tested against failure to connect to the local database,
failure to connect to the remote database before and during transmission. The unit’s ability to collect
and successfully update the local database was confirmed.
4.8
Conclusion
This section has resulted in the development of a system overview capable of meeting the project
specifications; to collect data at a client level and transmit this information to a remote server. The
methodology has covered the tools and methods required to achieve these goals, with all the
development relating to the ability to produce programs through coding. The methods to test the
Chapter 5
Detailed Design
5.1
Introduction
With the development of the initial design overview this chapter provides information on the detailed
design as was in place during development. As the method is that of an incremental approach to the
engineered software, this detailed design was developed over several steps. Section 4.2 to 4.3
describes the user interfaces for data collection and transfer for the client machines. The general
functionality of the code is explained in Section 4.5 with the detail explained from Section 4.6
onwards.
5.2
Collection User Interface
The client application collecting the Wi-Fi and GPS data has been designed with a simple user
interface via a Windows Form. This provides the user with the ability to monitor the health of the
application and provides the ability to control the application during runtime.
5.2.1
Main MenuThe main menu is a standard Windows form interface providing a series of drop down menu item
listings. The first menu tab provides the user to exit the application. Exiting the WiFi_GPS_Client
application will stop all GPA and Wi-Fi data collection and the Windows form interface will close
down for both the collection and transmit applications. A secondary method to close the application
has been included as a pushbutton via the form’s front end.
The second menu tab titled ‘COM Port’ provides a user with ability to select the serial communication
port that the relevant GPS receiver will be connected to. By default this has been set to COM Port 4
The final menu item tab sets the scan time for the system to gather and store GPS and Wi-Fi data in
the localised client based data base. By default this has been set to 1 second scan times. A selection of
sample times has been included as 1, 2, 5, 10, 30 and 60 seconds. The amount of data collected will be
directed affected by the sample time selected. This is discussed further in Chapter 6 for system
performance.
Feedback indication has been included in each menu item selection (other than Exit) to provide a
[image:48.595.82.552.320.549.2]visual queue as to the current selections for Com Port and Sample Time.
5.2.2
Form InterfaceThe main display presents the current state of the system during normal operation and the ability to
start, pause and exit the application. There is a single button that allows the user to pause or
recommence the data collection process. By default the system will automatically commence in the
running state if the COM port is available and working.
The information displayed to the user includes the states of the systems components:
a) Serial communications port health
b) GPS data health
c) Local data base health
d) Wi-Fi interface health
For each of the systems that are functioning correctly the form will display the current data sets as collected by the GPS receiver and the Wi-Fi adapter:
a) GPS UTC date and time
b) Last received latitude and longitude
c) All NMEA strings received via the serial com port
d) A list of all access points within range of the client wireless adapter
The last known GPS coordinates and UTC time are filtered from the NMEA sentences and presented
[image:49.595.160.433.587.635.2]to the GUI, providing a clear view of this vital piece of information (refer Figure 11).
Figure 11 -Basic GPS Info
The Date Time format has been configured as YYYY-MM-DD hh:mm:ss. This format provides a
from the NMEA stream received via the serial communications port. The UTC date and time is
extracted from the ZDA string (refer 3.5.1). This information is not converted in any way and whilst
there may be value in displaying the time stamp as localised time, this has little value from the client
perspective. The final goal of the system is to analyse the collective data received from multiple
clients. It is the central display that could be developed to manipulate the time stamps to local time if
required.
The GPS stream of NMEA sentences as displayed in Figure 12 gives all the available NMEA strings
[image:50.595.110.485.341.511.2]as activated in the GPS receiver.
Figure 12 - NMEA Stream
The primary data required for this initial development of the system is the GLL and ZDA sentences
for the Latitude and Longitude as well as the Time and Date, respectively. The GLL string does
contain the UTC time. This was initially used but during early testing the requirement for the date
became obvious when attempting to analyse data received over different days.
Iteration of the sample time has the system rescan the wireless networks available to the client
wireless adapter. For each available network there is a basic set of data that is displayed to the user.
databases (refer Figure 13).The service set identifier (SSID) is the public name of the wireless
[image:51.595.118.476.181.403.2]network. Entries that are blank; the SSID has been set not to broadcast.
Figure 13 - WiFi Data
Each network is operating on a standard channel as per the 802.11 standard. The channel is listed in
the CH column and as discussed in the introduction range from 1 to 13. If there is a localised problem
with interference a trained user can view the live data and interpret any nearby APs that may be
conflicting on the same channel or partially crossed channels.
The column labelled Signal contains the received signal strength indication (RSSI). As discuss in
section 2.5 the RSSI the signal strength is a key piece of information when discerning any network
problems. The requirements for the client tool do not require any further manipulation of the received
Wi-Fi data as all detailed analysis should occur from the collated data at the central database. The
information does however provide some initial diagnosis.
The physical address of each network is contained within the basic service set identifier (BSSID) or
Figure
Related documents