www.esri.ie
Working Paper No. 313
September 2009
Immigrants and Employer-provided Training
Alan Barrett
1, Séamus McGuinness, Martin O’Brien
and Philip O’Connell
Subsequently published in "Immigrants and Employer-provided Training" Journal of Labor Research, Vol. 34, Issue 1, March 2013, pp.52-78.Published online 3 July 2012
Abstract: Much has been written about the labour market outcomes for immigrants in their host countries, particularly with regard to earnings, employment and occupational attainment. However, much less attention has been paid to the question of whether immigrants are as likely to receive employer-provided training relative to comparable natives. As such training should be crucial in determining the labour market success of immigrants in the long run it is a critically important question. Using data from a large scale survey of employees in Ireland, we find that immigrants are less likely to receive training from employers, with immigrants from the New Member States of the EU experiencing a particular disadvantage. The immigrant training disadvantage arises in part from a failure on the part of immigrants to get employed by training-oriented firms. However, they also experience a training disadvantage relative to natives within firms where less training is provided.
Corresponding Author: Alan.Barrett@esri.ie
Keywords: Immigrants; employer-provided training; Ireland
JEL classification: J24; J6
1 We would like to acknowledge the funding provided by the Irish Research Council for the
Humanities and Social Sciences under the Government of Ireland Thematic Research Project Grants Scheme.
Immigrants and Employer-provided Training
Section 1: Introduction
Much has been written about the labour market outcomes of immigrants across countries and over time. Studies often find that immigrants experience labour market disadvantages relative to natives soon after arrival in their host countries (Chiswick, 1978). Such disadvantages are seen through lower wages or higher unemployment propensities for immigrants, usually controlling for relevant labour-market characteristics of individuals. Some studies show reductions in the relative disadvantage of immigrants as they spend longer in their host countries (Chiswick, Lee and Miller, 2005). Other studies show persistence in disadvantages (Borjas, 1985).
Other aspects of the experience of immigrants in their host country labour markets have generally received less attention. In this paper, we aim to contribute to addressing this by conducting an analysis of the extent to which immigrants receive employer-provided training, relative to comparable natives. Given the importance of such training in facilitating immigrants to fully integrate into host country labour markets, any findings of lower access to training for immigrants would have important implications. For example, it could be that a persistence of any initial earnings disadvantage for immigrants could be related in part to a failure to benefit from employer-provided training.
Section 2: Literature
O’Connell and Junglut (2008) in their review of the international literature, argue that participation in training at work is highly stratified. Those with higher skills or educational attainment are more likely to participate in training, including employer-provided training. Larger firms and those that pay higher wages are also more likely to train their employees. Part-time workers, those on temporary contracts and older workers are less likely to receive training. O’Connell and Jungblut thus argue that those with the greatest need for training tend to receive less of it, presumably to their long-run disadvantage.
The dominant theoretical framework informing most research on training has been the human capital approach. This approach, deriving from Becker (1975), assumes that individual workers undertake training, and employers invest in training, on the basis of their estimates of future returns (including employment prospects, wages and productivity gains). The human capital approach emphasises the distinction between “general” training – of use to both current and future employers – and “specific” training, linked closely to the current job and of use only to the current employer. In this approach it is expected that employers will not pay for general training, because they cannot recoup the cost – other employers would be free to “poach” trained employees and reap the benefits of enhanced productivity. If, as a result of this market failure, employees have to pay the full cost of general training – whether directly or through reduced wages – it is likely that there will be under-investment in training.
market regulation (e.g. Acemoglu and Pischke, 1999). Booth, Francesconi and Zoega (2003) show that unions can have a positive or negative impact on training depending on union strategy and the manner in which unions negotiate on training and wages.
For most workers in advanced industrial societies the employment contract entails an ongoing and relatively long-term relationship that may differ in important respects from the competitive labour market assumed in the Becker model (Barrett and O’Connell, 2001). This turns our attention to the demand side of the labour market and to the social organisation of work. The segmented labour market approach focuses more on the characteristics of jobs rather than individuals and argues that different labour market sectors impose structural limitations both on the returns to education and experience and on the career prospects of workers (Doeringer and Piore, 1971; Gordon, Edwards and Reich, 1982). At their simplest, labour market segments can be dichotomised, with the primary market consisting of well paid and secure employment as opposed to jobs in the secondary market which are poorly paid and are of a precarious nature with few or no prospects for upward mobility. From this perspective, workers in the secondary labour market are less likely to participate in job-related training, and the returns to such training are lower. Workers in the primary segment(s) are more likely to receive training, the returns are higher, and such training is likely to be associated with upward mobility, perhaps in an internal labour market.
If we are thinking in terms of segmented labour market theories (Doeringer and Piore, 1971), then predictions become more clear-cut. Under this theory, secondary labour markets are characterised by jobs which offer lower wages, fewer fringe benefits and poorer working conditions, including a lower incidence of training. If such secondary markets exist and if immigrants are more heavily concentrated in them, then immigrants will be less likely t be in receipt of training.
The empirical literature on the question of the relative receipt of employer-provided training across immigrants and natvies is thin, but three papers from Australia (Miller, 1994; Kennedy et al, 1994; Van den Heuvel and Wooden, 1997) point firmly in the direction of immigrants being less likely to receive training. This is especially true for immigrant groups with different linguistic backgrounds to the native population. Taking Van den Heuvel and Wooden (1997) as an example, they explore the issue using Australian data from 1993. By estimating logit regressions of training receipt, they show how immigrants in Australia from non-English speaking countries have lower incidences of training and that the gap relative to natives is more pronounced among immigrants from these countries who also report having weak English language skills.
Section 3: The Data
The data used in this study comes from Ireland’s National Employment Survey (NES) from March 2006. The 2006 NES is a workplace survey, covering both the public and private sectors, which was conducted by Ireland’s official statistical office, Central Statistics Office (CSO)2. The information contained in the NES was collected from a matched employee-employer survey. The employer sample was drawn using the CSO Central Business Register (CBR). Selected firms were asked to draw a systematic sample of employees from their payroll. Approximately 8,000 enterprises3 were contacted of which 4,845 responded resulting in employee information on 67,766 individuals. After the elimination of employees with information missing on some variables, part-time students and also the restriction of our sample to those of standard working age, the final sample for this study was just over 50,000 employees. When analysing the employee sample, cross-sectional weights were applied to ensure that the data was representative of the general population of employees in employment.
The employer questionnaire collected some limited information on firm size and sector that was incorporated into our models. Employees were issued with a separate survey within which they were asked to provide information on their age, gender, educational attainment, employment status (part-time or full-time), length of time in paid employment and also other job-related characteristics (for example, trade union membership, supervisory role, tenure with current employer).
Employees were also asked whether or not they had received employer-provided training during the course of the preceding year, 2005. They were asked a broad question about whether or not they had participated in any “company or company sponsored training courses in 2005”. They were also asked a more detailed question about types of training, such as training through participation in quality circles, job rotation etc. If an individual responded positively to any of the questions about participation in company training, we coded that person has having received
2 While the NES survey was of enterprises with 3 plus employees, the results were calibrated to the
Quarterly National Household Survey (QNHS) employment data for employees (excluding agriculture, forestry and fishing), which covers all employees.
3
employer-provided training. This is used as a binary dependent variable in the analysis below.
In terms of migration, each individual’s country of origin was coded in a very detailed way that allowed us to separate out migrants into UK, Pre-accession EU (other than UK), New Member States of the EU (hereafter referred to as NMS)4, non-EU/English speaking and non-EU/non English speaking. The fact that the survey was conducted in March 2006 but that the training questions related to the year 2005 generated a concern that many immigrants would not have received training because they were very recent arrivals. In order to account for this, we excluded people who had entered zero in their response to the question on tenure and so we are only looking at individuals, both natives and migrants, with at least one year of tenure with their current employer. This restriction also has the advantage of removing any confusion surrounding individuals who changed jobs in early 2006 and who have answered the questions on training in 2005 with reference to their new employer.
Section 4: Results
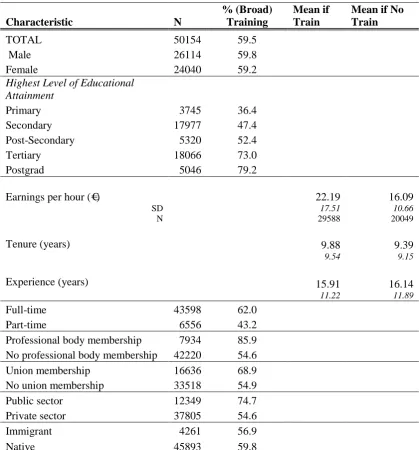
In Table 1, we present some descriptive statistics showing how the incidence of participation in employer-provided training varies across groups. Of our sample of 50,154 individuals, almost 60 percent report participation in employer-provided training in 2005. There is essentially no difference in the incidence by gender. However, the likelihood of receiving increases by level of education. It is also the case that the incidence of training is higher among fulltime employees relative to parttime employees, among members of professional bodies relative to non-members and among union members relative to non-union. The incidence of training is also higher in the public sector relative to the private sector.
According to the raw data, immigrants are less likely to be in receipt of training relative to natives although the difference is not large. However, there is obviously a need to look at this issue in a multivariate context so that we can distil whether or not this small difference persists when controlling for other characteristics. We know
4
from a series of papers that immigrants in Ireland are generally a highly educated group (see, for example, Barrett et al, 2006). For this reason, we might have expected them to have a higher incidence of training. In addition, we also know that immigrants from different regions have very different labour market experiences (Barrett and McCarthy, 2007). Hence, when undertaking multivariate analyses, we need to look across different immigrant groups as well as looking at immigrants as a whole.
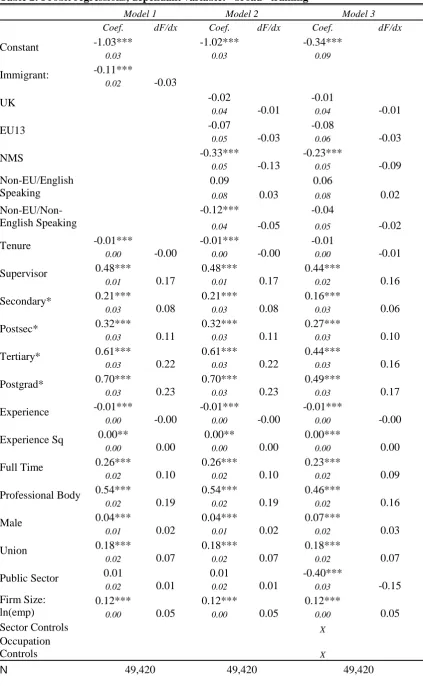
In Table 2, we report the results from probit regressions in which the dependent variable is equal to one in the individuals reports that they received some form of training in 2005 and zero if not. Before looking at the immigrant coefficients, we will briefly consider the other coefficients to see if the models are producing results that are generally consistent with what would be expected.
Looking at Model 1 in Table 2, we can see that the pattern of results is essentially what would be expected based on the existing literature. Tenure and experience have a negative impact on training receipt; this is consistent with a human capital view which would see reduced pay-off periods as lowering the potential value of additional training. Full-time employees, members of professional bodies and union members are all shown to have a greater likelihood of receiving training. Similarly, employees in larger companies are also more likely to receive training.
Turning to the coefficient on the immigrant dummy, we see that it is negative and significant. In terms of a marginal impact, immigrants are 3 percent less likely to receive employer-provided training. While this result is interesting to a degree, earlier research on immigrants in Ireland has shown that the labour markets outcomes for different immigrant groups vary considerably5. For this reason, it is important to look separately at the different groups and we do this in Model 2. Once we do this we see the different outcomes emerging. The only coefficient that is significant across the five immigrant categories is that of the NMS countries. In addition, the marginal impact for this group, at 13 percent, is substantially higher than that estimated of immigrants as a whole. Of the other groups of immigrants, only those from non-EU/non-English-speaking countries appear to experience a lower incidence of
5
employer-provided training relative to native workers. In Model 3, we add controls for occupation and sector to explore the possibility that our observations arise from a concentration of NMS immigrants in low-training occupations and sectors. While both the estimated coefficient and marginal impact for NMS immigrants fall when these controls are added, we are still observing a significant gap between natives and NMS immigrants in terms of receipt of employer-provided training. In the case of immigrants from non-EU/non-English speaking countries, the estimated coefficient is no longer significant in Model 3.
Barrett et al (2008) demonstrate that observed wage impacts adjust significantly when account is taken of sample selection bias. Thus it seems, at least in respect to wages, some immigrant groupings are not randomly distributed in terms of their personal characteristics and, when account is taken of this, the observed immigrant wage penalty increases significantly. In the same vain, if it proves to be the case that immigrants possess characteristics that result in higher ex ante training probabilities, then failure to adjust for these influences will lead to some under-estimation of the immigrant training disadvantage.
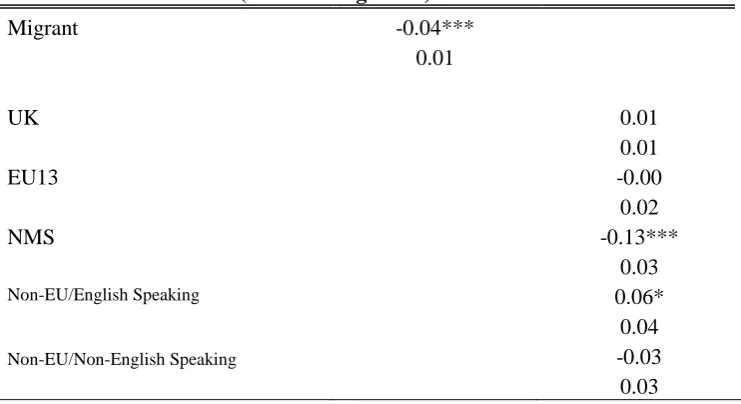
Here, we account for selection effects by estimating matching models whereby the principal characteristics of immigrants are initially identified through a probit model. Immigrants are then matched on the basis of their predicted probabilities, or propensity scores, with natives holding similar characteristics and the training incidences of the two groups are then compared. In terms of the matching technique adopted, we apply Nearest Neighbour with replacement.
With respect to their dominant characteristics, immigrants were found to possess lower levels of tenure and labour market experience, more likely to hold post-secondary or post-graduate qualifications and were less likely to work in the public sector or be members of professional bodies or trade unions. Post matching analysis revealed that we were able to successfully match natives and immigrants on all key characteristics6.
The estimates generated by the matching process are presented in Table 3. While some differences are apparent, most notably, no significant impact was found for non-EU / non-English speaking migrants. Generally speaking the results align well with those in Table 3 suggesting that selection bias is not an important factor in this regard.
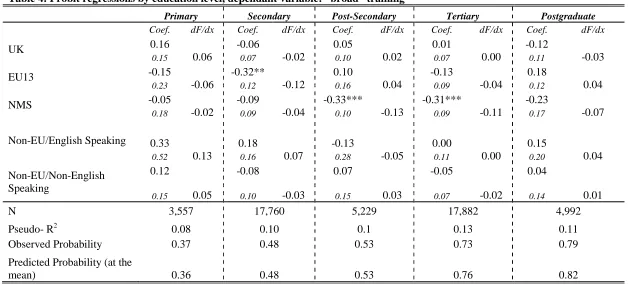
Barrett et al (2008) have shown how the wage disadvantage experienced by immigrants from the NMS countries in Ireland is not uniform across educational categories or across occupations. Instead, no disadvantage is present for immigrants with low levels of skills, as indicated by occupations and education levels, and is highest for those with higher levels of skill. Given this, it is of interest to explore whether the disadvantage in training for immigrants is similarly correlated with education and occupation.
In Table 4, we present the coefficients on immigrant dummy variables from regressions run within educational categories. The models are equivalent to Model 3 of Table 2, although with the education categories dropped. As can be seen, the training disadvantage is quite concentrated when viewed in this way, both in terms of nationalities and in terms of educational groups. Of the 25 nationality/education cells in Table 4, only three contain significant coefficients. Two of these relate to NMS immigrants. It appears that the training disadvantage is not present at either the lower and or highest ends of the education distribution but instead is concentrated around immigrants with post-secondary educations and primary degrees.
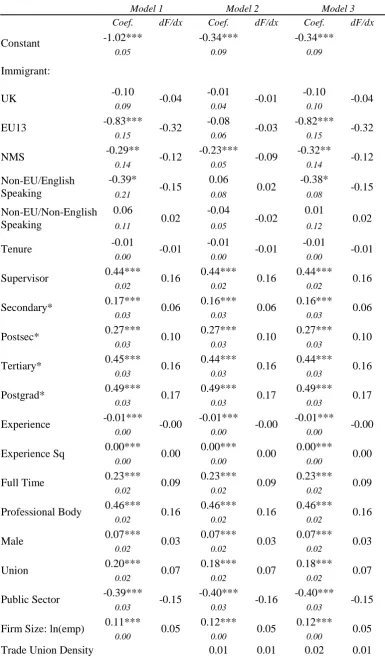
We expand the analysis further in Tables 6, 7 and 8. In Table 6, Model 1, we include two sets of interactions between (a) the immigrant dummy variables and firm size and (b) the immigrant dummy variables and whether the immigrant is a union member. Before looking at the coefficients on the interactions, it should be noted that their inclusion has an impact on a number of the immigrant dummy coefficients. In Table 2 Model 3, only the immigrants from the NMS were found to experience a training disadvantage. However, in Table 6 Model 1, we now see that immigrants from the EU-13 and from non-EU-English-speaking countries also experience the disadvantage. In the case of both, we find significant interaction effects. Immigrants from both categories who work in large firms have higher likelihoods of receiving training relative to the base. It is possible that this positive effect arises from US and EU-13 nationals working in multinationals in Ireland. In contrast, there appears to be a penalty to union membership for these immigrants. In the case of the NMS immigrants, the inclusion of the interactions has no effect on the immigrant dummy coefficient and neither of the interaction terms is significant.
In model 2 and 3 of Table 6, we introduce a union-density variable which is a dummy variable equal to one if 50 percent of more of the employees in the firm are union members and zero otherwise. The inclusion of this variable is intended to capture the possible effect that a strong union presence in a firm might have on training provision generally and on immigrant in particular. As can be seen, the inclusion of this variable has little impact. The one exception to this is with regard to the interaction between immigrants from non-EU/non-English countries and the union density variable. This interaction term suggests a large and negative effect. One possible explanation would be the fact that the health service is both heavily unionised and a large employer of nationalities such as Filipinos (nurses) and Indians (doctors)7.
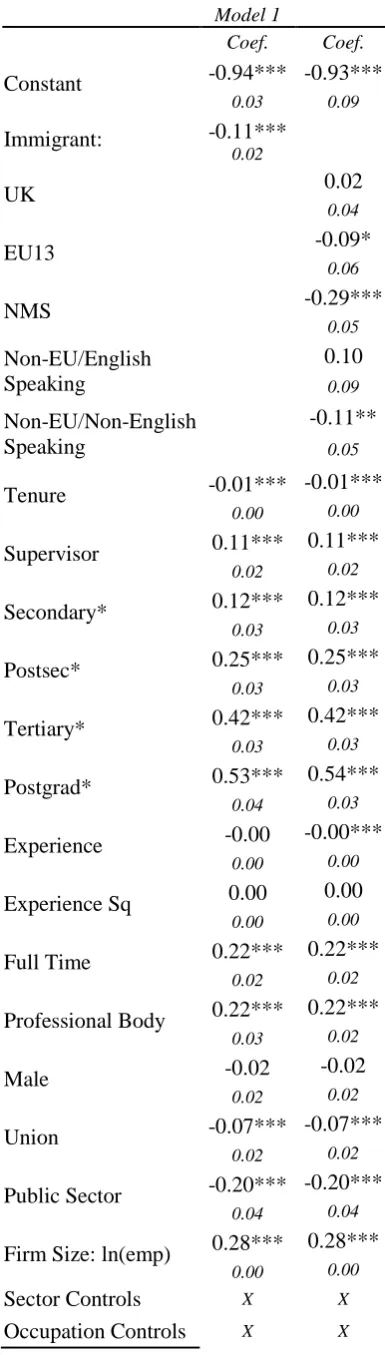
As a final extension of the analysis, we address the following questions: to what extent are immigrants less likely to be employed in training intensive firms and, secondly, are immigrants employed in training intensive firms less likely to receive employer-provided training than natives? We define a training intensive firm as one
7
where 50 per cent or more employees received training in 2005. We then regress worker characteristics on this variable in order to identify those factors that most heavily influence an individual’s likelihood of being employed in a training intensive firm, the results are presented in table 7. The models are well specified and indicate that an individuals probability of being employed in a training intensive firm increases with education with the results suggest that training intensive firms tend to be larger and have lower levels of trade-union density. Critically our models indicates that immigrants are indeed less likely to be employed in training intensive organisations with the disadvantage specific to immigrants from new member states and non-EU non English speaking countries.
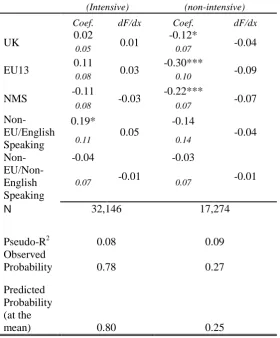
In order to test the second hypothesis, we divide our sample of employees into two groups; those working training intensive firms and the rest. We then rerun the probit training regressions within each group. The results are shown in Table 8, with only the immigrant dummy coefficients presented. A number of striking results emerge. First, there is no training disadvantage for immigrants relative to natives if they are employed in training intensive firms. Indeed, in the case of immigrants from non-EU/English speaking countries there is actually a greater likelihood of training. In contrast, the training disadvantage of immigrants is apparent in the firms that are less intensive trainers. As with earlier tables, we see again the disadvantage experienced by immigrants from both the EU-13 and the NMS. However, these groups are now joined by immigrants from the UK.
Section 5: Conclusions
training intensive and non-intensive firms, not only were immigrants from NMS less likely to be employed in a training intensive firms, a further training disadvantage was experienced by this group employed in non-training intensive firms.
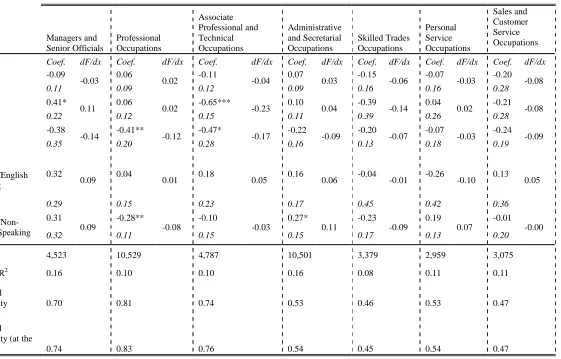
For other immigrants, a more mixed picture emerges with training disadvantages arising for very specific sub-groups. For example, immigrants from non-EU/English speaking countries working as process, plant and machine operatives were shown to be 26 percent less likely to receive training when compared to natives in the same occupations. Immigrants from the EU-13 were found to be 32 percent less likely to receive training relative to natives, once interactions were controlled for which picked up the effect of EU-13 immigrant working in large firms.
Tables
Table 1: Raw Probabilities
Characteristic N
% (Broad) Training
Mean if Train
Mean if No Train
TOTAL 50154 59.5
Male 26114 59.8
Female 24040 59.2
Highest Level of Educational Attainment
Primary 3745 36.4
Secondary 17977 47.4
Post-Secondary 5320 52.4
Tertiary 18066 73.0
Postgrad 5046 79.2
Earnings per hour (€)
SD N
22.19 17.51
29588
16.09 10.66
20049
Tenure (years) 9.88
9.54
9.39 9.15
Experience (years)
15.91 11.22
16.14 11.89
Full-time 43598 62.0
Part-time 6556 43.2
Professional body membership 7934 85.9
No professional body membership 42220 54.6
Union membership 16636 68.9
No union membership 33518 54.9
Public sector 12349 74.7
Private sector 37805 54.6
Immigrant 4261 56.9
Table 2: Probit regressions, dependant variable: “broad” training
Model 1 Model 2 Model 3
Coef. dF/dx Coef. dF/dx Coef. dF/dx
Constant -1.03*** -1.02*** -0.34***
0.03 0.03 0.09
Immigrant: -0.11***
-0.03 0.02
UK -0.02
-0.01
-0.01
-0.01
0.04 0.04
EU13 -0.07
-0.03
-0.08
-0.03
0.05 0.06
NMS -0.33***
-0.13
-0.23***
-0.09
0.05 0.05
Non-EU/English Speaking 0.09 0.03 0.06 0.02
0.08 0.08
Non-EU/Non-English Speaking -0.12*** -0.05 -0.04 -0.02
0.04 0.05
Tenure -0.01***
-0.00
-0.01***
-0.00
-0.01
-0.01
0.00 0.00 0.00
Supervisor 0.48***
0.17
0.48***
0.17
0.44***
0.16
0.01 0.01 0.02
Secondary* 0.21***
0.08
0.21***
0.08
0.16***
0.06
0.03 0.03 0.03
Postsec* 0.32***
0.11
0.32***
0.11
0.27***
0.10
0.03 0.03 0.03
Tertiary* 0.61***
0.22
0.61***
0.22
0.44***
0.16
0.03 0.03 0.03
Postgrad* 0.70***
0.23
0.70***
0.23
0.49***
0.17
0.03 0.03 0.03
Experience -0.01***
-0.00
-0.01***
-0.00
-0.01***
-0.00
0.00 0.00 0.00
Experience Sq 0.00**
0.00
0.00**
0.00
0.00***
0.00
0.00 0.00 0.00
Full Time 0.26***
0.10
0.26***
0.10
0.23***
0.09
0.02 0.02 0.02
Professional Body 0.54***
0.19
0.54***
0.19
0.46***
0.16
0.02 0.02 0.02
Male 0.04***
0.02
0.04***
0.02
0.07***
0.03
0.01 0.01 0.02
Union 0.18***
0.07
0.18***
0.07
0.18***
0.07
0.02 0.02 0.02
Public Sector 0.01
0.01
0.01
0.01
-0.40***
-0.15
0.02 0.02 0.03
Firm Size: ln(emp) 0.12*** 0.05 0.12*** 0.05 0.12*** 0.05
0.00 0.00 0.00
Sector Controls X
Occupation
Controls X
Pseudo-R2 0.14 0.14 0.16 Observed
Probability 0.60 0.60 0.60
Predicted
Probability (at the
mean) 0.62 0.62 0.62
Table 3: PSM Estimates (Nearest Neighbour)
Migrant -0.04***
0.01
UK 0.01
0.01
EU13 -0.00
0.02
NMS -0.13***
0.03
Non-EU/English Speaking 0.06*
0.04
Non-EU/Non-English Speaking -0.03
Table 4: Probit regressions by education level, dependant variable: “broad” training
Primary Secondary Post-Secondary Tertiary Postgraduate
Coef. dF/dx Coef. dF/dx Coef. dF/dx Coef. dF/dx Coef. dF/dx
UK 0.16
0.06 -0.06 -0.02 0.05 0.02 0.01 0.00 -0.12 -0.03
0.15 0.07 0.10 0.07 0.11
EU13 -0.15
-0.06 -0.32** -0.12 0.10 0.04 -0.13 -0.04 0.18 0.04
0.23 0.12 0.16 0.09 0.12
NMS -0.05
-0.02 -0.09 -0.04 -0.33*** -0.13 -0.31*** -0.11 -0.23 -0.07
0.18 0.09 0.10 0.09 0.17
Non-EU/English Speaking 0.33
0.13 0.18 0.07 -0.13 -0.05 0.00 0.00 0.15 0.04
0.52 0.16 0.28 0.11 0.20
Non-EU/Non-English Speaking 0.12 0.05 -0.08 -0.03 0.07 0.03 -0.05 -0.02 0.04 0.01
0.15 0.10 0.15 0.07 0.14
N 3,557 17,760 5,229 17,882 4,992
Pseudo- R2 0.08 0.10 0.1 0.13 0.11
Observed Probability 0.37 0.48 0.53 0.73 0.79
Predicted Probability (at the
Table 5: Probit regressions by occupation level, dependant variable: “broad” training UKSOC Managers and Senior Officials Professional Occupations Associate Professional and Technical Occupations Administrative and Secretarial Occupations Skilled Trades Occupations Personal Service Occupations Sales and Customer Service Occupations
Coef. dF/dx Coef. dF/dx Coef. dF/dx Coef. dF/dx Coef. dF/dx Coef. dF/dx Coef. dF/dx
UK -0.09 -0.03 0.06 0.02 -0.11 -0.04 0.07 0.03 -0.15 -0.06 -0.07 -0.03 -0.20 -0.08
0.11 0.09 0.12 0.09 0.16 0.16 0.28
EU13 0.41* 0.11 0.06 0.02 -0.65*** -0.23 0.10 0.04 -0.39 -0.14 0.04 0.02 -0.21 -0.08
0.22 0.12 0.15 0.11 0.39 0.26 0.28
NMS -0.38 -0.14 -0.41** -0.12 -0.47* -0.17 -0.22 -0.09 -0.20 -0.07 -0.07 -0.03 -0.24 -0.09
0.35 0.20 0.28 0.16 0.13 0.18 0.19
Non-EU/English Speaking
0.32
0.09 0.04 0.01 0.18 0.05 0.16 0.06 -0.04 -0.01 -0.26 -0.10 0.13 0.05
0.29 0.15 0.23 0.17 0.45 0.42 0.36
Non-EU/Non-English Speaking 0.31 0.09 -0.28** -0.08 -0.10 -0.03 0.27* 0.11 -0.23 -0.09 0.19 0.07 -0.01 -0.00
0.32 0.11 0.15 0.15 0.17 0.13 0.20
N 4,523 10,529 4,787 10,501 3,379 2,959 3,075
Pseudo- R2 0.16 0.10 0.10 0.16 0.08 0.11 0.11
Observed
Probability 0.70 0.81 0.74 0.53 0.46 0.53 0.47
Predicted Probability (at the
mean) 0.74 0.83 0.76 0.54 0.45 0.54 0.47
Process, Plant and Machine Operatives Elementary Occupations
Coef. dF/dx Coef. dF/dx
0.01
0.00 0.03 0.01
0.11 0.11
-0.47**
-0.18 -0.06 -0.02
0.21 0.16
-0.07
-0.03 -0.29*** -0.11
0.11 0.09
-0.75**
-0.26 0.04 0.02
0.34 0.25
-0.40***
-0.15
-0.04
-0.01
0.15 0.09
4,719 4,940
0.09 0.08
0.46 0.43
Table 6: Probit regressions with interactions, dependant variable: “broad” training
Model 1 Model 2 Model 3
Coef. dF/dx Coef. dF/dx Coef. dF/dx
Constant -1.02*** -0.34*** -0.34***
0.05 0.09 0.09
Immigrant:
UK -0.10 -0.04 -0.01 -0.01 -0.10 -0.04
0.09 0.04 0.10
EU13 -0.83*** -0.32 -0.08 -0.03 -0.82*** -0.32
0.15 0.06 0.15
NMS -0.29** -0.12 -0.23*** -0.09 -0.32** -0.12
0.14 0.05 0.14
Non-EU/English Speaking
-0.39*
-0.15 0.06 0.02 -0.38* -0.15
0.21 0.08 0.08
Non-EU/Non-English Speaking
0.06
0.02 -0.04 -0.02 0.01 0.02
0.11 0.05 0.12
Tenure -0.01 -0.01 -0.01 -0.01 -0.01 -0.01
0.00 0.00 0.00
Supervisor 0.44*** 0.16 0.44*** 0.16 0.44*** 0.16
0.02 0.02 0.02
Secondary* 0.17*** 0.06 0.16*** 0.06 0.16*** 0.06
0.03 0.03 0.03
Postsec* 0.27*** 0.10 0.27*** 0.10 0.27*** 0.10
0.03 0.03 0.03
Tertiary* 0.45*** 0.16 0.44*** 0.16 0.44*** 0.16
0.03 0.03 0.03
Postgrad* 0.49*** 0.17 0.49*** 0.17 0.49*** 0.17
0.03 0.03 0.03
Experience -0.01*** -0.00 -0.01*** -0.00 -0.01*** -0.00
0.00 0.00 0.00
Experience Sq 0.00*** 0.00 0.00*** 0.00 0.00*** 0.00
0.00 0.00 0.00
Full Time 0.23*** 0.09 0.23*** 0.09 0.23*** 0.09
0.02 0.02 0.02
Professional Body 0.46*** 0.16 0.46*** 0.16 0.46*** 0.16
0.02 0.02 0.02
Male 0.07*** 0.03 0.07*** 0.03 0.07*** 0.03
0.02 0.02 0.02
Union 0.20*** 0.07 0.18*** 0.07 0.18*** 0.07
0.02 0.02 0.02
Public Sector -0.39*** -0.15 -0.40*** -0.16 -0.40*** -0.15
0.03 0.03 0.03
Firm Size: ln(emp) 0.11*** 0.05 0.12*** 0.05 0.12*** 0.05
0.00 0.00 0.00
0.02 0.02 INTERACTIONS
UK*Firm size -0.02 -0.01 0.02 0.01
0.02 0.02
EU13*Firm size 0.18*** 0.07 0.17*** 0.07
0.03 0.03
NMS*Firm size 0.02 0.01 0.03 0.01
0.03 0.03
Non-EU/English Speaking*Firm size
0.12**
0.04 0.10** 0.04
0.05 0.05
Non-EU/Non-English Speaking*Firm size
-0.01
-0.00 0.00 0.00
0.03 0.03
UK*TU member -0.00 0.00 0.10
EU13*TU member -0.47*** -0.18 0.18
NMS*TU member 0.06 0.02 0.18
Non-EU/English Speaking*TU member
-0.41**
-0.16 0.21
Non-EU/Non-English
Speaking*TU member -0.20
UK*TU density 0.01 0.01
0.10
EU13*TU density -0.21 -0.08
0.17
NMS*TU density -0.13 -0.05
0.18
Non-EU/English Speaking*TU density
-0.18
-0.07 0.21
Non-EU/Non-English Speaking*TU density
-0.36**
-0.14 0.14
Sector Controls X X X
Occupation Controls X X X
N 49,420 49,420 49,420
Pseudo-R2 0.16 0.16 0.16
Observed Probability 0.60 0.60 0.60
Predicted Probability
Table 7: Probit for employment in training intensive firms
Model 1
Coef. Coef.
Constant -0.94*** -0.93*** 0.03 0.09
Immigrant: -0.11***
0.02
UK 0.02
0.04
EU13 -0.09*
0.06
NMS -0.29***
0.05 Non-EU/English
Speaking
0.10 0.09
Non-EU/Non-English Speaking
-0.11**
0.05
Tenure -0.01*** -0.01***
0.00 0.00
Supervisor 0.11*** 0.11*** 0.02 0.02
Secondary* 0.12*** 0.12*** 0.03 0.03
Postsec* 0.25*** 0.25*** 0.03 0.03
Tertiary* 0.42*** 0.42*** 0.03 0.03
Postgrad* 0.53*** 0.54*** 0.04 0.03
Experience -0.00 -0.00*** 0.00 0.00
Experience Sq 0.00 0.00 0.00 0.00
Full Time 0.22*** 0.22*** 0.02 0.02
Professional Body 0.22*** 0.22*** 0.03 0.02
Male -0.02 -0.02
0.02 0.02
Union -0.07*** -0.07***
0.02 0.02
Public Sector -0.20*** -0.20*** 0.04 0.04
Firm Size: ln(emp) 0.28*** 0.28*** 0.00 0.00
Sector Controls X X
N 49420 49420
Table 8: Probit regressions for employees in training intensive and non-intensive firms, dependant variable: “broad” training
(Intensive) (non-intensive)
Coef. dF/dx Coef. dF/dx
UK 0.02 0.01 -0.12* -0.04
0.05 0.07
EU13 0.11 0.03 -0.30*** -0.09
0.08 0.10
NMS -0.11 -0.03 -0.22*** -0.07
0.08 0.07
Non-EU/English Speaking
0.19*
0.05
-0.14
-0.04
0.11 0.14
Non- EU/Non-English Speaking
-0.04
-0.01
-0.03
-0.01
0.07 0.07
N 32,146 17,274
Pseudo-R2 0.08 0.09
Observed
Probability 0.78 0.27
Predicted Probability (at the
mean) 0.80 0.25
References
Acemoglu D. and Pischke, J-S. (1999) “Beyond Becker: Training in Imperfect Labour Markets.” The Economic Journal, 109, F112-142.
Barrett, A. and D. Duffy, (2008), “Are Ireland’s Immigrants Integrating into its Labour Market?”, International Migration Review Vol. 42 No. 3
Barrett, A. and Y. McCarthy (2007), “Immigrants in a Booming Economy: Analysing their Earnings and Welfare Dependence”, Labour: Review of Labour Economics and Industrial Relations Vol. 21 No. 4-5
Barrett, Alan, Séamus McGuinness and Martin O’Brien (2008) “The Immigrant Earnings Disadvantage across the Earnings and Skills Distributions: The Case of Immigrants from the EU’s New Member States in Ireland”, IZA Discussion Paper No. 3479
Becker, Gary S. (1964), Human Capital: A Theoretical and Empirical Analysis, with special Reference to Education, New York: National Bureau of Economic Research
Booth, A., Francesconi, M., and Zoega, G., (2003), “Unions, Work-related Training and Wages: Evidence for British Men.” Industrial and Labour Relations Review, Vol. 57, No. 1, Pp. 68-91.
Borjas, George J. (1985), “Integration, Changes in Cohort Quality and the Earnings of Immigrants”, Journal of Labor Economics Vol. 3 pp. 463-489
Chiswick, Barry R. (1978), “The Effect of Americanisation on the Earnings of Foreign-born Men”, Journal of Political Economy Vol. 86 pp. 897-921
Chiswick, Barry R., Yew Liang Lee and Paul Miller (2005), “Longitudinal Analysis of Immigrant Occupational Mobility: A Test of the Immigrant Integration Hypothesis”, International Migration Review Vol. 39 pp. 332-353
Doeringer, Peter B. and Michael J. Piore (1971), Internal Labor Markets and Manpower, Lexington, MA: Lexington Books
Gordon, D., Edwards, R., and Reich, M., (1982) Segmented Work, Divided Workers: The Historical Transformation of Labour in the United States. Cambridge, UK: Cambridge University Press.
Hum, Derek and Wayne Simpson (2003), “Job-related Training Activity by Immigrants to Canada”, Canadian Public Policy Vol. 29 No. 4 pp 469-490
Miller, Paul W. (1994), “Gender discrimination in Training: An Australian Perspective”, British Journal of Industrial Relations Vol. 32 No. 4 pp 539-564
Mincer, Jacob (1974), Schooling, Experience, and Earnings, New York: National Bureau of Economic Research
O’Connell, P., and Junblut, J-M., (2008), “What do we Know about Training at Work?” in K.U. Mayer and H. Solga, (eds) Skill Formation: Interdisciplinary and Cross-National Perspectives. Cambridge, UK: Cambridge University Press.
Year Number Title/Author(s) ESRI Authors/Co-authors Italicised
2009
312 Did the Celtic Tiger Decrease Socio-Economic
Differentials in Perinatal Mortality in Ireland?
Richard Layte and Barbara Clyne
311 Exploring International Differences in Rates of Return to
Education: Evidence from EU SILC
Maria A. Davia, Seamus McGuinness and Philip, J.
O’Connell
310 Car Ownership and Mode of Transport to Work in
Ireland
Nicola Commins and Anne Nolan
309 Recent Trends in the Caesarean Section Rate in Ireland
1999-2006
Aoife Brick and Richard Layte
308 Price Inflation and Income Distribution
Anne Jennings, Seán Lyons and Richard S.J. Tol
307 Overskilling Dynamics and Education Pathways
Kostas Mavromaras,Seamus McGuinness,Yin King Fok
306 What Determines the Attractiveness of the European
Union to the Location of R&D Multinational Firms? Iulia Siedschlag, Donal Smith, Camelia Turcu, Xiaoheng Zhang
305 Do Foreign Mergers and Acquisitions Boost Firm
Productivity?
Marc Schiffbauer, Iulia Siedschlag, Frances Ruane
304 Inclusion or Diversion in Higher Education in the
Republic of Ireland? Delma Byrne
303 Welfare Regime and Social Class Variation in Poverty
and Economic Vulnerability in Europe: An Analysis of EU-SILC
Christopher T. Whelan and Bertrand Maître
302 Understanding the Socio-Economic Distribution and
Consequences of Patterns of Multiple Deprivation: An Application of Self-Organising Maps
Christopher T. Whelan, Mario Lucchini, Maurizio Pisati
301 Estimating the Impact of Metro North Edgar Morgenroth
300 Explaining Structural Change in Cardiovascular Mortality
in Ireland 1995-2005: A Time Series Analysis
Richard Layte, Sinead O’Hara and Kathleen Bennett
299 EU Climate Change Policy 2013-2020: Using the Clean
Development Mechanism More Effectively
Paul K Gorecki, Seán Lyons and Richard S.J. Tol
298 Irish Public Capital Spending in a Recession
Edgar Morgenroth
297 Exporting and Ownership Contributions to Irish
Manufacturing Productivity Growth
Anne Marie Gleeson, Frances Ruane
296 Eligibility for Free Primary Care and Avoidable
Hospitalisations in Ireland Anne Nolan
295 Managing Household Waste in Ireland:
Behavioural Parameters and Policy Options
John Curtis, Seán Lyons and Abigail O’Callaghan-Platt
294 Labour Market Mismatch Among UK Graduates;
An Analysis Using REFLEX Data
Seamus McGuinness and Peter J. Sloane
293 Towards Regional Environmental Accounts for Ireland
Richard S.J. Tol , Nicola Commins, Niamh Crilly, Sean
Lyons and Edgar Morgenroth
292 EU Climate Change Policy 2013-2020: Thoughts on
Property Rights and Market Choices
Paul K. Gorecki, Sean Lyons and Richard S.J. Tol
291 Measuring House Price Change
David Duffy
290 Intra-and Extra-Union Flexibility in Meeting the
European Union’s Emission Reduction Targets Richard S.J. Tol
289 The Determinants and Effects of Training at Work:
Bringing the Workplace Back In
Philip J. O’Connell and Delma Byrne
Economics of Climate Policy: An Application of FUND Richard S.J. Tol
287 The Behaviour of the Irish Economy: Insights from the
HERMES macro-economic model
Adele Bergin, Thomas Conefrey, John FitzGerald and
Ide Kearney
286 Mapping Patterns of Multiple Deprivation Using
Self-Organising Maps: An Application to EU-SILC Data for Ireland
Maurizio Pisati, Christopher T. Whelan, Mario Lucchini
and Bertrand Maître
285 The Feasibility of Low Concentration Targets:
An Application of FUND Richard S.J. Tol
284 Policy Options to Reduce Ireland’s GHG Emissions
Instrument choice: the pros and cons of alternative policy instruments
Thomas Legge and Sue Scott
283 Accounting for Taste: An Examination of Socioeconomic
Gradients in Attendance at Arts Events
Pete Lunn and Elish Kelly
282 The Economic Impact of Ocean Acidification on Coral
Reefs
Luke M. Brander, Katrin Rehdanz, Richard S.J. Tol, and
Pieter J.H. van Beukering
281 Assessing the impact of biodiversity on tourism flows:
A model for tourist behaviour and its policy implications Giulia Macagno, Maria Loureiro, Paulo A.L.D. Nunes and Richard S.J. Tol
280 Advertising to boost energy efficiency: the Power of One
campaign and natural gas consumption
Seán Diffney, Seán Lyons and Laura Malaguzzi Valeri
279 International Transmission of Business Cycles Between
Ireland and its Trading Partners
Jean Goggin and Iulia Siedschlag
278 Optimal Global Dynamic Carbon Taxation
David Anthoff
277 Energy Use and Appliance Ownership in Ireland
276 Discounting for Climate Change
David Anthoff, Richard S.J. Tol and Gary W. Yohe
275 Projecting the Future Numbers of Migrant Workers in
the Health and Social Care Sectors in Ireland
Alan Barrett and Anna Rust
274 Economic Costs of Extratropical Storms under Climate
Change: An application of FUND
Daiju Narita, Richard S.J. Tol, David Anthoff
273 The Macro-Economic Impact of Changing the Rate of
Corporation Tax
Thomas Conefrey and John D. Fitz Gerald
272 The Games We Used to Play
An Application of Survival Analysis to the Sporting Life-course
Pete Lunn 2008
271 Exploring the Economic Geography of Ireland
Edgar Morgenroth
270 Benchmarking, Social Partnership and Higher
Remuneration: Wage Settling Institutions and the Public-Private Sector Wage Gap in Ireland
Elish Kelly, Seamus McGuinness, Philip O’Connell
269 A Dynamic Analysis of Household Car Ownership in
Ireland Anne Nolan
268 The Determinants of Mode of Transport to Work in the
Greater Dublin Area
Nicola Commins and Anne Nolan
267 Resonances from Economic Development for Current
Economic Policymaking Frances Ruane
266 The Impact of Wage Bargaining Regime on Firm-Level
Competitiveness and Wage Inequality: The Case of Ireland
Seamus McGuinness, Elish Kelly and Philip O’Connell
265 Poverty in Ireland in Comparative European Perspective
Christopher T. Whelan and Bertrand Maître
264 A Hedonic Analysis of the Value of Rail Transport in the
Karen Mayor, Seán Lyons, David Duffy and Richard S.J. Tol
263 Comparing Poverty Indicators in an Enlarged EU
Christopher T. Whelan and Bertrand Maître
262 Fuel Poverty in Ireland: Extent,
Affected Groups and Policy Issues
Sue Scott, Seán Lyons, Claire Keane, Donal McCarthy
and Richard S.J. Tol
261 The Misperception of Inflation by Irish Consumers
David Duffy and Pete Lunn
260 The Direct Impact of Climate Change on Regional
Labour Productivity
Tord Kjellstrom, R Sari Kovats, Simon J. Lloyd, Tom
Holt, Richard S.J. Tol
259 Damage Costs of Climate Change through Intensification
of Tropical Cyclone Activities: An Application of FUND
Daiju Narita, Richard S. J. Tol and David Anthoff
258 Are Over-educated People Insiders or Outsiders?
A Case of Job Search Methods and Over-education in UK
Aleksander Kucel, Delma Byrne
257 Metrics for Aggregating the Climate Effect of Different
Emissions: A Unifying Framework
Richard S.J. Tol, Terje K. Berntsen, Brian C. O’Neill, Jan
S. Fuglestvedt, Keith P. Shine, Yves Balkanski and Laszlo Makra
256 Intra-Union Flexibility of Non-ETS Emission Reduction
Obligations in the European Union Richard S.J. Tol
255 The Economic Impact of Climate Change
Richard S.J. Tol
254 Measuring International Inequity Aversion
Richard S.J. Tol
253 Using a Census to Assess the Reliability of a National
Household Survey for Migration Research: The Case of Ireland
Alan Barrett and Elish Kelly
252 Risk Aversion, Time Preference, and the Social Cost of
Carbon
251 The Impact of a Carbon Tax on Economic Growth and Carbon Dioxide Emissions in Ireland
Thomas Conefrey, John D. Fitz Gerald, Laura Malaguzzi
Valeri and Richard S.J. Tol
250 The Distributional Implications of a Carbon Tax in
Ireland
Tim Callan, Sean Lyons, Susan Scott, Richard S.J. Tol and Stefano Verde
249 Measuring Material Deprivation in the Enlarged EU
Christopher T. Whelan, Brian Nolan and Bertrand Maître
248 Marginal Abatement Costs on Carbon-Dioxide Emissions:
A Meta-Analysis
Onno Kuik, Luke Brander and Richard S.J. Tol
247 Incorporating GHG Emission Costs in the Economic
Appraisal of Projects Supported by State Development Agencies
Richard S.J. Tol and Seán Lyons
246 A Carton Tax for Ireland
Richard S.J. Tol, Tim Callan, Thomas Conefrey, John D.
Fitz Gerald, Seán Lyons, Laura Malaguzzi Valeri and
Susan Scott
245 Non-cash Benefits and the Distribution of Economic
Welfare
Tim Callan and Claire Keane
244 Scenarios of Carbon Dioxide Emissions from Aviation
Karen Mayor and Richard S.J. Tol
243 The Effect of the Euro on Export Patterns: Empirical
Evidence from Industry Data
Gavin Murphy and Iulia Siedschlag
242 The Economic Returns to Field of Study and
Competencies Among Higher Education Graduates in Ireland
Elish Kelly, Philip O’Connell and Emer Smyth
241 European Climate Policy and Aviation Emissions
Karen Mayor and Richard S.J. Tol
240 Aviation and the Environment in the Context of the
EU-US Open Skies Agreement
Karen Mayor and Richard S.J. Tol
239 Yuppie Kvetch? Work-life Conflict and Social Class in
Frances McGinnity and Emma Calvert
238 Immigrants and Welfare Programmes: Exploring the
Interactions between Immigrant Characteristics, Immigrant Welfare Dependence and Welfare Policy
Alan Barrett and Yvonne McCarthy
237 How Local is Hospital Treatment? An Exploratory
Analysis of Public/Private Variation in Location of Treatment in Irish Acute Public Hospitals
Jacqueline O’Reilly and Miriam M. Wiley
236 The Immigrant Earnings Disadvantage Across the
Earnings and Skills Distributions: The Case of
Immigrants from the EU’s New Member States in Ireland
Alan Barrett, Seamus McGuinness and Martin O’Brien
235 Europeanisation of Inequality and European Reference
Groups
Christopher T. Whelan and Bertrand Maître
234 Managing Capital Flows: Experiences from Central and
Eastern Europe
Jürgen von Hagen and Iulia Siedschlag
233 ICT Diffusion, Innovation Systems, Globalisation and
Regional Economic Dynamics: Theory and Empirical Evidence
Charlie Karlsson, Gunther Maier, Michaela Trippl, Iulia
Siedschlag, Robert Owen and Gavin Murphy
232 Welfare and Competition Effects of Electricity
Interconnection between Great Britain and Ireland Laura Malaguzzi Valeri
231 Is FDI into China Crowding Out the FDI into the
European Union?
Laura Resmini and Iulia Siedschlag
230 Estimating the Economic Cost of Disability in Ireland
John Cullinan, Brenda Gannon and Seán Lyons
229 Controlling the Cost of Controlling the Climate: The Irish
Government’s Climate Change Strategy
Colm McCarthy, Sue Scott
228 The Impact of Climate Change on the
Balanced-Growth-Equivalent: An Application of FUND
David Anthoff, Richard S.J. Tol
227 Changing Returns to Education During a Boom? The
Seamus McGuinness, Frances McGinnity, Philip O’Connell
226 ‘New’ and ‘Old’ Social Risks: Life Cycle and Social Class
Perspectives on Social Exclusion in Ireland
Christopher T. Whelan and Bertrand Maître
225 The Climate Preferences of Irish Tourists by Purpose of
Travel
Seán Lyons, Karen Mayor and Richard S.J. Tol
224 A Hirsch Measure for the Quality of Research
Supervision, and an Illustration with Trade Economists
Frances P. Ruane and Richard S.J. Tol
223 Environmental Accounts for the Republic of Ireland:
1990-2005
Seán Lyons, Karen Mayor and Richard S.J. Tol
2007 222 Assessing Vulnerability of Selected Sectors under Environmental Tax Reform: The issue of pricing power
J. Fitz Gerald, M. Keeney and S. Scott
221 Climate Policy Versus Development Aid
Richard S.J. Tol
220 Exports and Productivity – Comparable Evidence for 14
Countries
The International Study Group on Exports and Productivity
219 Energy-Using Appliances and Energy-Saving Features:
Determinants of Ownership in Ireland
Joe O’Doherty, Seán Lyons and Richard S.J. Tol
218 The Public/Private Mix in Irish Acute Public Hospitals:
Trends and Implications
Jacqueline O’Reilly and Miriam M. Wiley
217 Regret About the Timing of First Sexual Intercourse: The
Role of Age and Context
Richard Layte, Hannah McGee
216 Determinants of Water Connection Type and Ownership
of Water-Using Appliances in Ireland
Joe O’Doherty, Seán Lyons and Richard S.J. Tol
215 Unemployment – Stage or Stigma?
Being Unemployed During an Economic Boom Emer Smyth
214 The Value of Lost Load
213 Adolescents’ Educational Attainment and School Experiences in Contemporary Ireland
Merike Darmody, Selina McCoy, Emer Smyth
212 Acting Up or Opting Out? Truancy in Irish Secondary
Schools
Merike Darmody, Emer Smyth and Selina McCoy
211 Where do MNEs Expand Production: Location Choices of
the Pharmaceutical Industry in Europe after 1992
Frances P. Ruane, Xiaoheng Zhang
210 Holiday Destinations: Understanding the Travel Choices
of Irish Tourists
Seán Lyons, Karen Mayor and Richard S.J. Tol
209 The Effectiveness of Competition Policy and the
Price-Cost Margin: Evidence from Panel Data
Patrick McCloughan, Seán Lyons and William Batt
208 Tax Structure and Female Labour Market Participation:
Evidence from Ireland
Tim Callan, A. Van Soest, J.R. Walsh
207 Distributional Effects of Public Education Transfers in
Seven European Countries