Chapter 6 Prediction
John Woollard
In this chapter we will look at the ways in which you can use ICT in the classroom to support hypothesis and prediction and how modern technology is enabling: pattern seeking, extrapolation and
interpolation to meet the challenges of the information explosion of the 21st century.
We will attempt to answer the following questions:
1. how can we use pattern and prediction activities in the classroom? 2. how can pupils make sense and draw information from a mass of
data?
3. what capabilities do our pupils need to analyse and predict effectively?
4. what facilities does technology bring to summarising and communicating the patterns found in data?
5. how can we develop our pupils’ ability to predict through targeted activities based upon curriculum and subject specific models and simulations?
By reading the chapter you will be able to see the potential for using more activities requiring higher order thinking skills as a means of improving the pupils’ ability to predict. This chapter will also show how the ICT curriculum can be enriched through learning to think activities. By the end of the chapter you will be able to:
• understand what prediction means;
• use prediction to investigate topics within the classroom setting; • reflect on your own experiences of interpolation, extrapolation and
pattern seeking;
• become a “guide” for pupils (to develop their thinking skills, in particular those associated with analysis);
• help your pupils to become effective users of data.
Overview
Collecting large amounts of data and processing it rapidly are tasks that are well supported by the use of technology. Hypotheses and predictions can be developed quickly. The graph plotting capability of spreadsheets allows pupils to look for patterns without having to re-plot the data manually. Modelling solutions and producing
sophisticated simulations facilitates predictions. The technology is encouraging higher order thinking skills as pupils can progress into analysis of the data rather than being limited to the tedium of
Many studies have shown that teachers can affect the way in which their pupils' thinking develops. Philip Adey and Michael Shayer’s work shows how teaching can become more effective through constructivist and metacognitive strategies. Although based in science education their work has many implications for ICT teaching (Adey and Shayer, 1994). More recent studies have reported upon powerful pedagogic strategies. In particular, the work of David Leat and Steve Higgins has highlighted the value in exposing training teachers to teaching
thinking and the role of “powerful pedagogic strategies” (Leat, 1998). We will see how their use of “Mysteries” and “Living graphs” and the prediction activities can support learning in ICT.
Prediction links to the National Curriculum for England in several ways including “Developing ideas and making things happen” (2b,2c) and “Reviewing, modifying and evaluating work as it progresses (4c). At Key Stage 4 and post-16 education there are links to the testing aspects of the design cycle and then making proposals. A pupil proposal can be considered to prediction because the pupil is “predicting” that their proposal will be successful. Modelling and simulation, as well as monitoring and control, provide opportunities for prediction and the associated cognitive and strategic activities. Prediction relates to the selection of the correct ICT tool for the activity in hand and asking the right questions about a situation. There are elements of prediction relating to the implicit values, social, moral, ethical and political that relates to the use of ICT and the personal philosophy of the value of ICT. An important element of the advanced use of ICT relates to planning, team management and ensuring all eventualities are catered for in proposed solutions. Prediction also relates to probability and chance – the likelihood that something may happen and the skills of prediction relate to those of lateral thinking and the encouragement of pupils to be speculative and reflected in statements like “reading between the lines”, “seeing the wood for the trees” and “crystal ball gazing”.
Pattern seeking and predicting through lines and curves
In this section we will see how the computer can be used to create lines and curves to help interpret data, interpolate and extrapolate thus creating new data and speculate what future data may be. By structuring the learning environment we can ensure that the pupils consider what the probable results will be before testing and seeing. This will be illustrated by using graphing programs to develop
mathematical skills and monitoring (sensing) programs supporting ‘living graphs’.
Case Study Families of curves
of y = 4 x + 6 can be interpolated (lying between the second and third) and by extrapolation the shapes of y = 6 x + 6, y = 7 x + 6 can be predicted. The pupils can then be challenged “what do you think that y = 100 x + 6 looks like? and y = 0 x + 6? and y = -3 x + 6?
[image:3.595.95.507.94.403.2]Figure 6. 1 screen shot of an Excel
chart showing a family of curves
Figure 6. 2 screen shot of Autograph
showing prediction This same principle is then applied to more complex and challenging mathematical scenarios by mathematics colleagues. These include linear programming and breakeven point analysis of the GCE specifications. Your use of a relevant application of modelling will motivate the pupils and move them on from the more trivial simulation examples.
For you to do
Figure 6.1 was created using the Microsoft spreadsheet Excel. There are many graphing programs; some are suited to Key Stage 3 work and others to more advanced mathematical representations.
1 Choose a graphing program or use the charting facilities of a spreadsheet to create images of curve families to stimulate
discussion and prediction questions “what do you think…” before giving pupils access to the programs to check their hypotheses.
2 Read about ‘powerful pedagogic strategies’. Either search the internet or look up this readable account by David Leat and Steve Higgins http://www.lu.hiof.no/tt-nor/David-paper1.doc They describe six characteristics of “powerful pedagogic strategies”. In what way do you consider using a charting program a good
pedagogic method? Which of the following apply to this particular activity?
Powerful pedagogic strategies represent a manageable unit of change.
Powerful pedagogic strategies tasks have no single correct solution.
Powerful pedagogic strategies juxtapose the known with the new.
Powerful pedagogic strategies encourage talk.
Powerful pedagogic strategies are cross-subject
Resources
Autograph is a really useful program with a range of “screen movies” created by Douglas Butler to help the novice user learn the techniques of modelling with graphs (www.autograph-maths.com/inaction). The "slow plot" feature allows the graphing to be paused/resumed by tapping the spacebar. As Douglas says, “get them curious, and they are engaged”. One particular movie “completing the square” illustrates how prediction exercises can be carried out in whole class teaching and how pupils can be encouraged to be cognitively engaged in the process.
Coypu is a simpler program for plotting families of curves and data sets. A demonstration version is available for download from the Shell Centre at Nottingham University
http://www.nottingham.ac.uk/education/shell/
Omnigraph is highly recommended because of the additional teaching resources accompanying the package (www.spasoft.co.uk). Also there is a similarity with the popular Texas Instruments calculators TI-82 and TI-83. MathsNet http://www.mathsnet.net/omnigraph.html provide some resources for investigating mathematics common to both Omnigraph and TI calculators “Investigations with Omnigraph". For you to try
Use the Internet to locate further information about graphing programs.
Case Study - Using monitoring software in the classroom.
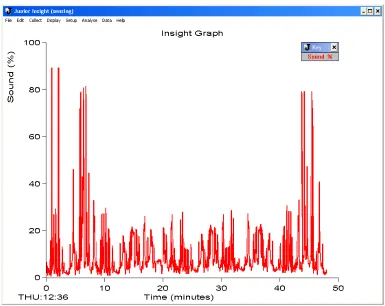
Figure 6.3 A living graph
The lesson continues describing monitoring and control issues. Near the end of the lesson the teacher reveals the sound sensor readings and plot. The hypotheses drawn by the pupils are compared to the real events.
Figure 6.4 Insight graph of noise level in classroom Leoni Funfe, a GTP teacher recommends that you
[image:5.595.89.474.331.637.2]at a fixed or varying time interval and log them on the database. This data can then be plotted as a line graph for better interpretation.
Higher set pupils will generally make sketches close to the real graph.” In this situation the pupils have been asked to predict and record their predictions in the form of living graphs. They have been able to check their hypotheses against a reality that would be hard to detect without technology. The exercise gives them an understanding of the facilities and uses of monitoring hardware and software. It enables them to develop higher order thinking skills.
Also, the activity places the learning in a context they are familiar with. When planning teaching activities you should endeavour to make the activity rich in curriculum content that places learning in a familiar context. The activities should develop learning skills and high level thinking.
For you to try
1 Use the internet to read about contextualised learning and in particular look for the work by Peter Jarvis (Jarvis, 2004).
2 The standard monitoring hardware kits have common sensors - nearly all have temperature probes, sound and light level sensors. Common software such as Logotron Insight provides the facility to log data over long periods of time. Set up the equipment to log light or temperature levels of the
classroom over a 24 hour period. The output can be used by pupils to check their hypotheses.
Resources
Logotron Insight http://www.logo.com is impressive datalogging software with highly developed features set to strengthen the quality of Key Stage 3 and 4 science experiments. Innovative features include a facility to display a powerful fast-logging option that enables pupils to record data at up to 100 samples per second in 'real-time'. It comes with an interactive teaching guide.
Deltronics Sense and Control box http://www.deltronics.co.uk comes with data logger software which can be used to set up experiments by selecting sampling rates, types of sensor (automatic sensor
identification is supported), trigger conditions, etc. The data is displayed as a graph or graphs, and can be saved in its own internal format or exported to a spreadsheet for further analysis.
Commotion http://www.commotiongroup.co.uk produce LogIT which combines meters, a data logger, interface and analysis system in one portable unit using an intuitive green to start, red to stop navigation.
Interpolation and extrapolation in social contexts
an important element of the curriculum. An aim of the National Curriculum is that our best pupils can when “…discussing their own and others' use of ICT, [and] use their knowledge and experience of information systems to inform their views on the social, economic, political, legal, ethical and moral issues…” that are raised by the use of ICT (DfEE, 2000). This is a measure of exceptional performance but each level of the attainment target for ICT capability has a stepping stone to this highest level.
Interpolation can be considered, in this context, to be the art of reading between the lines and of speculation about a situation which then leads to justification for those assertions. This activity is prone to prejudice and problems associated with blinkered thinking or narrow mindedness. Past experience and reflections upon previous
judgements plays an important role in this area.
Extrapolation is examining the scenarios and considering the possible outcomes. It is making hypotheses or predicting the future. In social contexts a person’s ideas about the future will be impacted upon by their more recent experiences. In this area of considering the role and values of ICT we are trying to broaden the pupils’ experience and understanding and by so doing broaden their expectations.
We will look at two scenarios. The first has been used successfully in classrooms for over 10 years. The scenario remains the same, but the outcomes have changed in the light of the ever developing
technologies and the more pervasive nature of ICT at work, in the home and in leisure activities.
Classroom activity 1
A park ranger (David) has recently retired from work at an English Nature SSI in the Beacon Hills at the age of 58. Now at home all day, hobbies and interests are important. His elderly mother (Catherine), who suffers from a heart condition, lives 10 miles away in a small village. His grandchildren (Mattie and Becky) attend Swanborough School and have access to a range of computers; they also have a computer at home.
•
Describe a medical technique that uses an electronic device that will make Catherine's health more secure.•
Describe a device that Catherine could have in her home that would mean she could call for help most easily - describe a device that would automatically call for help if Catherine did not get up on a particular morning.•
Describe how David and his grand children could use the internet to keep in touch with each other and describe how his grand children use information technology in their work at school.Commentary on classroom activity 1
These notes are useful starting points for discussions and factual lessons. Through them we can contextualise their learning. Pupils need to be able to discuss the social, economic, ethical and moral aspects of information technology. That discussion should be based upon as wide experience and knowledge of information and
communication systems. These discussions can be placed in core ICT lessons or PSHE sessions. The pupils are using skills of interpolation and extrapolation. They need to make some assumptions when recommending or suggesting ICT solutions. It is exercises like these that get the children thinking about the subject instead of simply seeking the right answer in simple multiple choice questions. Classroom activity 2
In this second scenario, the information given is not so explicit. A greater degree of interpolation, or reading between the lines, is required. There are also a number of “red herrings” which lead to an interest and engagement in the material. And an important difference is that the questions are not as focussed. This exercise is less well-suited to homework or individual study but benefits from discussion.
Put each of these items of information on separate cards. Give one set to each group of pupils. Ask them to sort the cards. After a few moments give them the question to focus upon. You will need to provide information about current computers and peripherals.
Stella has a flip-phone.
After putting the children to bed Stella relaxes by reading a book.
On her birthday Stella went to a singles bar with her mate.
Stella works in a shop.
Stella likes cooking.
Stella was born in Birmingham and went to college in London.
Stella’s car is an Audi 2000.
Stella’s boss is often away from work travelling on business.
There is a parents’ evening on Wednesday.
Stella’s favourite colour is purple and her favourite food is chocolate mousse.
Stella’s neighbour has a boat.
Stella’s Mum has two married sons.
Stella is 1.6m tall, weighs 71 kg and has size 45 shoes.
Using this information and the computer catalogue explain why Stella will pay £1100 for her first computer and peripherals and what will she do with that computer?
The Stella exercise is described as a “mystery”. Further examples can be found in Leading in Learning Exemplification in ICT (DfES, 2004). It is an example of a “powerful pedagogic strategy”. It is a device
whereby we can get pupils to really think about the issue and actively engage with the material. Importantly, these activities lend themselves to small group work and the subsequent learning we recognise as socially constructed.
For you to do:
1 Read about “mysteries” and their use in DfES (2004) and devise a mystery exercise that relates specifically to the people, events or places associated with your school or your pupils.
2 Create a grid with your mystery statements and print it on card. Place the cut cards into an envelope and distribute one envelope to each group of pupils. If pupils are familiar with the “mystery” technique then a way of differentiating the activity is to ask a more able group to devise their own mystery or modify the cards of the mystery you have given.
3 Read about constructivism. A useful summary can be found in “Learning and Teaching in Secondary Schools” (Kinchin, 2002: 24-26) and a more extensive discussion by Leask and Younie (2002: 117-133). Alternatively, carry out a search on the internet. My recommended source for information on learning theory is http://www.funderstanding.com.
instructions that did not necessarily give the correct answer. The boat did not ascend or the children got caught by the wicked witch. Being able to do more that the single option is the essence of exploration. It is the way in which computers can give a range of options for pupils to pursue.
Prediction needs more. Prediction needs the learner to articulate the reasoning for the choice based upon the information given. Prediction is a higher order skill.
Models are simulations that can be changed. In models the variables and conditions within the simulation are under the control of the user and this gives a greater opportunity for more sophisticated
exploration. We will consider one particular model used to teach the subject knowledge and understanding within geography at advanced level but first consider the value of using models in teaching. In a recent review of the educational literature of ICT-rich learning
environments the new paradigms of science teaching were examined: promoting cognitive change, formative assessment and lifelong
learning in the context of the use of ICT and models in particular (Webb, 2005: 705-735). Models are important because they: • can help visualise or experience scenarios that they cannot
experience for real because they are too dangerous, time consuming, expensive;
• can be the basis for the learners to understand theory by integrating discrete items of knowledge;
• can increase learners’ motivation and interest in the subject matter and thus increase cognitive engagement;
Importantly for ICT teachers, the use of spreadsheet, multimedia or script based models increases the understanding of the value of the generic software.
Using models enables learners to learn from making good decisions. They can also learn from making bad decisions; something that might be too emotionally or professionally costly in the real scenario. The advantage of learning to make predictions through simulations is that the consequences of poor decision making are virtually cost free yet have value in “learning from mistakes”.
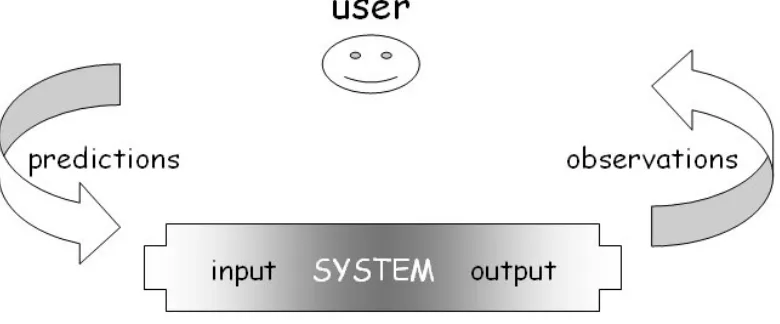
Figure 6.5 Prediction cycle
Classroom activity 3
Hydrograph is one of a series of models developed as part of a project to make independent learning more effective. The curriculum content is GCE level geography but the principles of learning through models can be applied to many areas of the
curriculum. The aim of the interactive presentation is to help pupils understand: what factors influence a river's flood behaviour; why different rivers have different flood risks; how we can predict flood risk by studying the river; and how sample flood events have
influenced people. The pupils are taken through a series of activities which isolate each of the factors that influence flooding. By moving a slide bar they can see the impact of changing the single variable. Each variable is identified, introduced and explored in turn.
Commentary
The importance of this model in the curriculum is both to motivate the pupils and to enable them to become engaged in the subject matter. The activities involve discussion and decision making. The pupils can also learn through reinforcement. They can carry out their own
predictions outside of the lesson. The activity supports independent learning. “Like other models we use, Hydrograph interests the pupils… they are able to see the impact of change… our curriculum is about understanding the influence that we are having on the environment.” (Moya Grove, geography teacher Peter Symonds College, Winchester). When explaining the industrial and commercial role of modelling and simulations and before introducing the technicalities of a spreadsheet-based activity it is always motivating to show the pupils working, sophisticated models
For you to do
1 Consider the questions and instructions you would use to encourage prediction. How will you set up the learning activity?
2 How would you explain that they should not simply type in a number to get the answer but to write down the number, write
down what answer or perhaps possible answers the computer model might give, write down the reasons. Then check by entering the number and seeing the answer. It is then important to explain if the model gave an unexpected result.
3 The focus may be a database search using AND, OR or NOT. Given the query the pupils should first be asked to predict what the result will be with an explanation, then try to explain if the result was unexpected. Before making an internet search consider what the results might be. For example, using Google what might the result of these two searches be [control OR CPU] and [control AND CPU].
Write down your plans in terms of what you would like to see the pupils doing and what they are supposed to be learning. Be clear that your description clearly explains to the pupils why they are doing the exercise.
Resources
The following resources all offer the opportunity to create prediction activities.
Flowol from Data Harvest enables pupils to create control programs. Like playing Chess, there are a limited number of simple rules but a world of strategies that can be developed. Flowol supports
analogue inputs to start and stop events
http://www.data-harvest.co.uk/control/flo_software.html
Fairground ride simulation from Funderstanding needs a java-enabled browser run the coaster applet which enables pupils. Pupils are
responsible for setting the controls for the height of the different hills, the size of the loop, the initial speed of the coaster, its mass, the gravity at work and the amount of friction on the track
http://www.funderstanding.com/k12/coaster
Another Roller Coaster simulation is from the University of
Cambridge's Brainteasers and Puzzles website. “You need to find the perfect combination... just enough thrills to keep the customers excited but not so bumpy that they throw up or faint!” It is available from the science section of http://puzzling.caret.cam.ac.uk
Mangodata from Sherston Software is a multi-user database that allows pupils to easily enter information and then search the data to display results through a range of graphs and charts. This information might include a class survey, historical census information, or perhaps the results of scientific investigations. The multi-user feature allows different pupils to enter data into the same database at the same time - pupils can access a database from the same network, from different schools, or even from different countries! http://www2.sherston.com Biz Wiz from 4Mation software is a small business simulator used to computer concepts, commerce, business studies and computing studies. Pupils can interact with the bank, use an employment agency and a market analyst, hire and fire staff, advertise and purchase parts. They will also have to set a keen market price for their products to ensure they remain competitive in the PC market.
http://www.4mation.co.uk/cat/bizwiz.html
Discussion
In this section we have seen that simulations can be the focus of prediction activities. Simulations are also motivating and encourage cognitive engagement. There is a conflict of interest. To make the prediction activity more effective we have to “slow down” the learner activity to ensure that they make considered and rationalised
decisions. An important motivation driver of simulations is the immediacy of their response to learner input. We risk losing the motivational aspect of simulations.
1. Final discussion
In this chapter we have seen some ways in which you can use ICT in the classroom to support hypothesis and prediction and how modern technology is enabling pattern seeking, extrapolation and
interpolation help learners analyse and understand data. Pattern is repetition and prediction is recognising the patterns that exist in data. Through the use of ICT learners can identify trends in values. Pupils can make sense and draw information from a mass of data by
systematically applying strategies.
A capability that pupils need to develop their skills of prediction includes visual literacy. Visual literacy is the ability, through
knowledge of the basic visual elements, to understand the meaning and components of the image whether it is a chart, graph, picture, icon, animation or movie. In other areas the verbal literacy skills of the pupils are challenged. Text-based and spoken vignettes are common in everyday life and schooling in general. Pupils in ICT lessons can use their skills to better understand the concepts of ICT, especially those associated with ethical, moral, social and economic issues.
The skills of prediction also require self discipline so not to jump to finding the answer but making a guess first and rationalising their assertion before checking their hypothesis. The affordances of the computer to enable the development of these higher order thinking skills are: the speed of response, the numerical representation of concepts (gradient, intersect points, average and trend), the
visualisation of concepts (narrow channel, broad basin, flash flood), the ability to "undo" actions so other decisions can be made and the facility to repeat activities.
We can help pupils to predict through targeted activities and giving a clear indication that it is the process that is more important than the product or answer. When introducing the ICT lessons, we use phrases such as "We Are Learning To..." (WALT) gain the skills of prediction, to make better guesses or to discover new facts from the data. It is important that we introduce the concept of self discipline and asking the pupils to holdback from finding the answers. We need to
articulate that "What I'm Looking For" (WILF) is the pupil making predictions, good guessing based upon past experience, and discovering new facts. The pupils need to understand that "This Is Because..." (TIB) in life we need to be able to predict what might happen in any situation if we are to make the best decisions.
Adey, P and Shayer, M (1994) Really raising standards: cognitive intervention and academic achievement London, UK: Routledge DfEE (1999) The National Curriculum London, UK: Qualifications and Curriculum Authority
DfES (2004) Leading in Learning: developing thinking skills at Key Stage 3 London, UK: DfES
Jarvis, P (2004) Adult education and lifelong learning: theory and practice London, UK: RoutledgeFalmer
Kinchin, G (2002) Learning and Learning Styles in Ellis, V (Ed) Learning and Teaching in Secondary Schools Exeter, UK: Learning Matters
Leat, D (1998) Thinking Through Geography Cambridge, UK: Chris Kington Publishing
Leask, M and Younie, S (2001) Communal Constructivist Theory: information and communications technology pedagogy and internationalisation of the curriculum in Journal of Information Technology for Teacher Education 10 1
Resnick, LB (1987) Education and Learning to Think Washington, US: National Academy Press
Webb, M (2005) Affordances of ICT in science learning: implications for an integrated pedagogy in International Journal of Science