9
E U R O P E A N
C O M M I S S I O N
THEME 9
Science
and
technology
Statistics
on
science
and
technology
Part A
2003 EDITION
A great deal of additional information on the European Union is available on the Internet.
It can be accessed through the Europa server (http://europa.eu.int).
Luxembourg: Office for Official Publications of the European Communities, 2003
ISBN 92-894-4446-0
ISSN 1725-1583
© European Communities, 2003
Europe Direct is a service to help you find answers to your questions about the European Union
New freephone number:
Statistics on Science and Technology — 2003
Acknowledgments
Acknowledgments
This publication was prepared under the direction of Photis Nanopoulos and
Pedro Diaz Muñoz, Directorate A — Statistical
information; research and data analysis; technical cooperation with Candidate, CARDS and Tacis countries, Jean-Louis Mercy, Head of
Unit A4 — Research and development, methods and data analyses. It has been coordinated by Ibrahim Laafia
and August Götzfried with
the collaboration of Simona Frank, Alice Zoppè
and Anna Larsson.
The texts and the analyses were realised by:
Marta Alfageme Perez de Mendiguren, Sammy Sioen, Alex Stimpson and
Christophe Zerr.
The data processing, the conception of the publication and the desktop publishing were realised by:
Marie-Agnès Bragard, Véronique de Kanel, Michel Kinif
and
Damien Tornaboni.
The opinions expressed are those of the individual authors alone and do not necessarily reflect the position of the European Commission.
Μ α π
Μ α π σσ
GISCO, Eurostat
© EuroGeographics Association 2001, for the administrative boundaries,
on behalf of the national organisations responsible for official mapping of the displayed countries.
Τ
Τ ρραα νν σσ λλ αα ττ ιιοο νν
Translation Service of the European Commission, Luxembourg.
Χ ο ν τ ρ ι β υ τ ι ο ν σ
Χ ο ν τ ρ ι β υ τ ι ο ν σ
Eurostat
gratefully acknowledges the contributions of the following institutes which supplied the statistics for the respective countries:
•
Belgium
Federal Office for Scientific, Technical and Cultural Affairs,
•
Denmark
The Danish Institute for Studies in Research and Research Policy,
•
Germany
Bundesministerium für Bildung, Wissenchaft, Forschung und Technologie — BMBF,
•
Greece
General Secretariat for Research and Technology — GRST,
•
Spain
Instituto Nacional de Estadistica — INE,
•
France
Ministère de l’éducation nationale, de la recherche et de la technologie — MENRT,
•
Ireland
Forfas,
•
Italy
Istituto Nazionale di Statistica — ISTAT,
•
Luxembourg
Service Central de la Statistique et des Études Économiques — STATEC,
•
Netherlands
Statistics Netherlands — CBS,
•
Austria
Austrian Central Statistical Office — ÖSTAT,
•
Portugal
Observatório das Ciências e das Tecnologia — OCT,
•
Finland
Statistics Finland,
•
Sweden
Statistics Sweden,
•
United Kingdom
Office for National Statistics — ONS,
•
Iceland
The Statistical Bureau of Iceland,
•
Norway
Statistics Norway.
As well as the following institutions:
•
DG Research
— European Commission,
•
European Patent Office
— EPO,
•
Organisation for Economic Co-operation and Development
— OECD.
II
II
A
C
K
N
O
WL
E
D
G
M
E
N
T
Statistics on Science and Technology — 2003
III
III
Foreword
Foreword
I
n the Barcelona summit, the European council remarked that a significant boost of the
overall R&D and innovation effort in the Union would be necessary in order to close the
gap between the EU and its major competitors. In this context, it set the objective of
increasing the overall spending on R&D and innovation in the Union to around 3 % of
GDP by 2010, with two-thirds of this new investment to come from the private sector.
Statistics on Science and Technology 2003
, prepared by the
Research and development, methods
and data analyses
unit of Eurostat, provides data that allow for the continuous reporting
and analysis of the situation of R&D in Europe. In particular, this publication presents the latest
developments in the field of R&D expenditure, R&D personnel, Government R&D appropriations
and Patents, and is a follow up of the former Research and Development: Annual Statistics, which
was first published in 1993. Other science and technology indicators collected by Eurostat are
excluded from this publication and may be found in Eurostat’s reference database,
NewCronos
.
Responding to developments in the policy and scientific communities,
Statistics on Science and
Technology 2003
provides some additional information on relevant indicators as compared to the
2001 edition. Data and trends are provided not only for patent applications to the European
Patent Office — EPO, but also for patents granted by the United States Patent and Trademark
Office — USPTO. Additional data on the number of researchers amongst total R&D personnel are
analysed for the European Union and beyond.
As in the 2001 edition, in an effort to provide users of Eurostat data with more detailed
information, certain indicators at the regional level are presented at the NUTS 2 level. Although
limitations of space have prevented the inclusion of complete time series in all cases, these data
can be found in the CD-ROM version of this publication and are, of course, available in Eurostat’s
reference database,
NewCronos
.
Comprehensive methodological notes are provided in their own section for clearer data
utilisation, providing such information as the source, reference unit and coverage of the data, the
time series available or any country specific methodological changes in the collection procedures.
All the information in this publication is based on data supplied to Eurostat by the Member States,
by the Research DG of the European Commission, by the European Patent Office — EPO, by the
United States Patent and Trademark Office — USPTO — and by the OECD. We express our thanks
to our colleagues in the Member States (and in Iceland and Norway), the Commission Services, the
EPO, the USPTO and the OECD for their excellent co-operation and their willingness to help in
meeting the ever-growing demand for information on S&T.
F
O
R
E
W
O
R
Statistics on Science and Technology — 2003
IV
IV
Table of contents
Table of contents
Acknowledgments
Acknowledgments
. . . .
II
II
F
F
oreword
oreword
. . . .
III
III
Introduction
Introduction
. . . .
VI
VI
P
P
AR
AR
T
T
1 — R&D in Europe:
1 — R&D in Europe:
Analysis
Analysis
. . . .
. . . .
1
1
Chapter 1 —
Chapter 1 —
Government budget appropriations or outlays
Government budget appropriations or outlays
on Research and Development — GBAORD
on Research and Development — GBAORD
. . . .
. . . .
2
2
1.1. Introduction . . . .2
1.2. GBAORD — an international perspective: 1991-2001 . . . .2
1.2.1. Total GBAORD . . . .2
1.2.2. GBAORD by socio-economic objective . . . .5
1.3. GBAORD — an European perspective . . . .5
1.3.1. Total GBAORD . . . .5
1.3.2. GBAORD by socio-economic objective . . . .7
1.4. Specific developments in the EEA — Country reports . . . .8
1.4.1. Belgium . . . .8
1.4.2. Greece . . . .9
1.4.3. France . . . .11
1.4.4. Ireland . . . .11
1.4.5. Italy . . . .11
1.4.6. The Netherlands . . . .13
1.4.7. Austria . . . .13
1.4.8. United Kingdom . . . .13
1.4.9. Iceland . . . .15
1.4.10. Norway . . . .15
Chapter 2 —
Chapter 2 —
R&D expenditure and personnel
R&D expenditure and personnel
. . . .
. . . .
16
16
2.1. Introduction . . . .16
2.2. Future prospects for R&D at the international level . . . .16
2.2.1. R&D expenditure . . . .16
2.2.2. R&D personnel . . . .18
T
A
B
L
E
O
F
C
O
N
T
E
N
T
Statistics on Science and Technology — 2003
V
V
Table of contents
Table of contents
Chapter 2 —
Chapter 2 —
R&D expenditure and personnel (continued)
R&D expenditure and personnel (continued)
2.3. R&D activity in Europe . . . .19
2.3.1. R&D expenditure . . . .19
2.3.2. R&D personnel . . . .22
2.4. R&D activity in the regions . . . .25
2.4.1. R&D expenditure . . . .25
2.4.2. R&D personnel . . . .28
2.5. Specific developments in the EEA — Country reports . . . .29
2.5.1. Belgium . . . .29
2.5.2. Greece . . . .29
2.5.3. France . . . .32
2.5.4. United Kingdom . . . .32
2.5.5. Iceland . . . .33
Chapter 3 —
Chapter 3 —
P
P
atenting activ
atenting activ
ities in the EEA, Japan and the USA
ities in the EEA, Japan and the USA
. . . .
. . . .
34
34
3.1. Introduction . . . .34
3.2. Patent applications to the EPO by year of filing . . . .35
3.2.1. Total patent applications . . . .35
3.2.2. High tech patent applications . . . .38
3.3. Patents granted by the USPTO by year of publication . . . .42
P
P
AR
AR
T
T
2 — Definitions and methodological notes
2 — Definitions and methodological notes
. . . .
. . . .
43
43
Chapter 1 —
Chapter 1 —
GBAORD
GBAORD
. . . .
. . . .
44
44
Chapter 2 —
Chapter 2 —
R&D expenditure and personnel
R&D expenditure and personnel
. . . .
. . . .
48
48
Chapter 3 —
Chapter 3 —
P
P
atents
atents
. . . .
. . . .
54
54
PPAR
ARTT 3 — Data
3 — Data . . . .
. . . .61
61
GBAORD data
GBAORD data . . . .
. . . .62
62
R&D EXPENDITURE data
R&D EXPENDITURE data . . . .
. . . .72
72
R&D PERSONNEL
R&D PERSONNEL data
data . . . .
. . . .106
106
PPAATENTS data
TENTS data . . . .
. . . .132
132
REFERENCE data
REFERENCE data . . . .
. . . .156
156
Abbrev
Abbreviations and other methodological notes to the tables
iations and other methodological notes to the tables . . . .
. . . .172
172
Abbrev
Abbreviations and symbols
iations and symbols
. . . .
175
175
T
A
B
L
E
O
F
C
O
N
T
E
N
T
Statistics on Science and Technology — 2003
VI
VI
The indicators presented in Statistics on Science and Technology
2003, by the Statistical Office of the European Communities —
Eurostat, allow the continuous reporting and analysis for a
close monitoring of recent performances and the identification of
current and potential areas of concern.
The data, which cover R&D expenditure, R&D personnel,
Government budget appropriations or outlays for R&D and patents,
are as comprehensive, comparable and as up to date as possible.
Their focus is on the 15 European Union Member States and, to a
lesser extent, the European Economic Area. To provide high-level
international comparison, the United States and Japan are also
considered, where possible. At the other end of the scale, a
regional analysis across the EU countries is provided.
This publication, intended for both generalists and specialists, is
organised as follows. The first Part presents an analysis of the
recent trends in R&D and patenting. In Part 2, the accompanying
methodological information is provided in some detail for more
specialist users. Part 3 presents tables containing both original
data and derived indicators, providing users with the opportunity
to conduct their own analyses on the Research and Development
situation in Europe and beyond. Within R&D expenditure and
personnel or patents, data are organised according to geographical
detail, with national data being presented before NUTS 2 level
regional data.
Given the numerous sources of data involved, the time series
differ according to indicator. However, the first considered year for
most indicators in this publication is 1991. In any case, the goal of
this publication remains the same throughout: to provide the most
detailed and coherent time series analysis possible.
Consistency with the analyses conducted in previous publications is
also maintained, whilst seeking to complement these aspects with
further research. A number of important innovations have been
introduced to this publication.
The first is an extended reporting of the data, with data on patents
now also presented for patents granted by the United States Patent
and Trademark Office — USPTO. Data on high technology patents
are now also provided broken down by high technology group.
The data series in national currency included in this publication
refer to national currencies at 1 January 2002 and therefore
include ‘Euro fixed’ series for Eurozone countries along with
non-Eurozone countries series that continue to be expressed in
DKK, SEK, GBP, and USD for example. To maintain the possibility of
using data in national currency for time series analysis also for the
period prior to the adoption of the Euro, data were converted from
the former national currency series by applying the irrevocably
fixed Euro exchange rate for the entire time series presented —
including years before the adoption of the Euro. This means that
these series cannot be used in general for comparisons over
space. In particular, users are warned about the possible
misunderstanding in using these data for geographical
comparisons or aggregations of Eurozone countries for periods
prior to the adoption of the Euro. For such purposes it is advisable
to use the series in current Euro, which have been calculated by
using the current exchange rates.
Concerning the data series in real terms, unlike in previous
years when data were presented in constant Euro, data in this
publication are given in PPS at 1995 prices.
In an effort to provide users with a set of rigorous and
comprehensive methodological notes, Part 2 of this publication
presents in some detail the information behind the data. For
each variable — GBAORD, R&D expenditure and personnel or
patents — Part 2 specifies the appropriate definitions, sources,
reference units, time series, geographical coverage, method of
calculation, etc. Also documented in this section are the country
specific notes, such as breaks in series or methodological changes.
Due to constraints of space, the comprehensive statistical tables
used for the analysis are not always available in the paper version
of the present publication. Instead, they are provided in their
entirety in the electronic version of Statistics on Science and
Technology 2003. Electronic versions of this publication can be
obtained by visiting the Eurostat Web-site at:
http://www.europa.eu.int/comm/eurostat.
Readers should note that the data used for the analyses of R&D in
Europe — Part 1
are those available in the third quarter of 2002.
They may not correspond exactly with those in the tables in
Part 3, or in Eurostat’s NewCronos
database, when these have been
subsequently updated.
Γ ο ϖ ε ρ ν ε ν τ β υ δ γ ε τ α π π ρ ο π ρ ι α τ ι ο ν σ
Γ ο ϖ ε ρ ν ε ν τ β υ δ γ ε τ α π π ρ ο π ρ ι α τ ιο ν σ
ο ρ ο υ τ λα ψ σ φ ο ρ Ρ & Γ Β Α Ο Ρ
ο ρ ο υ τ λα ψ σ φ ο ρ Ρ & Γ Β Α Ο Ρ
In Part 1, Chapter 1 documents the main trends of GBAORD in the
EU and EEA, first placing Europe in an international context
and then concentrating on developments at the national level.
In 2001, budget appropriations in the Member States of the
European Union totalled roughly EUR 67 400 million, a rise of
around EUR 3 300 million in nominal terms on 2000 — or 3 % in real
terms, i.e. corrected for inflation. Although GBAORD as a
percent-age of GDP in the EU showed a downward trend through out the
nineties, a slight improvement was registered in 2000 and 2001.
Comparisons with the US and Japan reveal that Japan has caught
up both the EU and the US to a significant degree since the end of
the ‘80s, registering almost systematic higher year-on-year
absolute growth. Nevertheless, the US still retains the highest
values of government budgeting to R&D activities.
Within the EU, Finland and France show the highest proportions of
government budgeting to R&D activities, both as a proportion of
their GDPs and total general government expenditure. Spain and
Portugal, on the other hand, have shown the highest growth rate
over the last five years and are approaching the EU average.
Changing trends are also evident in the socio-economic objectives
of these funds. The importance of budgeting towards ‘Defence’
declined during the 90s. So too have ‘Agricultural production and
technology’ and ‘Exploration and exploitation of the earth’.
Meanwhile, ‘Research financed from general university funds’ has
continued to see budgetary increases, as has ‘Protection and
improvement of human health’.
Introduction
Introduction
IN
T
R
O
D
U
C
T
IO
Statistics on Science and Technology — 2003
VII
VII
Ρ & ε ξ π ε ν δ ι τ υ ρ ε α ν δ π ε ρ σ ο ν ν ε λ
Ρ & ε ξ π ε ν δ ι τ υ ρ ε α ν δ π ε ρ σ ο ν ν ε λ
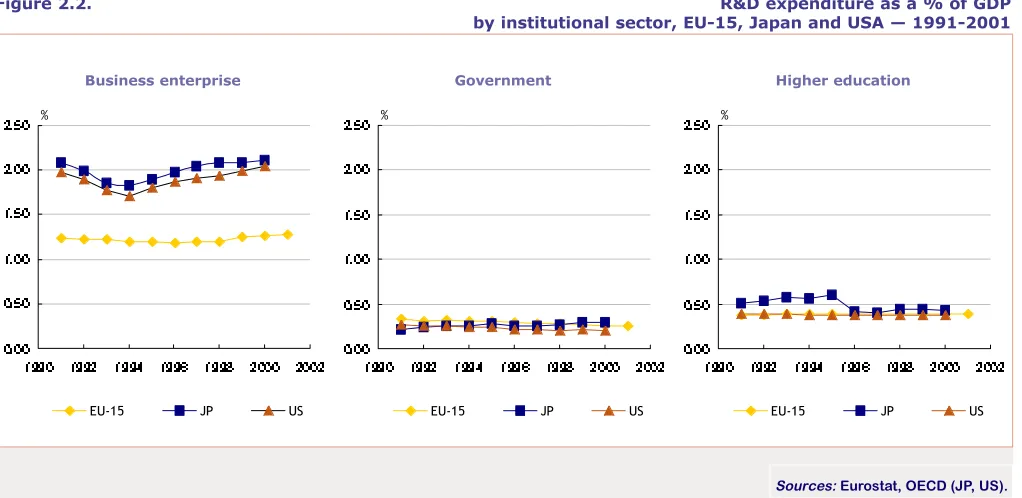
Chapter 2 gives the most recent trends in both R&D expenditure
and personnel. In 2001, EUR 171 billion at current prices were
spent on R&D in EU-15, displaying a rise of 2.9 % compared to the
previous year in real terms. Despite this increase, the gap between
the EU and both the US and Japan remains stable when R&D
expen-diture as a share of GDP is compared for each institutional sector.
In 2001, the EU devoted 1.94 % of its GDP to R&D expenditure
against 1.93 % in 2000. Meanwhile, this percentage reached 2.98 %
in Japan and 2.70 % in the United States in 2000. Concerning the
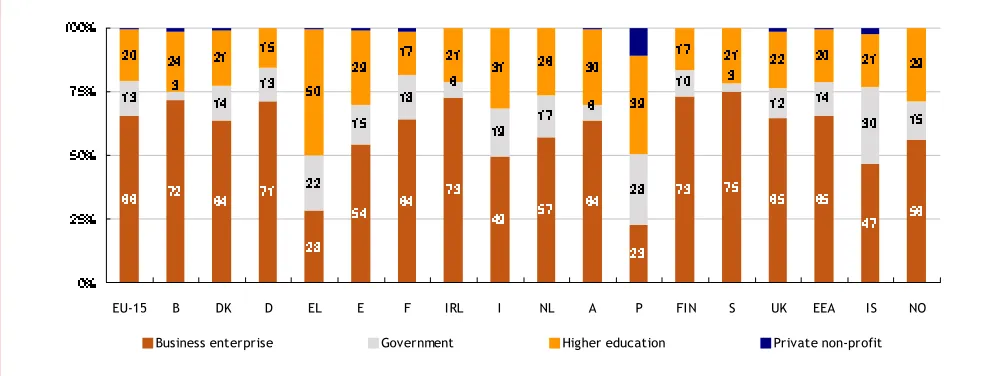
distribution across institutional sectors, most of the R&D
expenditure corresponds to the business enterprise sector, which in
2001 accounted for 66 % of the total in EU-15, 71 % in Japan and
75 % in the United States in 2000. At the Member State level, as for
the previous year, Sweden (1999 data) and Finland (2001 data)
performed best, with 3.78 % and 3.67 % of their respective GDP
being devoted to R&D expenditure.
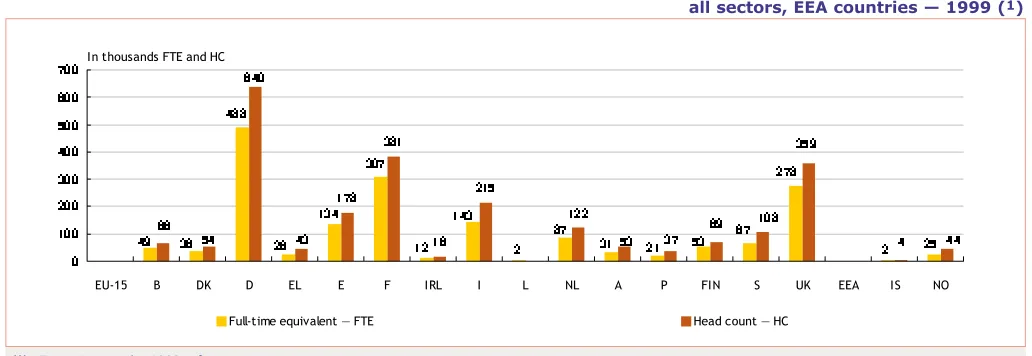
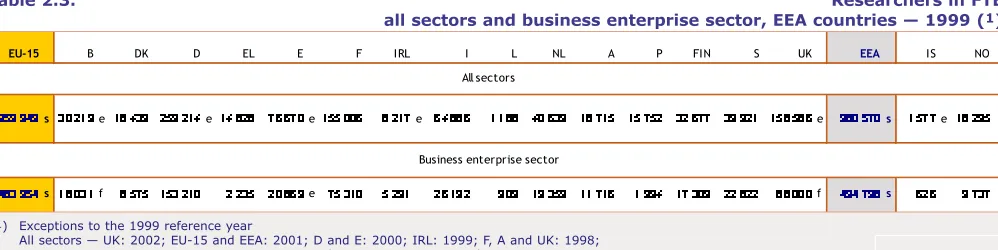
R&D personnel is also increasing in the EU: In 2001, there were
1.8 million people in full-time equivalent or 2.4 million in head
count engaged in R&D, which represented 1.41 % of the EU’s
labour force in 2001, compared to 1.38 % in 2000. Amongst R&D
personnel, the number of researchers in EU-15 increased to
960 000 persons (FTE) in 2001, an increase of over 100 000
re-searchers since 1995. Within the EEA, most rere-searchers are
employed in Germany, whereas the highest proportion of
researchers on total R&D personnel is observed in Portugal (76 %)
and Norway (72 %). With regard to the gender distribution,
women are unequally represented in R&D personnel, in particular
when they are researchers and employed in the business enterprise
sector.
At the regional level, German regions concentrate most R&D
activity in Europe, both in terms of volume and as a percentage
of GDP. With Oberbayern (D) as the leading region, the 6 first
classified German regions represent 16 % of the total R&D
expenditure in Europe (current EUR). In terms of R&D expenditure
as a share of GDP, Braunschweig (D) is, with 6.34 % in 1999, the
first region in Europe and shows a very strong increase of about
1.5 percentage points during the previous 2 years.
Braunschweig remains in the leading position in the business
enterprise sector with 4.60 % of its GDP devoted to R&D
expendi-ture in this sector. Açores (P) is in the lead in the government
sector and Tröndelag (NO) in the higher education sector with
2.12 and 1.63 % of their respective GDP devoted to R&D.
Π α τ ε ν τ ιν γ α χ τ ι ϖ ι τ ι ε σ
Π α τ ε ν τ ιν γ α χ τ ι ϖ ι τ ι ε σ
ιν τ η ε Ε Ε Α , ϑ α π
ιν τ η ε Ε Ε Α , ϑ α π αα νν αα νν δδ ττ ηη εε ΥΥ ΣΣ ΑΑ
As documented in Chapter 3, patent applications to the European
Patent Office have been increasing in the second part of the 90’s.
In 2000 there were 57 473 patent applications to the EPO from
inventors resident in the EU, 43 761 from inventors resident
in the US and 18 780 from Japanese resident inventors. Note that
the EU Member States may have a home advantage.
Within Europe, Germany is leading, accounting for 42.4 % of total
European patent applications in 2000, followed by France (14.4 %)
and the UK (12.9 %). In relative terms, the country with the
highest number of patent applications per million inhabitants
was Sweden (346) followed by Finland (320). Both countries
out-performed Germany, France and the UK and their ratios more than
doubled the EU and US ones.
At the regional level, inventors from the French capital region
of Île de France applied for most patents in absolute terms
(3 424 patent applications), followed by those from the southern
German regions of Oberbayern (3 092) and Stuttgart (2 533).
Oberbayern was the region with the highest proportion of patent
applications per million inhabitants (767) in the EU.
Among the patent applications to the EPO, an increasing
proportion relates to high technology areas. Throughout the
1995-2000 period, high tech patent applications in Europe grew at
an annual average growth rate of 22.0 %, compared to 10.9 % of
patent applications overall. This increase for high tech patents was
evident not just for the EU, but also for patent applications made
to the EPO by Japan and the US.
In 2000, the USPTO published 86 563 patents granted to US
inventors, 31 643 patents granted to Japanese inventors and
27 783 patents granted to inventors resident in the EU. Within the
EU, Germany accounted for 39.4 % of the total patents granted,
the UK for 15.4 % and France for 15.2 %.
The number of patents granted by the USPTO to EU inventors has
been growing in all Member States, especially during the second
part of the nineties. When taking population into consideration,
in 2000, Sweden was leading (196 patents granted per million
inhabitants), followed by Germany (133) and Luxembourg (133).
Introduction
Introduction
IN
T
R
O
D
U
C
T
IO
Chapter 1
Chapter 1
Government budget appropriations or outlays
Government budget appropriations or outlays
on Research and Development — GBAORD
on Research and Development — GBAORD
1 .1 .
1 . 1 . ΙΙνν ττ ρροο δδ υυ χχ ττ ιι οο νν
Government budget appropriations or outlays on R&D — GBAORD —
are a way of measuring government support to R&D activities. They
include all appropriations allocated to R&D in central
government or federal budgets. Provincial or state government
should be included only where the contribution is significant.
Unless otherwise stated, data include both current and capital
expenditure, and cover not only government-financed R&D
per-formed in government sector, but also government-financed R&D in
the business enterprise, private non-profit and higher education
sectors, as well as abroad (i.e. international organisations). Data
are collected according to the guidelines outlined in the OECD’s
Proposed standard Practice for surveys of research and
experimental development
— Frascati Manual, 2002.
GBAORD data do not consider the amount of money actually spent,
but are based on budget provisions, and so should be seen as
inten-tions of spending. This is why data on actual R&D expenditure,
which are not available in their final form until some time after
the end of the budget year concerned, may well differ from the
original budget provisions. The process of political consensus about
public expenditures creates gaps between budgets and final
expenditures — gaps in terms of time and amount of resources. The
reporting unit also differs between GBAORD and R&D expenditure:
the reporting unit for GBAORD is the Government, whereas for
R&D expenditure the reporting unit is the performer of the R&D
activity. However, since there is a greater time lag for data on
final R&D expenditure, data are usually collected from budget
statistics in order to provide timely indicators.
Data are collected at the national level and the procedure can be
articulated in a two step process:
•
within the budget statistics, it is first necessary to identify the
budget items that involve R&D;
•
the R&D content of these budget items must then be measured
or estimated.
Government R&D appropriations are broken down by
socio-economic objectives on the basis of NABS — Nomenclature for the
analysis and comparison of scientific programmes and budgets,
Eurostat, 1994. These data reflect policies at a given moment in
time and the concomitant priorities of the policy makers when
allocating their budgets. These data are hard to collect because
they are not obtained from ad hoc
surveys, but from national
budget statistics. More specifically, the difficulty is due to the fact
that national budgets already have their own terminology and
methodology and therefore do not accord entirely with the
Eurostat guidelines and the methodology proposed by the
Frascati Manual.
The 1983 version of NABS applies to all the figures up until the 1992
final budgets and the 1993 provisional budgets. The 1993 version
applies from the 1993 final and the 1994 provisional budgets
onwards. As a result of the revision of NABS, some caution should
be employed when comparing the data for some NABS headings
with those of earlier years. The greatest differences are to be
found in chapters 1, 3, 5, 7, 10 and 11 of NABS (
1
). Furthermore,
not all countries transpose their data directly to NABS: some
follow other compatible classifications — OECD, Nordforsk, which
are then converted to the NABS classification — see Table 8.2.,
p.115 of the Frascati Manual, OECD 2002.
The analysis in this chapter covers the period 1991 to 2001, with
provisional data for 2001. The chapter is divided into two main sections.
The first section takes an international perspective and compares
the respective trends in the EU (
2
), Japan and the USA. The second
section begins by analysing the evolution of GBAORD for the EU,
Iceland and Norway, and then presents some specific developments
in the Member States by means of individual country reports.
1 .2 .
1 . 2 . ΓΓ ΒΒ ΑΑ ΟΟ ΡΡ
α
ν ι ν τ ε ρ ν
α
τ ι ο ν
α λ π
ε ρ σ
π
ε χ τ ι ϖ ε
α
ν ιν τ ε ρ ν α
τ ι ο ν α λ π
ε ρ σ π
ε χ τ ι ϖ ε
1 9 9 1 − 2 0 0 1
1 9 9 1 − 2 0 0 1
This section considers government budgeting to R&D activities
in the European Union compared to that of Japan and the
United States. Overall levels of GBAORD are examined as well as
breakdowns by socio-economic objectives.
1 .2 .1 .
1 .2 . 1 . ΤΤ οο τταα λλ ΓΓ ΒΒ ΑΑ ΟΟ ΡΡ ))
At the beginning of the 1990s, the USA allocated more funds to
R&D activities, as a percentage of GDP, than EU-15 and Japan. At
this time, the GBAORD of the EU-15 and the United States were
respectively twice and two and a half times greater than that of
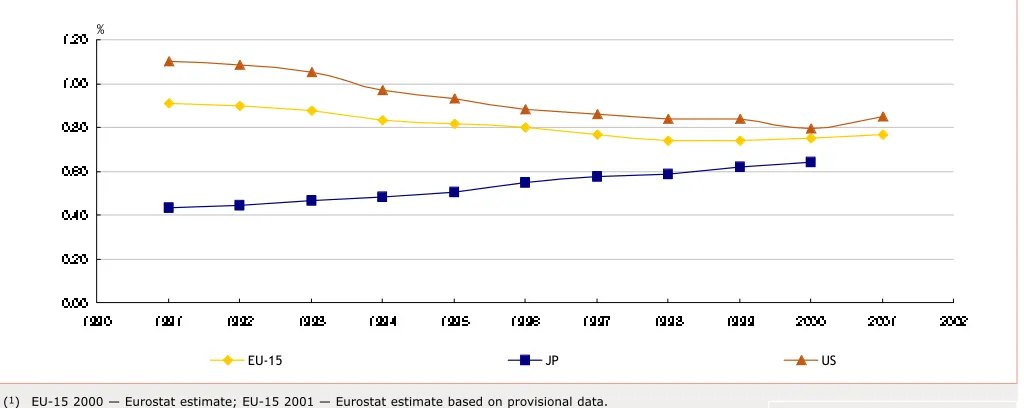
Japan. Figure 1.1. clearly shows this substantial difference at the
beginning of the 1990s, but it also helps show the convergence in
the appropriations allocated to R&D over the course of the decade.
In terms of nominal value (current EUR), the USA GBAORD in 1991
was approximately EUR 53 billion, or four to five times higher than
that of Japan. In 2000, this same ratio is down to 2.5.
Between 1991 and 2001, Japan’s GBAORD rose by 65 % in real
terms (1995 PPS) whereas those of the USA and the EU-15
remained virtually stable.
After correction for inflation, absolute year-on-year growth was
thus higher for Japan, which had annual growth rates of between
2 % and 12 % whereas the EU-15 and the United States recorded
rates, which fluctuated between positive and negative growth.
Statistics on Science and Technology — 2003
2
2
P
A
R
T
1
—
G
B
A
O
R
D
(
1
) These NABS chapters cover the following fields:
Chapter 1 — Exploration and exploitation of the Earth;
Chapter 3 — Control and care of the environment;
Chapter 5 — Production, distribution and rational utilisation of energy;
Chapter 7 — Industrial production and technology;
Chapter 10 — Research financed from General University Funds (GUF);
Chapter 11 — Non-oriented research.
(
1
) EEA, EU-15 and EUR-12 — Eurostat estimates based on provisional data.
(
2
) Exceptions to the 2001 reference year — DK and E: 2000 provisional.
(
1
) EU-15 2000 — Eurostat estimate; EU-15 2001 — Eurostat estimate based on provisional data.
US 2001 — provisional data.
(
1
) EU-15 — Eurostat estimates based on provisional data.
Sources: Eurostat, OECD (JP, US).
Sources: Eurostat, OECD (JP, US).
Figure 1.1.
GBAORD as a % of GDP
EU-15, Japan and the United States — 1991-2001 (
1
)
Statistics on Science and Technology — 2003
3
3
P
A
R
T
1
—
G
B
A
O
R
D
Figure 1.2.
Distribution of GBAORD by socio-economic objective in %
EU-15, Japan and the United States — 2001 (
1
)
Figure 1.3.
GBAORD as a % of GDP
EEA countries — 2001 (
1, 2
)
Source: Eurostat.
%
1. 0 7 1.00
0.82
0.78 0. 77 0.76
0.58 0.99
0. 30 0.33 0.74
0.88
0. 69 0.69 0. 69
0. 68 0.68 0. 66
0. 63
0.00 0.20 0.40 0.60 0.80 1.00 1.20
IS
FIN
F
S
D
EUR-12 EU-15
EEA
NL
I
UK
E
N
DK
A
P
B
IRL
EL
2. 94
4. 14 19. 25
1. 29
11. 14
54. 13
15.53
2. 78
14.36
3. 44 5.49 9. 74
1.43
1. 52
6.33
3.16
31.76
1. 52 18. 07
1. 68 3.75
0.80
14. 00
0. 91
5. 56 6.76
3. 88 3.46
35. 44
1. 55 0.78
0. 95 1. 34 2. 55
2. 10
0.54
5. 93
0 10 20 30 40 50 60
Exploration and
exploitation of
the Earth
Infrastructure
and general
planning of
land-use
Control and
care of the
environment
Protection and
improvement of
human health
Production,
distribution
and rational
utilisation of
energy
Agricultural
production and
technology
Industrial
production and
technology
Social
structures and
relationships
Exploration and
exploitation of
space
Research
financed from
General
University
Funds (GUF)
Non-oriented
research
Other civil
research
Defence
%
EU-15 2001 provisional
JP 2000 final
US 1998 final
%
0. 0 0 0. 2 0 0. 4 0 0. 6 0 0. 8 0 1. 0 0 1. 2 0
1990 1991 1992 1993 1994 1995 1996 1997 1998 1999 2000 2001 2002
[image:11.595.44.556.67.271.2] [image:11.595.47.554.320.521.2] [image:11.595.44.573.550.773.2](
1
) EEA, EU-15 and EUR-12 2001 — Eurostat estimates based on provisional data.
(
2
) Growth rates calculated using data expressed in constant 1995 PPS.
(
3
) Exceptions to the 1996-2001 years — DK and E: 1996-2000.
Figure 1.4.
GBAORD as a % of total general government expenditure
EU-15 countries — 2000 (
1
)
(
1
) EU-15 and EUR-12 — Eurostat estimates.
DK and E: provisional data.
Figure 1.5.
Annual average growth rates for GBAORD and GDP
EEA countries — 1991-96 and 1996-2001 (
1, 2, 3
)
Statistics on Science and Technology — 2003
4
4
P
A
R
T
1
—
G
B
A
O
R
D
Source: Eurostat.
Source: Eurostat.
2. 010.60 1.40
1.41 1.87
1.32 1.75
1.75 1.73
1.65 1.65 1.62
1.26 1.20
1.16 0.99
0. 00 0. 50 1. 00 1. 50 2. 00 2. 50
FIN
F
UK
D
E
EU-15 EUR-12
NL
I
P
S
DK
A
B
IRL
EL
%
0.13
−
0. 90
−
3. 77
8. 06
−
3. 35
−
0. 47
−
1. 02
−
1.62
−
1.30
−
1.25
4. 04 1.36
2. 57 1. 03
5. 87 1. 08
1. 49 1. 10
1. 47 1. 30
1. 50 1. 54
7.33
8. 20 0.83
8. 69
1. 74 2. 32
1.43 1.82
2. 50
1. 21
1. 54 1. 19
2.25
2.23
1. 79
1.41
−
6.00
−
3.00 0.00 3. 00 6.00 9.00
NO
IS
UK
S
FIN
P
A
NL
I
IRL
F
E
EL
D
DK
B
EUR-12
EU-15
EEA
GBAORD
GDP
−
0.24
10.72 1. 04
−
0.91
3. 44 5. 69 3. 87 0. 00
1.27 3. 31
4.25 2. 76
4. 38 3.43 3. 29
9. 52 3. 87
2.39
11.34
2.49 2. 32
5. 38 8. 22 7.35 1. 13
2.70 2.30
2.38 2.01
2. 82 3. 75 2. 77
2.42 2.99 1.75
2. 63 2. 66 2.65
−
6.00
−
3. 00 0. 00 3.00 6.00 9. 00 12.00
NO
IS
UK
S
FIN
P
A
NL
I
IRL
F
E
EL
D
DK
B
EUR-12
EU-15
EEA
GBAORD
GDP
Statistics on Science and Technology — 2003
5
5
P
A
R
T
1
—
G
B
A
O
R
D
1 .2 . 2 .
1 . 2 .2 . ΓΓ ΒΒ ΑΑ ΟΟ ΡΡ
β ψ σ ο χ ιο −ε χ ο ν ο ιχ ο β ϕε χ τ ιϖ ε
β ψ σ ο χ ιο − ε χ ο ν ο ι χ ο β ϕ ε χ τ ιϖ ε
Not only does the level of budgeting towards R&D activities vary
from one geographical entity to another, but the objectives are
also different.
GBAORD is broken down into socio-economic objectives, thus
providing information on changing trends and attitudes towards
different types of R&D activities.
Figure 1.2. displays these different attitudes to budgetary
appropriations (EU-15 = 2001, USA = 1998 and JP = 2000).
In 2001, as in previous years, ‘Research financed from general
university funds (GUF)’ accounted for the lion’s share of EU
GBAORD (31.8 %). ‘Non-oriented research’ and ‘Defence’ claimed
14.4 and 15.5 % respectively of budgetary appropriations
allocated to R&D. ‘Industrial production and technology’
repre-sented 9.7 % of total EU GBAORD in 2001. ‘Exploration and
exploitation of the earth’, ‘Infrastructure and general planning of
land-use’ and ‘Other civil research’ were the socio-economic
objectives with the lowest budgets at 1.4, 1.5 and 1.5 %
respectively.
In Japan, ‘Research financed from GUF’ was also the leading
socio-economic objective (in 2000) with 35.4 % of total GBAORD. A
further 18.1 % was allocated towards ‘Production, distribution and
rational utilisation of energy’, which includes such research as
‘Radioactive waste management’ and ‘Renewable energy sources’.
The lowest proportion of budgeting in Japan was allocated towards
‘Control and care of the environment’ which accounted for 0.8 %
of total GBAORD in 2000.
In the United States, over half of all GBAORD in 1998 was
allocat-ed to ‘Defence’ (54.1 %). ‘Protection and improvement of human
health’, which comprises such sub-chapters as ‘Medical research’
and ‘Preventive medicine’, took up almost a fifth of government
budgeting to R&D activities and ‘Exploration and exploitation of
space’ just over a tenth. No data are available for ‘Research
financed from GUF’ and ‘Other civil research’ for the USA.
1 . 3 .
1 . 3 . ΓΓ ΒΒ ΑΑ ΟΟ ΡΡ
α ν Ε υ ρ ο π ε α ν π ε ρ σ π ε χ τ ιϖ ε
α ν Ε υ ρ ο π ε α ν π ε ρ σ π ε χ τ ι ϖ ε
This section is split into two main parts. The first examines the
trends and developments in total GBAORD at national level for the
Eurozone countries, EU-15 and the EEA. The second part evaluates
the socio-economic priorities of these same countries. Finally, a
section looks at the individual situations in these countries via the
country reports.
1 .3 .1 .
1 .3 .1 . ΤΤ οο ττ αα λλ ΓΓ ΒΒ ΑΑ ΟΟ ΡΡ
GBAORD in the EU represented 0.77 % of GDP, but this figure
conceals differences between the Member States. Figure 1.3.
shows that in 2001 (provisional data) the greatest efforts in terms
of R&D funding were made by Iceland, Finland and France, with
1.07, 1.00 and 0.99 % of GDP respectively. In Sweden and Germany,
there was also more emphasis placed on government budgeting
towards R&D activities than the EU average of 0.77 %. Ireland and
Greece, on the other hand, allocated fewer budgetary
appropria-tions to R&D, their respective figures of 0.33 and 0.30 % of GDP
being around two-fifths of the Community average. The nine other
EEA countries fell within 0.74 % (Netherlands) and 0.58 % (Belgium)
of GDP.
In terms of the percentage of total general government
expendi-ture — see Figure 1.4. — GBAORD provides a proxy of the relative
emphasis that governments place on funding R&D. Once again
Finland, France and Germany are amongst the countries which
budgeted most to R&D activities at 2.01, 1.87 and 1.75 %
respectively of total general government expenditure in 2000. The
UK and Spain also budgeted more than the EU average (1.65 %) at
1.75 and 1.73 % of public expenditure, although their activities fell
short of the EU average when measured against GDP.
Figure 1.5. shows that the increase for Spain followed a period
(1996-2001) that witnessed strong increases in GBAORD. The
annu-al average growth rate of GBAORD in reannu-al terms was 11.3 % during
this period, whereas it was negative (- 0.5 %) for the period from
1991 to 1996. Similarly, Italy’s GBAORD, which recorded negative
annual growth rates (- 3.8 %) over the period from 1991-96, grew
appreciably during the period 1996-2001 with an annual average
growth rate of 5.7 %. France is in a similar situation, although the
growth in annual rates is less pronounced, rising from - 3.4 to
1.1 %.
Ireland, Portugal and Greece increased their budgeting to R&D
activities over the two periods with annual average growth rates of
7.7, 7.8 and 6.3 % respectively. The same applies for Austria,
Belgium, Denmark, Finland, the United Kingdom and Iceland,
although it should be noted that the increase in Iceland during the
period 1996-2001 came mainly in 1999 and 2000. Sweden recorded
negative annual average growth rates of around - 0.9 % between
1991 and 2001, whilst Germany moved from a slightly negative
growth rate between 1991 and 1996 to more or less zero growth
between 1996 and 2000. In Norway, finally, GBAORD rose during the
first period and then fell thereafter.
Statistics on Science and Technology — 2003
6
6
P
A
R
T
1
—
G
B
A
O
R
D
Table 1.1.
Distribution of GBAORD by socio-economic objective in %
EEA countries — 2001 (
1, 2
)
(
1
) EEA, EU-15 and EUR-12 — Eurostat estimates based on provisional data.
(
2
) Exceptions to the 2001 reference year — DK and E: 2000 provisional.
Figure 1.6.
GBAORD by grouped socio-economic objective in millions of constant 1995 PPS
EU-15 — 1991-2001 (
1
)
(
1
) EU-15 2000 — Eurostat estimate; EU-15 2001 — Eurostat estimate based on provisional data.
Source: Eurostat.
Source: Eurostat.
Millions of constant 1995 PPS
0 2 000 4 000 6 000 8 000 10 000 12 000 14 000 16 000 18 000 20 000
1991 1992 1993 1994 1995 1996 1997 1998 1999 2000 2001
Human and social objectives
Technological objectives
Agricultural production and technology
Research financed from General University Funds (GUF)
Non-oriented research
Other civil research
Defence
NABS
B
DK
D
EL
E
F
IRL
I
NL
A
P
FIN
S
UK
IS
NO
1.
Exploration and exploitation
of the Earth
1. 42 1. 45 0.86 1. 28 1.75 2. 98 1.98 0. 77 0.38 1. 88 0.96 2. 21 1.74 1. 28 0.37 1. 48 1.43 − 2. 15
2.
Infrastructure and general
planning of Land-use
1. 50 1. 32 0.78 1. 84 1.67 2. 55 0.65 0. 64 1.04 0. 41 3.83 1. 79 8.15 2. 14 3.31 1. 93 1.52 7. 55 2. 34
3.
Control and care
of the environment
2. 77 2. 88 2.66 2. 79 3.14 4. 32 2.67 2. 89 1.39 2. 28 3.92 1. 50 4.75 2. 18 0.90 2. 62 2.77 0. 75 2. 78
4.
Protection and improvement
of human health
6. 33 5. 02 1.41 1. 99 4.01 7. 47 4.82 5. 79 3.83 6. 99 3.11 2. 93 7.16 6. 44 0.69 14. 23 6.34 8. 67 7. 16
5.
Production, distribution and
rational utilization of energy
2. 93 3. 47 2.78 1. 99 3.40 1. 35 3.64 3. 93 − 3. 64 3.00 0. 64 0.94 5. 71 2.62 0. 47 2.91 2. 46 2. 03
6.
Agricultural production
and technology
3. 10 2. 77 2.51 12. 42 2.41 5. 83 4.21 2. 12 14.41 1. 80 3.17 2. 57 13.36 5. 57 2.14 3. 86 3.23 22. 55 8. 94
7.
Industrial production
and technology
9. 67 11. 95 24.09 6. 39 12.09 8. 57 15.81 6. 29 21.16 14. 80 13.54 9. 07 10.24 27. 42 2.17 0. 57 9.74 2. 51 13. 66
8.
Social structures
and relationships
3. 39 3. 07 5.37 11. 16 4.52 6. 24 0.58 0. 81 7.01 4. 38 2.92 2. 00 3.70 5. 56 6.56 3. 47 3.51 38. 75 7. 11
9.
Exploration and
exploitation of space
5. 49 6. 32 11.73 2. 79 4.68 0. 29 5.52 9. 80 − 7. 30 2.45 0. 14 0.59 2. 16 2.40 2. 36 5.42 − 2. 33
10.
Research financed from
General Universty Funds (GUF)
31. 83 33. 57 19.35 38. 96 38.99 48. 69 21.38 21. 60 19.24 43. 74 45.46 60. 71 35.62 25. 92 45.55 19. 98 31.89 − 37. 32
11.
Non-oriented research
14. 35 15. 00 24.06 17. 83 16.14 10. 55 7.32 19. 82 31.54 8. 76 10.63 13. 79 8.83 14. 06 − 13. 74 14.27 16. 76 9. 3212.
Other civil research
1. 57 1. 28 4.16 − 0.05 0. 77 1.23 2. 31 − − 4.82 2. 71 3.66 − 15.10 0. 42 1.54 − −13.
Defence
15. 66 11. 90 0.24 0. 57 7.15 0. 39 30.18 23. 24 − 4. 03 2.19 − 1.25 1. 56 18.19 34. 89 15.44 − 4. 84Total civil appropriations
84. 34 88. 10 99.76 99. 43 92.85 99. 61 69.82 76. 76 100.00 95. 97 97.81 100. 00 98.75 98. 44 81.81 65. 11 84.56 100. 00 95. 16Total appropriations
100 100 100 100 100 100 100 100 100 100 100 100 100 100 100 100 100 100 100Statistics on Science and Technology — 2003
7
7
P
A
R
T
1
—
G
B
A
O
R
D
1 .3 . 2 .
1 . 3 .2 . ΓΓ ΒΒ ΑΑ ΟΟ ΡΡ
β ψ σ ο χ ιο −ε χ ο ν ο ιχ ο β ϕε χ τ ιϖ ε
β ψ σ ο χ ιο − ε χ ο ν ο ι χ ο β ϕ ε χ τ ιϖ ε
Figure 1.2. shows the distribution of GBAORD by socio-economic
objective for EU-15, the USA and Japan. Figure 1.6., in turn,
highlights the evolution of these different socio-economic
objec-tives within the EU.
The social and human objectives encompass ‘Infrastructure and
general planning of land-use’ (NABS 02), ‘Control and care of the
environment’ (NABS 03), ‘Protection and improvement of human
health’ (NABS 04) and ‘Social structures and relationships’
(NABS 08). The technological objectives are made up of
‘Exploration and exploitation of the Earth’ (NABS 01), ‘Production,
distribution and rational utilisation of energy’ (NABS 05),
‘Industrial production and technology’ (NABS 07) and ‘Exploration
and exploitation of space’ (NABS 09).
The key objective in the EU is ‘Research financed from General
University Funds (GUF)’. During the period 1991-2001, it rose
sig-nificantly from 25.2 to 31.8 % (EUR 18910 million) of the EU-15’s
total GBAORD. This growth was primarily at the expense of the
‘Technology’ and ‘Defence’ objectives, which fell from 24.3 and
21.1 % to 20.1% (EUR 11911 million) and 15.7 % (EUR 8851 million)
of EU GBAORD respectively between 1991 and 2001.
The ‘Human and social’ and ‘Non-oriented research’ objectives
showed little change over this period and followed a similar trend
in rising from 12.9 and 11.0 % to 14.1 (EUR 8250 million) and
14.0 % (EUR 8350 million) respectively.
Finally, the ‘Other civil research’ and ‘Agricultural production and
technology’ objectives, which accounted for around 1.3 to 4.2 % of
total EU GBAORD, remained fairly stable between 1991 and 2001.
Looking at the situation more closely using Table 1.1., it can be
seen that ‘Research financed from General University Funds (GUF)’
is the main priority in over half of the Member States. At EU level,
it alone accounts for almost one-third of GBAORD. In Austria, the
figure is over 60 %. In Germany, Denmark, Greece, Italy, and the
Netherlands, it makes up around or at least 40 % of GBAORD.
The other priorities at EU level are mainly ‘Non-oriented research’
and ‘Defence’ which each claim about 15 %. With regard to
defence, the appropriations allocated are below the Community
average — and 10 % of national GBAORD — in 10 of the Member
States. However, ‘Defence’ is the priority objective for Spain,
France and the United Kingdom, where it accounts for 30.2, 23.2
and 34.9 % respectively. In Sweden, it is not the national priority,
but nevertheless accounts for almost one-fifth of total GBAORD.
In Belgium, Finland and Ireland, the ‘Industrial production and
technology’ objective is important. Its share of the total national
GBAORD in these countries is 24.1, 27.4 and 21.2 % respectively,
which is significantly higher than the Community average of 9.7 %.
Another priority for Denmark, Ireland and Portugal is ‘Agricultural
production and technology’, their allocations of around 12.4 to
14.4 % of total GBAORD being around four times higher than the
Community average. A closer analysis would suggest that this is
linked to the importance of fisheries in these countries.
Statistics on Science and Technology — 2003
8
8
P
A
R
T
1
—
G
B
A
O
R
D
1 .4 .
1 . 4 . ΣΣ ππ εε χχ ιιφφ ιιχχ δδ εε ϖϖ εε λλοο ππ εε νν ττ σσ
ι ν τ η ε Ε Ε Α
ιν τ η ε Ε Ε Α ΧΧ οο υυ νν ττ ρρ ψψ ρρ εε ππ οο ρρττ σσ
This section presents the specific developments in the Member
States on the basis of the country reports where these are
available. Data for some socio-economic objectives are grouped
according to the following plan:
•
‘Human and social objectives’ NABS groups:
2. Infrastructure and general planning of land-use,
3. Control and care of the environment,
4. Protection and improvement of human health,
8. Social structures and relationships.
•
‘Technological objectives’ NABS groups:
1. Exploration and exploitation of the earth,
5. Production, distribution and rational utilisation of energy,
7. Industrial production and technology,
9. Exploration and exploitation of space.
Readers should refer to Table 34 in Part 3 of this publication to
obtain the relevant exchange rates applicable to non-Eurozone
countries when converting the national currency figures into EUR.
1 . 4 .1 .
[image:16.595.51.568.592.768.2]1 .4 .1 . ΒΒ εε λλγγ ιιυυ ""
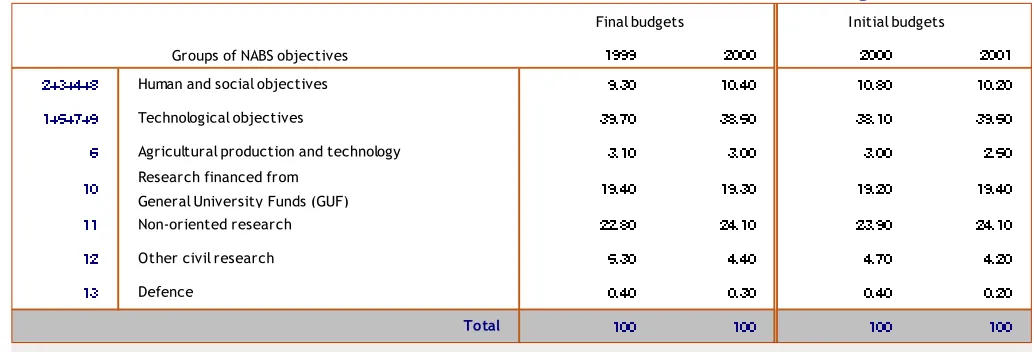
Table 1.2. presents the percentage breakdown of government R&D
budget appropriations for the 1999 and 2000 financial years
(final budgets) and for 2000 and 2001 (provisional budgets), carried
out by the different Belgian public authorities.
The final budget for the 2000 financial year totalled
EUR 1 423.228 million, which is an increase of EUR 41.140 million
over 1999.
The following remarks refer to the final budget data for 1999 and
2000.
It can be seen that over one-third of Belgian government
R&D activities (almost 40 %) have technological objectives
(NABS 1+5+7+9), with just over half of these resources being the
responsibility of the regions.
22.9 % of government R&D activities were devoted (2000) to
industrial production and technology (NABS 7). The Flemish
Community was responsible for over half of this figure.
11.9 % of government R&D activities were devoted (2000) to the
exploration and exploitation of space (NABS 9). These activities are
the sole responsibility of the Federal Authority.
Just over 24 % of these government R&D activities are allocated to
non-oriented research, with half these appropriations falling to the
Flemish Community, followed by the Federal Authority and the
French Community.
Just under a quarter of Belgian government R&D activities come
from general university operating funds; the bulk of these funds
are the responsibility of the Communities.
It can be concluded that between 1999 and 2000 (or even 2001),
there were, in general, only slight variations by objective or by
group of NABS objectives.
Looking at the period from 1989 to 2001, it can be seen that
within total GBAORD:
•
the importance of ‘Technological objectives’ (NABS 1+5+7+9)
increased the most (from 35 % in 1989 to 39 % in 2001); this
percentage is the highest in the EU;
•
‘Research financed from General University Funds’ (NABS 10)
fell from 24 % in 1989 to 19 % in 2001.
Τ η ε χ ο ν τε ξ τ
Belgium’s federal structures — which arose form the reforms of
1980, 1988, and 1993 — give primary responsibility for basic and
university research to the Communities, while the Regions are
primarily responsible for supporting industrial and technological
research. The Federal Government has particular responsibility for
the federal scientific and cultural establishments, space research,
thematic research programmes linked to federal competencies,
nuclear research and Belgian participation in the activities of the
international research bodies.
The Interministerial Conference for Science Policy — CIMPS — and
its administrative bodies are the instruments for dialogue between
the Government, the Regions and the Communities.
Table 1.2.
Distribution of GBAORD by grouped socio-economic objective in %
Belgium — 1999-2001
NB: Sum of constituent parts
may not equal total due to rounding.
Source: Federal Office for Scientific, Technical and Cultural Affairs,
1999 2000 2000 2001
2+3+4+8
Human and social objectives
9.30 10.40 10.80 10.201+5+7+9
Technological objectives
39.70 38.50 38.10 39.506
Agricultural production and technology
3.10 3.00 3.00 2.5010
Research financed from
General University Funds (GUF)
19.40 19.30 19.20 19.40
11
Non-oriented research
22.80 24.10 23.90 24.1012
Other civil research
5.30 4.40 4.70 4.2013
Defence
0.40 0.30 0.40 0.20Total
100 100 100 100Statistics on Science and Technology — 2003
9
9
P
A
R
T
1
—
G
B
A
O
R
D
Π ριο ριτιε σ
Α τ φε δ ε ρα λ λε ϖε λ
Scientific support for the preparation of federal policies
(particu-larly in the area of sustainable development and promotion of
the information society); ongoing support for networks of
excellence (‘interuniversity poles of attraction’); support for the
implementation of space programmes
Α τ ρε γ ιο ν α λ α ν δ χ ο υ ν ιτψ λε ϖ ε λ
Flemish Community/Region: increased support for public funding
of R&D in order to reach total R&D spending of 2 % of gross regional
product in 2000; modernisation and improvement of the system
of R&D financing; promotion of high-technology sectors and
encouragement of the dissemination of technology; promotion of
the social aspects of technology.
French-speaking Community: increase in the appropriations for
research in the field of higher education and, more specifically, in
university institutions.
Walloon Region: maintenance of, or increase in, the overall R&D
effort and in assistance to leading-edge technological sectors, in
particular technological sectors with high employment potential.
Brussels-Capital Region: promotion of SME access to R&D and of
networking of regional R&D potential; greatest possible integration
of R&D results into the economic processes of the region.
1 .4 . 2 .
1 . 4 .2 . ΓΓ ρρεε εε χχ εε
Χ η α ν γ ε σ ιν Γ Β Α Ο Ρ * ιν ν ο + ιν α λ α ν δ ρε α λ τε ρ+ σ
In 2000, the GBAORD budget (final data) amounted to EUR 420.1
million. Compared to EUR 349.4 million in 1999, the GBAORD
budget registered an increase of 20.2 % in nominal terms and
16.3 % in real terms. In 2000, GBAORD as a percentage of GDP,
reached a historical peak rising from 0.31 % in 1999 to 0.35 % —
See Table 1.3.
However, provisional data for 2001 indicate a probable decline of
GBAORD (- 6.6 % in nominal terms and - 9.5 % in real terms). The
absolute figures of GBAORD amount to EUR 392.2 million (current
prices) and EUR 380.1 million (constant prices 2000). This decline
should be attributed in the first place to a temporary decrease of
the inflow of structural funds in Greece. As a matter of fact, 2001
was the last year of financing through the 2nd CSF — Community
Support Framework — while the financing through the 3rd CSF
started to be substantial only in 2002.
Μ ο σ τ ι+ π ο ρτα ν τ σ ο χ ιο −ε χ ο ν ο + ιχ ο β ϕε χ τιϖ ε σ
During the period under review, ‘Research financed from GUF’
remains by far the most important recipient of government R&D
financing. It accounts for the largest share of GBAORD although its
contribution was characterised by a downward trend between the
years 1999 (48.9 %) and 2000 (43.0 %). This trend was reversed in
2001 and its share in GBAORD reached 48.7 %. As a matter of fact,
in 2001, for which provisional data are available ‘Research
financed from GUF’ was the only objective which registered an
increase both in nominal and in real terms (+ 5.8 and + 2.5 %
respectively).
The second most important objective of the Greek government
R&D financing proves to be ‘Non-oriented research’. Its share in
GBAORD increased from 7.8 % in 1999 to 11.3 % in 2000 and then
dropped down to 10.6 % in 2001 (provisional data). Moreover
‘Non-oriented research’ registered an impressive increase in absolute
figures between 1999 and 2000 (+ 74.7 % in nominal and + 68.9 %
in real terms), which can be attributed to the increased financing
through the structural funds of a great number of research projects
(e.g. under the program PENED) just aiming at maintaining
research capacity in the higher education institutes, research
cen-tres and institutes.
‘Industrial production and technology’ showed a progressive
decrease during the period 1999-2001 both as part of the overall
government R&D financing and in absolute figures; this may be due
to the fact that the major research programs in this category have
attained a post-maturity phase with lower rates of financing while,
in the meantime, the launching of new programmes under the 3rd
CSF moves slowly.
As far as it concerns the trends in the financing of biotechnology
and information technologies, the absence of data for NABS
objec-tive 10, due to special methodological aspects of the estimation of
GUF, leads to underestimation of their importance in overall R&D
government budgets.
Table 1.3. shows the breakdown of GBAORD by broad NABS
objectives for the reference years 1999 and 2000 (final budgets)
and for the reference year 2001 (provisional budget). The share of
the group ‘Human and social objectives’ shows an upward trend
while the share of the group ‘Technological objectives’ is in decline
(in absolute figures, however, it remains rather stable).
Table 1.3.
Distribution of GBAORD by grouped socio-economic objective in %
Greece — 1999-2001
NB: Sum of constituent parts
may not equal total due to rounding.
Source: GSRT.
1999 2000 2000 2001
2+3+4+8
Human and social objectives
16.70 23.10 18.26 20.601+5+7+9
Technological objectives
18.30 15.30 20.00 13.206
Agricultural production and technology
7.10 6.10 6.95 5.8010
Research financed from
General University Funds (GUF)
48.90
4 3.00
4 5.78
4 8.70
11
Non-oriented research
7.80 11.30 7.96 10.6012
Other civil research
0.30 0.80 0.30 0.8013
Defence
0.90 0.4
0 0.77 0.
4 0
Total
100 100 100 10010
10
Statistics on Science and Technology — 2003
P
A
R
T
1
—
G
B
A
O
R
D
Table 1.6.
Distribution of GBAORD by grouped socio-economic objective in %
Italy — 1998-2001
NB: Sum of constituent parts
may not equal total due to rounding.
Source: ISTAT.
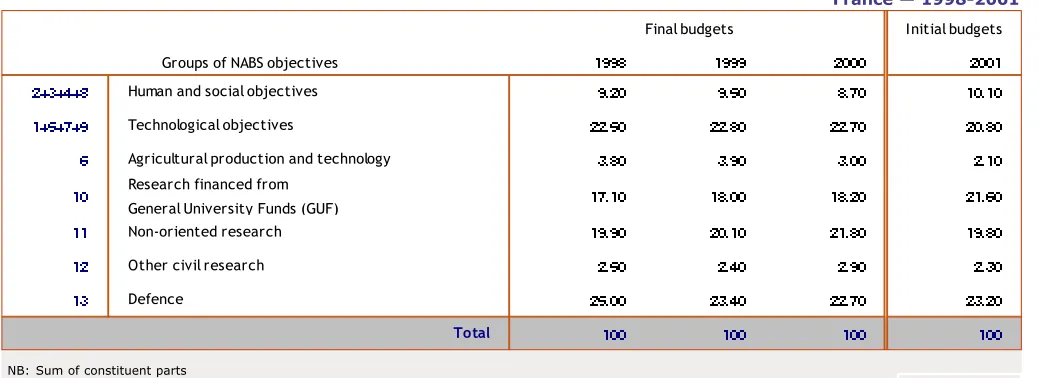
Table 1.4.
Distribution of GBAORD by grouped socio-economic objective in %
France — 1998-2001
NB: Sum of constituent parts
[image:18.595.56.578.81.270.2]may not equal total due to rounding.
Source: MENRT.
Table 1.5.
Distribution of GBAORD by grouped socio-economic objective in %
Ireland — 1999-2001
NB: Sum of constituent parts
may not equal total due to rounding.
Source: Forfas.
Initial budgets
1998 1999 2000 2001
2+3+4+8
Human and social objectives
9.20 9.50 8.70 10.101+5+7+9
Technological objectives
22.50 22.80 22.70 20.806
Agricultural production and technology
3 .803 .90
3
.00 2.10
10
Research financed from
General University Funds (GUF)
17.10 18.00 18.20 21.60
11
Non-oriented research
19.90 20.10 21.80 19.8012
Other civil research
2.50 2.40 2.90 2.3 0
13
Defence
25.00 23
.40 22.70 2
3 .20
Total
100 100 100 100Groups of NABS objectives
Final budgets
1999 2000 2000 2001
2+3+4+8
Human and social objectives
11.00 12.00 13
.27 18.00
1+5+7+9
Technological objectives
31.00 22.00 21.54 1 3
.00
6
Agricultural production and technology
21.00 15.00 14.41 2 3.00
10
Research financed from
General University Funds (GUF)
24.00 20.00 19.24 18.00
11
Non-oriented research
13 .00
33 .00
3
1.54 28.00
12
Other civil research
: : : :13
Defence
: : : :Total
100 100 100 100Final budgets
Initial budgets
Groups of NABS objectives
Initial budgets
1998 1999 2000 2001
2+3+4+8
Human and social objectives
13
.
3
0 17.80 12. 3
0 14.10
1+5+7+9
Technological objectives
23
.00 21.40 26.90 27.60
6
Agricultural production and technology
1.90 1.80 2.20 1.8010
Research financed from
General University Funds (GUF)
48.00 45. 3
0 47.80 4
3 .70
11
Non-oriented research
11.10 11.20 10.00 8.8012
Other civil research
− − − −13