University of Southampton Research Repository
ePrints Soton
Copyright © and Moral Rights for this thesis are retained by the author and/or other
copyright owners. A copy can be downloaded for personal non-commercial
research or study, without prior permission or charge. This thesis cannot be
reproduced or quoted extensively from without first obtaining permission in writing
from the copyright holder/s. The content must not be changed in any way or sold
commercially in any format or medium without the formal permission of the
copyright holders.
When referring to this work, full bibliographic details including the author, title,
awarding institution and date of the thesis must be given e.g.
AUTHOR (year of submission) "Full thesis title", University of Southampton, name
of the University School or Department, PhD Thesis, pagination
UNIVERSITY OF SOUTHAMPTON
Faculty of Engineering, Science and Mathematics
School of Civil Engineering and the Environment
Performance of a propped retaining wall at the
Channel Tunnel Rail Link, Ashford
Jo Clark
•
Thesis for the degree of Doctor of Philosophy
UNIVERSITY OF SOUTHAMPTON ABSTRACT
FACULTY OF ENGINEERING, SCIENCE AND MATHEMATICS SCHOOL OF CIVIL ENGINEERING AND THE ENVIRONMENT
Doctor of Philosophy
PERFORMANCE OF A PROPPED RETAINING WALL AT THE CTRL, ASHFORD Jo Clark
This thesis is based on the field monitoring of a propped bored pile retaining wall installed in an overconsolidated clay. Pile bending moments, prop loads, pore water pressures and lateral earth pressures were logged automatically at intervals of up to 5 minutes
throughout construction (and for 4 years afterwards) and wall deflections were measured during construction, making this the most comprehensive instrumentation project of its kind.
The magnitude of the over-read associated with the use of spade cells (used to measure lateral earth and pore water pressures) in overconsolidated deposits was determined by comparing readings from a spade cell aligned to measure vertical stress with the estimated overburden acting on it as the overburden was excavated. This study adds significantly to the previous data as spade cells have not previously been \lsed in the Atherfield Clay, and the performance of spade cells under a known changing load has not previously been measured in the field.
Analysis of the changes in lateral stress and pore water pressure during the wall installation process showed significant reductions in horizontal stress during wall installation, reducing the ratio of effective horizontal to effective vertical stress, K, from about 1 to nearly the active condition. Following wall installation there was no further change in horizontal stress over a period of about 10 months, during which time no further construction work took place.
Analysis of the data yielded good agreement between pile bending moments estimated from inclinometer and strain gauge measurements in the piles, and the onset of concrete cracking was identified. The components of strain measured in the reinforced concrete props due to shrinkage, creep and applied load were also identified, allowing prop loads to be estimated. A simple equilibrium calculation showed that these agree with the measured wall bending moments and total horizontal soil stresses, demonstrating the overall
consistency of the data collected.
TABLE OF CONTENTS
Index of Figures
Index of Tables
1
2
Introduction
1-1 In situ embedded retaining walls 1-2 Measurement of horizontal stress 1-3 Channel Tunnel Rail Link 1-4 Objectives
1-5 Outline of report
Literature Review
2-1 2-2
Introduction
Review of investigations into retaining wall behaviour 2-2-1 2-2-2 2-2-3 2-2-4 2-2-5 2-2-6 Background Limiting conditions
Development of active and passive pressures Distribution of earth pressures
Change in horizontal earth pressure due to wall installation effects Behaviour of embedded walls in the longer term
2-3 General overview of retaining wall design standards 2-3-1 Choice of soil parameters
2-3-2 Application of safety factors
2-3-3 Calculation of design bending moments 2-3-4 Advice on wall installation effects
2-4 Use of spade cells to measure horizontal stress in overconsolidated clay
2-4-1 Background
2-5 Conclusion
3 Case study
3-1 Introduction
3-2 Geology
3-2-1 Geotechnical data and sample collection 3-2-2 Site location and history
3-2-3 Reported geology 3-2-4 Observed geology 3-3 Geotechnical properties
3-3-1 Plasticity 3-3-2 Bulk density 3-3-3 Soil strength
3-3-4 In situ horizontal stress
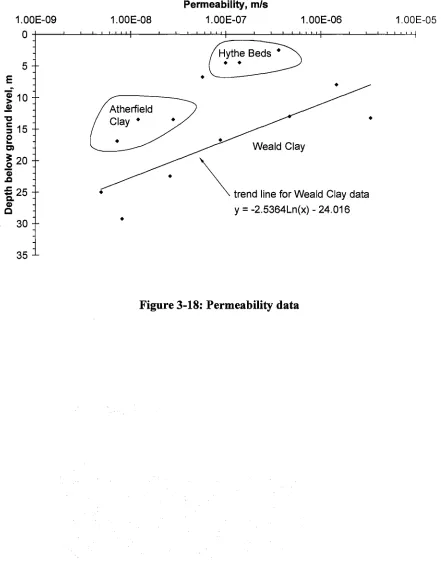
3-3-5 Permeability and Groundwater
3-4 Description of site and geometry of structure at the instrumented section 3-5 Construction sequence and installation of instrumentation
3-5-1 Pile installation 3-5-2 3-5-3 3-5-4 3-5-5 3-5-6 3-5-7 3-5-8 3-5-9 Sand drains
Removal of pile tops Capping beam
Reinforced concrete props
Backfilling and material placement behind North wall capping beam Excavation
Temporary props Base slab
3-5-10 Installation of storm drain
3-6 Data collection and vibrating-wire instrument technology 4 Structural monitoring
4-1 4-2
Introduction Inclinometer
4-2-1 Description and Use
34 36
38
38
38
39 40 41 42 43 45 47 48 49 49 49 50 50 51 51 51 97 97 98 98 4-2-2 Calculation of bending moments from inclinometer data 1 014-3 Vibrating-wire gauges 104
4-3-1 Use 104
4-3-2 Method for calculation of prop loads from strain gauge measurements 104 4-3-3 Method for calculation of bending moments from strain gauges 105 4-3-4 Correction for temperature effects
4-4 Analysis of instrumentation data 4-4-1 Temporary prop data 4-4-2 Base slab data
4-4-3 4-4-4
4-4-5 Comparison between pile bending moments calculated from strain gauges
and inclinometer 118
4-5 Measured changes due to construction events 4-5-1
4-5-2 4-5-3
Temporary props Base slab data
Reinforced concrete props
4-5-4 Pile bending moments measured with strain gauges 4-5-5 Inclinometer data
4-6 Conclusions
5 Horizontal soil stress measurement 5-1
5-2 5-3 5-4
Introduction
Spade cell description Calibration
Evaluation of spade cell over-reading 5-4-1
5-4-2 5-4-3
Introduction Test procedure
Results and Discussion
5-5 Installation effects of a bored pile retaining wall in overconsolidated clay 5-5-1 5-5-2 5-5-3 5-5-4 5-5-5 5-5-6 5-5-7 Introduction
Calibration and installation of spade cells Stabilization of spade cells following insertion
In situ total horizontal stresses and pore water pressures Effective stress profile
Pore water pressure changes during and after wall installation Total horizontal stress changes due to wall installation
5-5-8 Effective stress changes due to wall installation
5-5-9 Total and effective horizontal stress changes after wall installation 5-6 Effect of excavation in front of the wall on horizontal earth stresses 5-7 Conclusions
6 Long term monitoring 6-1 Introduction
6-2 Total horizontal stress and pore water pressure measurements 6-2-1 Installation of storm drain
6-3 Reinforced concrete prop loads 6-4
6-5
7 Conclusions and recommendations
7-1
7-2
Conclusions
Recommendations for further work
Appendix A Wireline borehole BH1 and BH2 logs
Appendix B Piling diary
Appendix C Calculation of flexural rigidity of pile (El)
References
237
238
239
241
250
253
LIST OF FIGURES
Figure 1-1 Map showing the route of the Channel Tunnel Rail Link 7
Figure 2-1 Coulomb's idealized earth pressure distribution 27
Figure 2-2 Fixed earth support 27
Figure 2-3 Free earth support 27
Figure 2-4 Relationship between earth pressure and wall rotation measured by Terzaghi for normally consolidated sand (modified by Simpson,
1992) 28
Figure 2-5 Relationship between earth pressure and wall rotation computed by
Potts and Fourie (1986) for overconsolidated clay 28 Figure 2-6 Influence of movement type on pressure distribution 29 Figure 2-7 Stress distributions behind and in front of (a) stiff and (b) flexible
embedded walls (after Rowe, 1952) 29
Figure 2-8 Over-reading v. cu. After Ryley and Carder, 1995 30
Figure 3-1 The relative locations of the areas described in this work 54
Figure 3-2 Geology of the Weald of Kent 55
Figure 3-3 Layering in the Weald Clay 56
Figure 3-4 Light brown band defining the boundary between the upper and lower Atherfield Clay (observed in the nadir sump) 57 Figure 3-5 Showing the peds and softer matrix of the upper Atherfield Clay 57 Figure 3-6 In situ block sample of the Hythe Beds 58 Figure 3-7 Photo looking into the cutting between RC props during excavation 59 Figure 3-8 Photo showing an elevation of the excavation face 59 Figure 3-9 Shear plane in the upper Atherfield Clay, 50 m from the
instrumented section 60
Figure 3-10 Sketch taken of discontinuity observed in the bottom of the
excavation at the instrumented section 61
Figure 3-11 Geotechnical profile including liquid and plastic limits from wireline
boreholes 1 and 2 62
Figure 3-13 Bulk density v depth 64
Figure 3-14 Effective stress paths of lower Atherfield Clay 65
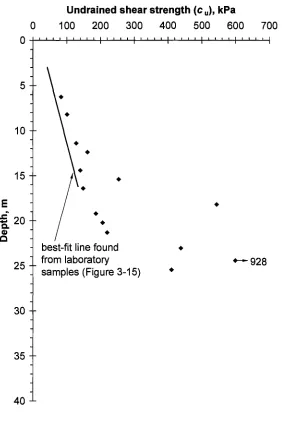
Figure 3-15 Undrained shear strength v depth from laboratory samples and 66 standard penetration test results
Figure 3-16 Undrained shear strength v depth from self-boring pressuremeter test 67
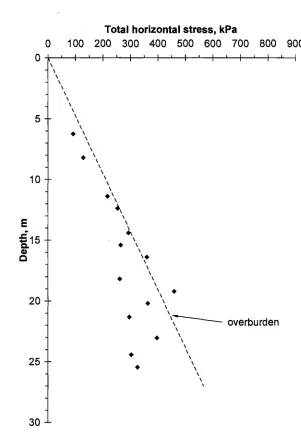
Figure 3-17 Total horizontal stress measured by self-boring pressuremeter 68
Figure 3-18 Permeability data 69
Figure 3-19 Pore water pressure: measurements and assumed profile 70
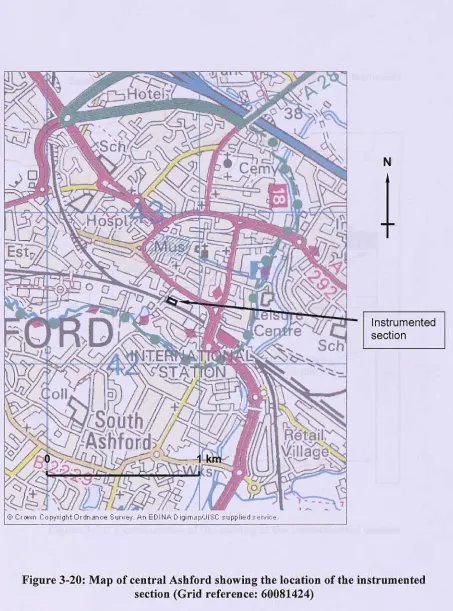
Figure 3-20 Location of the instrumented section 71
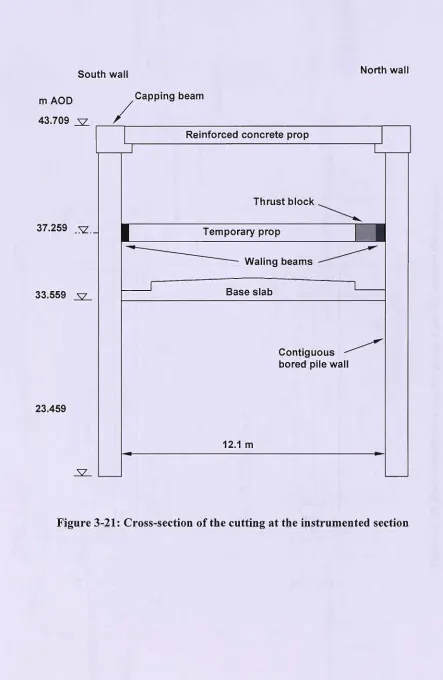
Figure 3-21 Cross-section of the cutting at the instrumented section 72
Figure 3-22 Elevation illustrating the ground profile around the structure 73
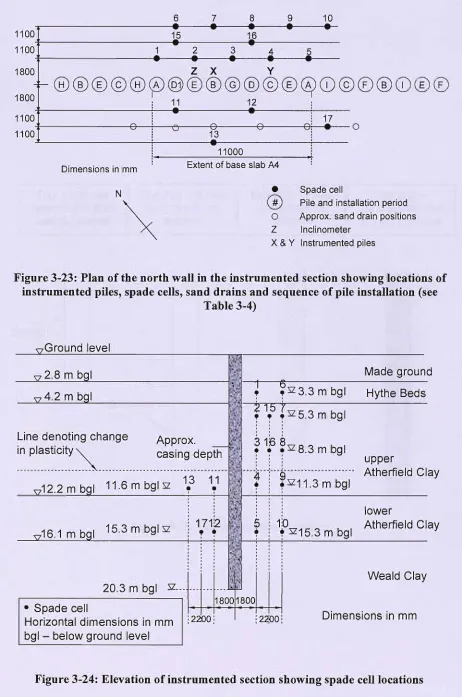
Figure 3-23 Plan of instrumented section 74
Figure 3-24 Elevation of instrumented section 74
Figure 3-25 Pile installation sequence 75
Figure 3-26 Photo showing pile boring 76
Figure 3-27 Photo showing installation of casing 77
Figure 3-28 Photo showing installation of reinforcement cage 78
Figure 3-29 Elevation of instrumented section showing strain gauge arrangement 79
Figure 3-30 Strain gauges for measurement of pile bending moment 80
Figure 3-31 Photo showing sand drain and cable for spade cell 11 81
Figure 3-32 Changes in total horizontal stress and pore water pressure in front of
the wall around the period of sand drain installation 82
Figure 3-33 Excavation either side of the north wall before pile top removal 83
Figure 3-34 Pile top removal 84
Figure 3-35 Wall before construction of capping beam 85
Figure 3-36 Dimensions of capping beam 86
Figure 3-37 Photo showing capping beam 86
Figure 3-38 Preparation for RC prop construction 87
Figure 3-39 Relative location of the instruemented props and piles 88
Figure 3-40 Photo showing instrumented area before excavation 89
Figure 3-41 Compacting backfill in the instrumented section 90
Figure 3-43 Excavation using long-reach excavator 92 Figure 3-44 Temporary prop arrangement and strain gauge housings 92 Figure 3-45 Temporary prop gauges welded onto prop 93 Figure 3-46 Elevation showing base slab arrangement 94 Figure 3-47 Strain gauges wired onto base slab reinforcement 94 Figure 3-48 Storm drain installed behind north wall in November 2001 (Day 864) 95
Figure 3-49 Datalogger setup 96
Figure 3-50 Vibrating-wire gauge 96
Figure 4-1 Inclinometer probe 127
Figure 4-2 Analysis of inclinometer data for face errors 127 Figure 4-3 Movement of wall toe with time measured by the inclinometer 128
Figure 4-4 Correction of inclinometer data 129
Figure 4-5 Movement of wall toe and bottom 10m of inclinometer tube 130 Figure 4-6 Inclinometer measurements taken during construction 131
Figure 4-7 Movement of the top of the wall 132
Figure 4-8 Typical relationship between load and temperature (temporary prop) 133
Figure 4-9 As measured temporary prop loads 134
Figure 4-10 Temporary prop loads corrected for temperature effects 135
Figure 4-11 Base slab readings 136
Figure 4-12 Temperature v load for a typical base slab gauge 137 Figure 4-13 Strains measured in the base slab gauges 138 Figure 4-14 Strain measured in reinforced prop PI 140 Figure 4-15 Strain measured in reinforced prop P4 140 Figure 4-16 Strain measured in reinforced prop P2 141 Figure 4-17 Time/strain versus time for an RC prop gauge at chainage 89+205 143 Figure 4-18 Measured and calculated strain against time for RC prop gauges at
chainage 89+205 143
Figure 4-23 Temperature v load for a typical RC prop gauge 147 Figure 4-24 Difference in strain measured in pile gauges over construction period 148 Figure 4-25 Strain measurements over period of construction for some gauges 149 . Figure 4-26 Deflections measured in pile Z around time of Excavation Phase 2
and Temporary Prop Removal 150
Figure 4-27 Photos showing bulge in pile concrete 151 Figure 4-28 Strains measured in Pile Y over the 30 days after excavation and 152
before Base Slab Construction
Figure 4-29 Bending moments calculated before and after Excavation Phase 2
from inclinometer and strain gauge measurements 154 Figure 4-30 Bending moments calculated before and after Temporary Prop
Removal from inclinometer and strain gauge measurements 155
Figure 4-31 Individual temporary prop loads 156
Figure 4-32 Pile Y bending moments plotted against time (below base slab) 158 Figure 4-33 Pile Y bending moments plotted against time (above base slab) 159 Figure 4-34 Pile X bending moments plotted against time (below base slab) 160 Figure 4-35 Pile X bending moments plotted against time (above base slab) 161
Figure 5-1 Spade cell 181
Figure 5-2 Spade cell calibration equipment 182
Figure 5-3 Equipment for drilling horizontal borehole 183
Figure 5-4 Nadir sump plan and elevation 184
Figure 5-5 Spade cell: uncovered in excavation 185
Figure 5-6 Total vertical stress measured by spade cell in nadir sump 186 Figure 5-7 Elevations and plans detailing the excavation of material above the 187
spade cell in the nadir sump
Figure 5-8 Measured total stress versus overburden 188 Figure 5-9 Nadir sump spade cell stiffness calibration ]89
Figure 5-10 Finite element analysis mesh ]90
Figure 5-11 Measured and calculated vertical stresses against overburden 191 Figure 5-12 Over-read error: measured and calculated from limit equilibrium
analysis 192
Figure 5-13 Comparison between spade cell readings corrected by 0·35 Cu and
Figure 5-14 Spade cell installation 194 Figure 5-15 Spade cell measurements taken between their installation and wall
installation 195
Figure 5-16 Stabilized readings of total horizontal stress and pore water pressure
from all spade cells (before wall installation) 196
Figure 5-17 The profile of
0\0
with depth 197Figure 5-18 Piezometer readings over the period of wall installation 198 Figure 5-19 Pore water pressures measured before, during and 10 months after 199
wall installation
Figure 5-20 Total horizontal stress measurements taken during the period of wall
installation 200
Figure 5-21 Pile installation sequence for the elastic analysis and Mohr circle showing calculation of correction for stress change measured on
spade cell 201
Figure 5-22 Measured reduction in total horizontal stress normalised with respect
to the in situ total horizontal stress 202
Figure 5-23 Reduction in total horizontal stress due to installation of pile nearest to spade cell only with distance from the wall compared with the
elastic prediction 203
Figure 5-24 Total horizontal stresses measured by all spade cells before wall 204 installation and by those 1·275 m from the edge of the wall after wall
installation
Figure 5-25 Change in total horizontal stress 205
Figure 5-26 Effective horizontal stresses measured by all spade cells before wall 206 installation and by those 1·275 m from the edge of the wall after wall
installation
Figure 5-27 Change in effective horizontal stress 207 Figure 5-28 Total horizontal stress measured before, during and 10 months after
wall installation 208
Figure 5-29 Total pressure and pore water pressure measured 1·275 m behind the
wall during the construction period 210
Figure 5-30 Total pressure and pore water pressure measured 2·375 m behind the
wall during the construction period 211
Figure 5-31 Total pressure and pore water pressure measured 3·475 m behind the
wall during the construction period 212
Figure 5-32 Total horizontal stress and pore water pressure measured in front of
the wall during the construction period 213
Figure 5-33 Measured bending moments and bending moments calculated from
Figure 5-34 Measured and estimated total horizontal stresses 215
Figure 6-1 Long-term total horizontal stress measured 1·275 m behind the wall 220 Figure 6-2 Long-term pore water pressure measured 1·275 m behind the wall 221 Figure 6-3 Long-term total horizontal stress measured 2·375 m behind the wall 222 Figure 6-4 Long-term pore water pressure measured 2·375 m behind the wall TY' ---'
Figure 6-5 Long-term total horizontal stress measured 3·475 m behind the wall 224 Figure 6-6 Long-term pore water pressure measured 3·475 m behind the wall 225 Figure 6-7 Long-term total horizontal stress measured in front of the wall 226 Figure 6-8 Long-term pore water pressure measured in front of the wall 227 Figure 6-9 Total horizontal stress and pore water pressure measured 1·275 m 228
behind the wall over period of storm drain installation
Figure 6-10 Total horizontal stress and pore water pressure measured 3-475 m 229 behind the wall over period of storm drain installation
Figure 6-11 Immediate response of spade cells nearest to excavation of storm 230 drain trench
LIST OF TABLES
Table 3-1: Geological succession 34
Table 3-2: Soil parameters of the Atherfield Clay and Weald Clay 40
Table 3-3: Dates of main construction events 44
Table 4-1: Example of inclinometer data analysis and correction using face errors: 41·593
mAOD 99
Table 4-2: Flexural rigidity of concrete piles 105
Table 4-3: The cracking moment of the wall, Mer, calculated by different methods 106 Table 4-4: Values of a and b calculated for all gauges at chainage 89+205 m 111 Table 4-5: amount of strain occurring due to shrinkage and equivalent load indicated by
this strain for the props at the instrumented section 112 Table 4-6: Values of constants for best-fit line to stiffness/time relationship (to 5
significant figures) 114
Table 4-7: Changes in deflection, 8, (mm) (relative to the toe) and changes in curvature, K, (x 103m-I) (from the 5th order polynomial curve fit) over periods of pile cracking.
Positions where cracks have occurred are highlighted. 1 17 Table 4-8: Changes in RC prop load due to excavation directly under individual props 121 Table 4-9: Load at specific stages of construction 121
Table 5-1: Details of nadir sump excavation 165
Table 5-2: Measured and estimated total horizontal soil stress behind the wall 177 Table 5-3: Measured and estimated total horizontal soil stress in front of the wall 178 Table 5-4: Measured and calculated bending moments 178 Table 5-5: Increase in prop load over period where no construction activities were carried
PAPERS ARISING FROM THIS THESIS
Clark, J., Richards, D.J. and Powrie, W. (2004). Wall installation effects - preliminary findings from a field study at the CTRL, Ashford. Proc. of the Skempton Memorial Conference, London.
Richards, D.J., Clark, J., Powrie, W. and Heyman, G. (2005). An evaluation oftotal horizontal stress measurements using push-in pressure cells in an overconsolidated clay deposit. Proc. Inst. Civ. Engrs. Geotech. Engng - acceptedfor publication.
Clark, J. and Richards, D.J. (2005). Measurement of bending moments in concrete. Proc. 16th Int. Con! Soil Mech. Grnd Engng., Japan.
ACKNOWLEDGEMENTS
First I must thank my supervisor David Richards for his valuable support and
encouragement throughout the fieldwork, analysis and write-up periods of this work. I would also like to thank William Powrie and Chris Clayton for advising me and all three for being a fantastic combination of mentors.
The work described in this thesis was carried out with the support of the Engineering and Physical Sciences Research Council, (EPSRC), Rail Link Engineering, Union Railways and Skanska.
I would particularly like to thank, Howard Roscoe, Gary Holmes (who's invaluable support as a surrogate supervisor will not be forgotten), Fleur Loveridge, Hilary Shields, Adam Chodorowski, Alex Pendleton, Vernon Pilcher, David Twine and the site staff at Ashford Contract 430. I would like to thank Richard Wilson for collecting the bulk of the very high quality inclinometer readings.
I would like to thank the Geotechnical Group the many other members of the School of Civil and Environmental Engineering who have made my experience working at the University of Southampton so enjoyable. Of particular note are Harvey Skinner, Antonis Zervos, Michelle Theron, Martin Rust, Geoff Watson, Joel Smethurst and my office mates.
Thank you to my parents and brother for leaving me to it when I asked, for help with proof reading, for their constant support, and particularly for putting me up and feeding me, often at late notice, during the fieldwork period.
If it wasn't for Nellies heroes I would have completed this work much sooner, but would be a much poorer soul for it.
1
INTRODUCTION
1-1 In situ embedded retaining walls
In situ embedded retaining walls are formed by installing a structure in a pre-excavated
cavity in the ground and removing the soil from one side of the structure to form a vertical retaining wall. The term in situ is used to indicate that the wall has been constructed on site from raw materials (fresh concrete and steel reinforcement). To provide stability, the bottom of the wall remains embedded in the soil and sometimes props are used, for example at the top ofthe wall, to provide extra support. These walls are typically used to form basements and cuttings in urban areas throughout the world, where space is
restricted.
vertical stress ratio compared to other natural soil deposits) have generally calculated much higher bending moments and prop loads than both those obtained using
conventional limit equilibrium methods based on fully active pressures behind the wall and those observed directly in the field (e.g. Potts & Fourie, 1984 & 1985; Tedd et 01.,
1984).
There are many uncertainties associated with the design of in situ embedded retaining walls in overconsolidated deposits, for example: the effect of their installation on the stress state of the surrounding soil; the equilibrium pore water pressures and their effect on the overall wall stability; and the long-term horizontal stress acting on the wall. These issues have been the subject of considerable research over the last few decades, including several projects which used instrumentation andlor in situ testing to investigate the behaviour of walls installed in overconsolidated clays (e.g. Garrett & Barnes, 1984; Tedd et ai., 1984;
Symons & Tedd, 1989; Ng, 1992; Symons & Carder, 1993; Carswell etai., 1993). In order to further investigate the long-term behaviour of retaining walls, attempts have been made to analyse walls already in service (Symons & Tedd, 1989; Carder & Symons, 1989; Symons & Carder, 1990).
Some of these field studies have investigated the effect of in situ embedded retaining wall installation on the stress state of the surrounding soil (e.g. Tedd et ai., 1984; Symons &
Carder, 1993) as it is generally accepted that the effect of installing such a wall influences its subsequent behaviour in terms ofloads and bending moments (Gunn et ai., 1993;
Powrie & Kantartzi, 1996). Significant reductions in horizontal stress were observed in the field studies. In addition, wall installation may cause significant ground movements
(which may be highly unacceptable) and its contribution to the recent stress history of the soil will affect the subsequent stress-strain response of the soil (Powrie et
at.,
1998). Using finite element analysis, Powrie & Li (1991) used a simplified technique to model wall installation and calculated smaller wall bending moments than those obtained by Potts &Fourie (1984 & 1985), which were closer to those measured in the field. However, the process of wall installation in panels or piles is complex and three dimensional, so that the magnitude, extent and longevity of the stress reduction associated with in situ wall
installation are all highly uncertain issues.
Many design standards are used for the design of in situ embedded retaining walls (including CIRIA 104 (Padfield and Mair, 1984); CIRIA C580 (Gaba et ai., 2003);
2000) and each contains differing advice on the method of analysis, use of factors of safety and selection of input parameters. The overall stability of these walls and conditions at collapse have been studied in depth (e.g. Burland et aZ., 1981; Symons, 1983; Bolton &
Powrie, 1987; 1988), however the number of standards in use illustrates clearly that there are still many uncertainties as to the best method for design.
A better understanding of the changes in stress that occur on installation of an in sitll retaining wall, during excavation in front of the wall and in the long-term, could result in better estimates of prop loads, wall bending moments and ground settlements than were possible in the past, and lead to more economical designs. In this thesis the results from a field study carried out on a section of in situ embedded retaining wall which forms part of the Channel Tunnel Rail Link at Ashford, Kent, are presented and discussed. Strain gauges were used to measure permanent and temporary prop loads and wall bending moments, and push-in spade-shaped pressure cells were used to measure total horizontal stress and pore water pressure in the soil adjacent to the wall. Conclusions are drawn regarding the magnitude, pattern and longevity of horizontal stress changes due to wall installation and the overall stability of the wall. Data collection is ongoing, and data that describe the performance of the wall and the soil stresses existing 6 years after the retaining wall was installed and 4 years after construction was completed are included in this thesis.
Observations are made on the long-term behaviour expected from consideration of the measurements taken in the 4 years since construction was completed.
1-2 Measurement of horizontal stress
A number of previous retaining wall fieldwork studies utilised push-in spade-shaped pressure cells (commonly known as spade cells), to measure horizontal soil stresses as they are relatively cheap, easy to install and give reasonably reproducible readings (Tedd
Due to the considerable uncertainty regarding the magnitude of the over-reading and the factors that may affect it, it is advisable to directly determine this over-reading wherever possible until more data are available. As part of the work for this thesis a study was carried out to evaluate the magnitude of the over-read given by a spade cell installed in Atherfield Clay - a stiff, overconsolidated clay - which exists at the site of the CTRL at Ashford. A spade cell was installed horizontally in the ground, aligned to measure vertical stress. The soil above the spade cell was excavated in stages over a period of several weeks, and at each stage the overburden was calculated and compared with the reading in the spade cell. Additionally, measurements of in situ horizontal stress obtained using the spade cells installed during the main instrumentation project have been compared with self-boring pressuremeter readings. In line with other recent research, the over-read due to the installation process has been expressed in terms of the undrained shear strength of the soil.
1-3 Channel Tunnel Rail Link
The Channel Tunnel Rail Link (CTRL) is the largest construction project in the UK and Britain's first new railway for over a century. It consists of 109 km of railway which starts at the Channel Tunnel entrance at Folkestone and ends at St. Pancras station in Central London (see Figure 1-1). It is being constructed in two sections: Section 1 consists of74 km of track running from the Channel Tunnel to North Kent. Construction began in October 1998 and Section 1 opened in September 2003. There are two stations included in Section 1, at Ashford in mid-Kent and Ebbsfleet in North Kent, just south of the River Thames. Section 2 takes the CTRL under the River Thames and through London to St Pancras, with a station in North London at Stratford. Construction of Section 2 began in July 2001 and is due to be completed in early 2007.
1-4 Objectives
The objectives of this project are:
• To collect continuous field data, over the entire period of construction and into the long-term, from an instrumented section of a propped in situ embedded retaining wall in an overconsolidated clay.
• To investigate the changes in the horizontal stresses and pore water pressures in the soil during installation of the bored piles that form the retaining wall.
• To investigate the wall movements and the development of prop loads and bending moments associated with a retaining wall embedded in an overconsolidated clay, and to relate these data to the horizontal stresses and pore water pressures
measured behind and in front of the monitored wall section. • To analyse the observed performance.
• To investigate the performance of the spade-shaped pressure cells used in this study.
This thesis describes work carried out towards the realization of these objectives, as well as suggestions for future work.
1-5 Outline of report
Chapter 2 contains a review of retaining wall design, with references to previous
instrumentation projects, model testing and studies that used finite element techniques to analyse the performance of retaining walls. This chapter also includes details of the use of spade cells to measure horizontal stresses in overconsolidated deposits.
In Chapter 3 the case study is described. This chapter includes details of the local geology, the geometry of the structure, the construction sequence and details of the instrumentation used to monitor the performance of the structure and the stress changes in the adjacent soil.
deflection and prop load data at various significant stages during construction are presented.
In Chapter 5 the horizontal soil stress measurements are described in greater detail. The instrumentation used to measure horizontal soil stresses and pore water pressures is evaluated by means of a study in which the readings from a spade cell aligned to measure vertical stress were compared with the estimated overburden acting on it (calculated from bulk density measurements). The horizontal stress and pore water pressure data collected during wall installation and excavation of the cutting are presented and analysed.
5'
StratfonL
..
-
.····
....
[image:23.812.51.791.46.505.2]-(.$t Pancta's
2
LITERATURE REVIEW
2-1 Introduction
This chapter contains a general review of retaining wall design, including the effects of wall installation on in situ horizontal soil stress. Work undertaken to study retaining wall behaviour in similar field studies and using finite element analysis techniques is
summarised, and the sometimes differing advice provided by the most regularly used design guidelines is described. This chapter also includes a background to the use of push-in spade-shaped pressure cells (spade cells) to measure horizontal stresses push-in
2-2 Review of investigations into retaining wall behaviour
2-2-1 Background
There are essentially two design stages required for embedded retaining wall design: 1. determination of the depth of embedment required to prevent overall collapse of
the soil/structure as a whole and
2. design of the wall member and ancillary elements such that they are strong enough to support the consequential forces and bending moments induced in service. A limit equilibrium analysis is usually used to calculate the depth of embedment of the wall, and a factor of safety is applied to one or more of the variables involved to ensure against global collapse. The structural elements are then designed to carry the bending moments and loads which are expected as a result of the geometry determined by the limit equilibrium analysis. Separate consideration is given to the requirements for the working condition and the ultimate failure state, as deformations occurring under the ultimate state may be well beyond those that are acceptable under working conditions.
The following sections contain a brief outline of retaining wall design in which the various components of design and the choices that must be made are discussed.
2-2-2 Limiting conditions
Most modem codes of practice use limit state design principles, where limits are set, e.g. a maximum soil loading or a maximum wall deflection, and the corresponding structural forces are found by assuming the structure is on the verge of exceeding these criteria. As previously mentioned stability and displacement are considered separately; stability is considered to be the primary aim (the ultimate limit state, ULS) and displacements are usually only considered as a secondary serviceability issue (serviceability limit state, SLS). However, displacements can often become a ULS, for example, if the displacements cause ground movements that affect nearby structures or services, or if they cause
project, and therefore the designer must have a full understanding of the overall project and surrounding factors before the serviceability criteria can be defined.
The principle of analysing retaining wall behaviour by determining the forces present when the structure is on the verge of collapse began with Coulomb (1776), who developed an upper bound solution for retaining wall analysis by assuming a planar wedge failure mechanism (Figure 2-1) and derived the limiting force as a function of depth behind the wall. Coulomb's solution produces sufficiently accurate results despite the inaccurate assumption that the wedge has a plane failure surface. More recent work in which the lower part of the sliding wedge was assumed to have a curved boundary, as is observed in model tests, produced equations that were considered overly complicated for practical use (Terzaghi, 1943).
Rankine (1857) developed a lower bound solution by assuming that the earth pressures acting on the wall held it at the limit of equilibrium. He derived limiting active and passive earth pressure coefficients (Ka and Kp respectively), given by the ratio of effective
horizontal stressl, cr'h, to effective vertical stress, cr'v (Equation 2-1) and determined the orientation of the surfaces of sliding. (The' at rest' or in situ earth pressure coefficient is denoted by Ko.) The active state occurs when the rate of increase of horizontal earth pressure is slower than for the vertical earth pressure (in absolute terms), in this case behind a retaining wall, and the passive state occurs where the rate of increase of horizontal earth pressure is faster than for the vertical earth pressure, e.g. in front of a retaining walL Coulomb and Rankine's solutions are identical for a smooth wall with a horizontal surface to the retained soil and a linear lateral pressure distribution.
,
K = 0' h 0" v
Equation 2-1
Coulomb's method underestimates the active pressure and overestimates the passive pressure, and hence may tend to an unsafe solution. Because Rankine's method relies on static equilibrium it cannot take account of wall friction, unlike the Coulomb method, and therefore overestimates the active pressure and underestimates the passive pressure, producing an inherently safe (although unnecessarily costly) embedment depth. To account for this, earth pressure coefficients have been developed which can be applied to
K to take wall friction into consideration (British Standards Institution, 1995; Gaba el ai., 2003).
Idealized stress distributions used in limit equilibrium analyses are shown in Figures 2-2 and 2-3. The fixed earth support method assumes that fixity develops close to the wall toe so there is no lateral movement at this point. The free earth support method assumes that the wall toe is free to move laterally. Unpropped embedded retaining walls rely entirely on an adequate depth of embedment for their stability and so the fixed earth support method must be used. Retaining walls propped at the crest tend to fail by rotation about the prop level, so the free earth support method is usually used. It has been suggested that the fixed earth support method can be used for analysis of propped walls: this is discussed in Section 2-2-4.
2-2-3 Development of active and passive pressures
The limiting earth pressure coefficients for the active and passive states, Ka and Kp
respectively, are given in Equations 2-2 and 2-3, where
¢/
is the soil strength or angle of friction and is given in degrees.2 (These equations are derived from consideration of the Mohr circle of stress for a soil element on the verge offailure; see for example Powrie, 2004).K = I-sin¢'
a l+sin¢'
Equation 2-2
K =l+sin¢' p I-sin¢'
Equation 2-3
In order for active and passive pressures to be mobilized it is necessary for deformation or displacement of the wall to take place. The amount of displacement necessary depends on the type of soil and its overconsolidation ratio. 3
Soils such as sands and normally consolidated clays are close to their active limit at the in situ state, i.e. the horizontal earth pressures are comparatively low (Ko < 0'7). In such
2 Tan ~ is analogous to the coefficient of friction, f..l, in the equation: F = f..l N where F is a force pushing against a normal force, N.
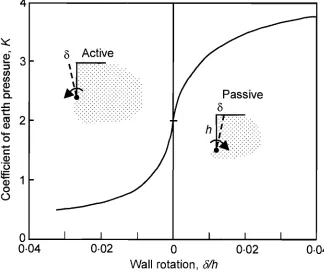
materials only a small movement of the structure is required to achieve full active conditions behind the wall, but relatively large movements, which may be unacceptable under working conditions, are required to achieve full passive conditions in front of the wall. This was shown in large-scale model tests (Terzaghi, 1934) in which a wall was rotated into and away from a bed of sand; the results are shown in Figure 2-4.
Overconsolidated clays (Ko > 1) have high horizontal earth pressures and are therefore often closer to the passive limit of the soil, so only small movements of the structure are needed to achieve passive conditions in front of the wall, but large, potentially
unacceptable movements are necessary to achieve active conditions behind the wall. Potts
& Fourie (1985) used finite element analysis to show that for an overconsolidated clay with Ko = 2, a similar amount of movement is required to reach passive and active
conditions (see Figure 2-5). However bending moments measured in the field (Tedd e/ 0/., 1984) and in centrifuge model tests (Bolton and Powrie, 1988) have not shown this to be true in practice. In addition, Simpson (1992) argues that this study should be treated with caution because it was carried out using a linear elastic soil model until it reached its maximum shear strength, therefore not allowing for large stiffness at small strains (as discussed by Burland et af., 1979).
Powrie et af. (1998) undertook triaxial tests on samples of overconsolidated kaolin to investigate the total stress paths undertaken by elements of soil in front of and behind a retaining wall during wall installation and excavation in front of the wall. They found that the process of wall installation has a considerable influence in reducing the horizontal stresses and therefore predicted that during excavation in front of a retaining wall, only small movements of the wall are required to bring the earth pressure distribution close to its active limit.
The factors that affect the extent to which passive or active pressures can be achieved are still not well understood, particularly in the case of overconsolidated clay. In addition, the distribution of stress on a retaining wall varies significantly from the idealised stress distributions in Figures 2-2 and 2-3, as discussed in the following section.
2-2-4 Distribution of earth pressures
1954), Tschebotarioff(1951) and Rowe (1952,1955 & 1956), studied the distribution of pressure on retaining walls and the effect of wall flexibility on the bending moments and prop/anchor loads.
As previously mentioned, some authors (e.g. Terzaghi, 1943) recommend the use of the fixed earth support method for the design of propped walls, because the increased fixity at the wall toe affects the distribution of pressure on the wall by raising the point of
application of the passive pressure, thereby decreasing the flexibility of the pile and hence also the maximum bending moment. Terzaghi (1943) also suggested that for a flexible retaining wall (particularly referring to steel sheet piles anchored near the top) and assuming fixed earth support, there can be a further redistribution of earth pressure in certain soils which causes an increase in pressure at the top of the wall around the position of the restraint, and a decrease in pressure in the middle of the wall (see Figure 2-6). This pressure distribution is a form of arching and is maintained solely by shear stresses. Terzaghi stated that the bending moment calculated using the pressure distribution indicated by the curved line in Figure 2-6(a) is less than half that calculated using the linear pressure distribution.
Rowe (1952) undertook model tests with walls of varying flexibility in dense and loose sand (Ko < 0·5) and compared the measured bending moments with those calculated from a limit equilibrium calculation assuming free earth support and triangular pressure
distributions in front of and behind the wall. He showed that for the most flexible walls the observed bending moments were much lower than the calculated values, and that as the flexibility of the wall decreased the bending moment increased to that calculated by the limit equilibrium analysis. This occurs because for a flexible wall the deflection at excavation level is much larger than at toe level, and consequently more passive pressure is mobilized at the top of the zone of soil in front of the wall than for a stiffer wall where e the deflection at excavation level and the toe are similar (Figure 2-7). Rowe (1952) noted that this effect also occurred with a rise in soil density (and hence soil stiffness).
The debate on the use of the fixed earth support method for the analysis of propped or anchored retaining walls has continued. Decreasing the flexibility of the pile decreases its movement and therefore the ability of the soil to reach its active and passive limits. The relatively old retaining wall design standard CIRIA 104 (Padfield and Mair, 1984-discussed in Section 2-3) recommends against use of the fixed earth support method for the design of propped walls embedded in clays, stating that it is not appropriate because of the long-term deformation characteristic of the soil. However, the most recently published guidance on embedded retaining wall design, CIRIA C580 (Gaba et
at.,
2003), states that since modem support systems are somewhat stiffer it is now more likely that such a pressure distribution could exist.Since the development of active (and passive) pressures depends on the degree of wall movement, there is some doubt that these pressures can be realised in overconsolidated deposits with a stiff wall and propping system as little movement is likely to occur. The work described above is, to some extent, of limited application to walls embedded in overconsolidated deposits because it was based on the assumption that active conditions would be met. In addition, the limit equilibrium methods used to calculate forces in cantilever and singly propped walls can not be used for statically indeterminate multi-propped walls; these must be designed using iterative computer aided techniques which give consideration to soil-structure interaction.
Potts & Fourie (1985) used finite element methods to investigate the influence of Ko on bending moments and prop loads. They first carried out an analysis with a similar geometry and soil profile to Rowe's, which produced results which were in good
agreement. They then ran further analyses using the same geometry but with a Ko of 2, and found that increasing Ko produced very high bending moments, greater than the limit equilibrium value. They also found that the bending moments increased further as the stiffness of the wall increased. Potts & Bond (1994) also used finite element analysi s to demonstrate that the bending moment and prop loads increase as wall stiffness and Ko
increase, and that for Ko > 0'5 the maximum bending moment and prop load are greater than the values given by a limit equilibrium analysis. However, this study did not take into consideration the effect of wall installation on horizontal earth pressures around a
retaining wall, which is discussed in the next section.
excavation. They found that top down construction with early installation of a permanent prop at the top ofthe wall, a temporary prop at the excavation mid-height and use of a permanent prop at formation causes minimum ground movements behind the wall. This may affect the amount of stress relief behind the wall and therefore the soil's ability to achieve active pressures.
2-2-5 Change in horizontal earth pressure due to wall installation effects
The installation of a bored pile wall (or a diaphragm wall) in overconsolidated clay causes stress changes in the ground by the following process. On boring, the horizontal stress (ail)
near the hole is reduced. If no support is used, ah at the edge of the borehole is reduced to zero and in the short-term the borehole is held open by shear stresses in the soil. If the soil is soft the hole may collapse quickly, so either a casing or bentonite slurry is used as support until the concrete is poured into place. In this case, ah at the edge of the borehole reduces to the value of the pressure exerted by either the casing or the bentonite slurry. When concrete is poured, ah at the edge of the borehole will increase to the hydrostatic pressure exerted by the wet concrete. During the curing process the heat of hydration causes the concrete to expand, exerting an increased pressure on the edge of the borehole. The concrete then cools, causing shrinkage, and a further pressure change can occur as the soil may swell due to the changes in pore water pressure.
It is well known that the stress state in the soil surrounding an in situ retaining wall is affected by the process of wall installation (Gunn et
at.,
1993; Symons & Carder, 1993; Gourvenec & Powrie, 1999) and that the stress state of the adjacent soil following wall installation may have a significant effect on the behaviour as calculated in a numerical analysis (Potts & Fourie, 1984; Fourie & Potts, 1989; Powrie & Li, 1991). Wallinstallation will affect the recent stress history of the soil and hence its subsequent stress-strain response (Atkinson et
at.,
1990; Powrie etat.,
1998), and in soft soils may cause significant ground movements in its own right (Stroud & Sweeney, 1977; Powrie & Kantartzi, 1996).Powrie (1985) discussed the change in horizontal pressure that might occur on
construction of a diaphragm-type retaining wall, and showed that a soil with Ko
=
2 could experience a reduction in horizontal stress that reduced Ko to just over 1. As previously discussed in Section 2-2-3, Powrie etat.
(1998) found that wall installation had aby the excavation and concreting processes "move the stress state of the soil outside the influence of its geological and pre-installation stress history." Furthermore Simpson and Powrie (2001) noted that if the shear stresses that maintain a difference in the far-field and near field horizontal stresses break down K will tend to no more than unity after
construction.
Tedd et al. (1984) reported results from instrumentation installed to monitor the behaviour of a secant pile retaining wall during wall installation and excavation in front ofthe wall at the Bell Common Tunnel on the M25. They found that ground movements during
installation of the retaining wall accounted for about 30% of the total movements that occurred during the cut-and-cover tunnel construction, which indicates that stress relief took place in the ground over this period. They also measured significant reductions in horizontal earth pressure as a result of wall installation, although it was difficult to
establish the magnitude of these reductions due to difficulties arising from the construction process.
During the field monitoring of other retaining walls in London Clay, Symons & Carder (1993) measured changes in effective horizontal stress due to wall construction of 10% for a bored pile wall (comprising 1·5 m diameter, 24 m long piles installed in London Clay) and 20% for a diaphragm wall. Measurements of water pressure during excavation and concreting showed that after an initial reduction, followed by an increase to levels
sometimes above pre-excavation levels, pore water pressures levelled out to values similar to those measured prior to construction. This has also been observed in centrifuge model tests of diaphragm wall installation processes (Powrie & Kantartzi, 1996).
Numerical analyses of in situ walls in which the effects of wall installation are neglected generally give much higher bending moments and prop loads than both those obtained using conventional limit equilibrium methods based on fully active pressures behind the wall and those observed directly in the field (e.g. Potts & Fourie, 1984 and 1985; Tedd et
ai., 1984). Modelling wall installation by simply reducing the pre-excavation horizontal stress across the entire mesh (Powrie & Li, 1991; Richards and Powrie, 1994) may reduce the calculated wall bending moments. However, the process of wall installation in panels or piles is three-dimensional and the magnitude, extent and longevity of the stress
U sing a plane strain analysis to model the process of wall installation leads to
over-predictions of the magnitude of soil displacements and the degree and extent of horizontal stress relief (Gunn & Clayton, 1992; De Moor, 1994; Ng et
at.,
1995). Therefore some authors have tried to model wall installation in three-dimensions. Ng (1992) modelled vertical and horizontal sections of a retaining wall in plane strain in order to investigate the three-dimensional nature of wall installation effects. He found that horizontal arching plays an important role in restricting ground movements, and that if this effect is ignored ground movements will be over-predicted. He also noted that in clays with very high stiffness at small strains, much stress relief can occur with only a small movement. Using three-dimensional finite element analysis techniques Gourvenic & Powrie (1999) showed that the installation of a diaphragm wall panel affects the horizontal earth pressures on adjacent panels. They also found that soil movements increase markedly for diaphragm panel shape ratios (the vertical dimension (depth) to the dimension in the direction along the wall (width)) ofless than 3, i.e. soil arching is best achieved with a deep, narrow panel (the extreme of which is a pile) rather that a short, wide one.A better understanding of the changes in stress that occur during installation of a retaining wall could result in more realistic estimates of prop loads, wall bending moments and ground movements than have been possible in the past. In this section the data collected during wall installation are described and discussed, and conclusions are made regarding the magnitude, pattern and longevity of horizontal stress changes due to the installation of walls of this type.
2-2-6 Behaviour of embedded walls in the longer term
There is some concern that the high horizontal stresses in an overconsolidated deposit may become re-established in the long-term, despite the reductions that occur during retaining wall installation and subsequent excavation in front of the wall. This is thought to occur because the shear stresses maintaining the difference in the far field and near field horizontal stresses may break down. As pointed out by Simpson and Powrie (2001) it seems unlikely, particularly in the design lifetime of the wall, that if the horizontal shear stresses break down then the vertical shear stresses necessary to produce a Ko of more than 1 will not exist either. Therefore the long-term value of K can be no more than 1.
undertaken on walls that have been in service for a number of years. Analysis of the long-term behaviour of the Bell Common Tunnel (Symons & Tedd, 1989) showed insignificant changes in earth pressure behind the wall and small decreases in earth pressure in front of the wall in the four years after construction. Very small changes in pore water pressure were measured on both sides of the wall.
Symons & Carder (1990) describe data obtained at two retaining wall sites: a cantilever wall and a wall propped just below the carriageway, several years after construction was completed. Measurements of total pressure and pore water pressure were taken in order to determine whether equilibrium conditions had been reached. For the cantilever wall they had, but for the propped wall pore water pressures were still gradually changing.
Measurements taken 150 m and 1·5 m from the cantilever wall showed that significant stress reliefhad occurred due to construction/installation. However, for the propped wall, measurements taken at 16 m and 1·5 m from the wall suggested no stress relief had occurred in this case.
2-3 General overview of retaining wall design standards
A number of standards and guidelines regarding the design of embedded retaining walls are in general use, and they sometimes provide conflicting advice on matters such as: general approach to design, choice of soil parameters, choice of safety factors, estimation of long-term pore water pressures, determination of wall bending moments and the magnitude and distribution of horizontal earth pressure. Some of the guidance documents currently used include:
• BS 8002, the British Standards Code of Practice for earth retaining structures (British Standards Institution, 1994/2001);
• CIRIA 104 (the Construction Industry Research and Information Association Report 104): Design of retaining walls embedded in stiff clay (Padfield & Mair,
1984);
• British Steel Piling Handbook (1997);
• The Highways Agency Design Manual for Roads and Bridges - Volume 2, Section 1, Part 2 - BD 42 Design of embedded retaining walls and bridge abutments
• Eurocode 7. Geotechnical design, Part 1: General rules. (British Standards Institution, 2004);
• elRIA C580, Embedded retaining walls: guidance for more economic design (Gaba et al. 2003). This supersedes CIRIA 104.
CIRIA 104 has proved to be an extremely influential report which is used by 91 % of design engineers (Gaba, 2002), usually in conjunction with one or more of the other more recently released design guidelines. It was written strictly for the design of singly propped or cantilever walls embedded in stiff overconsolidated clay, but its principles have been applied to a wide range of wall types, including multi-propped embedded walls and non-embedded walls. It provides design guidance for permanent and temporary walls. As part ofthe development work for Eurocode 7, designers from countries across Europe were asked to design a retaining wall according to their country's normal design guidelines for a specific project. The UK design, based on CIRIA 104, produced a longer wall than most of the others, leading to questions regarding the severity ofthe recommended values for the factor of safety on soil strength (Fs - described later in Section 2-3-2) in CIRIA 104. BS 8002 is the second most popular guideline after CIRIA 104, being used by 70% of design engineers. It was originally only applicable to retaining structures with a retained height of up to 8 m, but its latest amendment (2001) has increased this to 15 m. Some elements of the design specification in BS 8002 are thought to be rather onerous,
particularly the unplanned excavation and surcharge requirements. These are being revised for a forthcoming version.
The Eurocodes are a set of standards which cover both structural and geotechnical design requirements, where Eurocode 7 is the geotechnical constituent. The codes have been written with the aim of allowing the design process to proceed fluidly from geotechnical to structural design without difficulty or confusion. The Eurocodes were written to be a consistent, internationally agreed set of codes for use throughout Europe and the rest of the World, so that legal disputes over choices made in design can be avoided.
The British Steel Piling Handbook was primarily written for the design of permanent and temporary sheet pile walls.
principles. It states how to "use ... BS 8002 and CIRIA 104 in a way which is compatible with ... BS 5400 (British Standard for steel, concrete and composite bridges, 2000)." CIRIA C580 has been compiled with the intention of forming a comprehensive state-of.-the-art replacement for CIRIA 104, reducing the need for cross-referencing between different design guidelines. It covers the design of temporary and permanent cantilever, anchored, single and multi-propped walls which are embedded in stiff clay, and other tine and coarse grained soils. Walls embedded in soft clay and rock are considered outside the scope of the report.
2-3-1 Choice of soil parameters
Soil parameters for a particular site are determined from a combination of: previous experience and publications; direct measurement of parameters from samples collected during site investigation (usually expensive and therefore of limited number) and indirect measurement of more easily and cheaply collected data for which correlations with the required parameters have been suggested. The most commonly required parameters are the undrained shear strength, cu, the effective angle of friction, <1/ and the effective cohesion,
cr. Determination of these parameters is a difficult process where the cost/output
relationship between the various sample and data collection techniques available must be carefully balanced.
A designer should have a good understanding of the correlations between data collected from difference sources, the factors that influence the values and the uncertainties and risk associated with the often limited data. They can then use their 'engineeringjudgemenC to select suitable parameters. The more recent design guidelines have attempted to advise on this process and to make the designer think in terms of the probability of the parameter having a certain value or range of values.
consideration of moderately conservative and worst credible parameters in conjunction with CIRIA 104.
BS 8002 requires consideration of the 'representative peak', which is generally considered to be analogous with the moderately conservative and the critical state strength
parameters. The more onerous parameters are selected (after the relevant safety factors have been applied) and only one design calculation is undertaken. Eurocode 7 uses
'characteristic' values for the geotechnical parameters, which are described as "a cautious estimate ofthe value affecting the occurrence of the limit state".
The language varies, but in essence the emphasis is for a designer to use their experience to balance low risk with economy.
2-3-2 Application of safety factors
Once the soil parameters have been given design values, a factor of safety, F, is applied to one or more of the parameters in the ULS equation so that an adequate margin of safety is supplied within the embedment depth. There are several different approaches to applying this factor of safety: a factor on passive pressure, a factor on net pressure, a factor on embedment depth andlor a factor on soil strength. Full details of how these different safety factors compare with one another for different soil strengths are given by Burland el al. (1981) - a summary is given below. They go on to suggest a revised definition of the factor of safety for passive failure, Fr.
The factor on passive pressure method, Fp, (used in CP 2) employs a factor on Kp which is
commonly taken to be 2. This is based on the findings of Terzaghi (1934), as described in Section 2-2-3, that (in sand) more wall movement is required to mobilize full passive pressures than active pressures. Since overconsolidated clay is very likely to reach its passive limit in front of the wall, it would be uneconomic to apply a factor of safety on passive pressure in such a deposit.
expressly advises against the use of the net pressure method. Simpson and Powrie (2001) state that the net pressure method is fundamentally unsound and potentially dangerous. As indicated by the name, the factor on the depth of embedment, Fd, requires the
calculated wall depth to be increased (e.g. by a factor of 10%). CIRIA 104 advises that if this method is used then because it is empirically based it should be checked against one of the other design methods.
The use of a factor on soil strength, Fs, is consistent with the way in which factors of safety are applied in structural design. A factor is applied to the main soil parameters: tan
¢l;
the undrained shear strength, Cu; and the effective cohesion, c'; and in effect increases the active pressure and reduces the passive pressure assumed in design. CIRIA 104 provides values for Fs. This method is thought to be the most appropriate approach to design (Simpson & Powrie, 2000) and is the method recommended in CIRIA C580. (CIRIA 104 additionally requires that an unplanned excavation is applied in front of the wall, which should be the lesser of 10% of the retained height of the wall or 0·5 m, and that a minimum surcharge of 10 kPa must be applied to the surface of the retained soil. This produces a rather onerous loading condition that leads to uneconomical designs.) BS 8002 focuses on serviceability requirements and in turn uses mobilization factors, M, which are essentially analogous to Fs, but are designed to restrict displacements for the serviceability limit state. The revised method devised by Burland et al. (1981) gives results consistent with Fs, and so appears to give no real advantage over the use of Fs in design.Eurocode 7 uses limit state principles and partial factors with a design approach which is expressed as:
The Effects of Actions must be Resisted.
In terms of a retaining wall, for example, the' actions' are the loads on the back of the wall; the 'resistance' is the resistance provided by the ground in front of the wall and the wall interface friction, etc.; and the 'effect' is the bending moment induced in the wall and the prop loads. Eurocode 7 includes three design approaches which allow for partial factors to be applied to different combinations ofthe Actions, Effects and/or Resistances.
however for piles and anchors the Resistances, e.g. bearing capacity, are factored.
Eurocode 7 also includes factors that allow for pile design from sensible interpretation of load tests.
2-3-3 Calculation of design bending moments
There are two main methods in common practise for calculating the bending moment in a
wall in Britain. In the first, recommended in CIRIA 104, the wall length is calculated without using safety factors, i.e. the wall embedment depth is found using a limit
equilibrium calculation with unfactored variables. The bending moment derived using this depth of embedment is then multiplied by a safety factor of 1·4 or 1·5 for ULS design of the wall section. In the second method, the wall length derived from using the factored parameters for the stability calculation is used to calculate the bending moment, which is then directly used for the ULS design. The second method often gives a higher bending moment than the first, meaning that if the wall was ever called upon to use its full embedment depth, its strength would not be sufficient to allow it, and it would fail in bending. This inconsistency of length and strength means the walls are either longer than they need to be, or not strong enough (Simpson & Powrie, 2000).
CIRIA C580 and Eurocode 7 use the same method for calculation of the SLS bending moment as CIRIA 104, but Soil Structure Interaction (SSI) analyses may be used to calculate the pressure on the retaining wall and therefore the redistribution of earth pressures due to arching, etc. can be taken into account, in contrast to other methods that use simple linear earth pressure distributions. In addition, CIRIA C580 requires that the wall reinforcement must not be curtailed at the point of zero bending moment, but should be extended to the bottom of the pile. Then, instead of applying a factor of safety to this bending moment for the ULS design, the designer must use the greater of: the value obtained from the most onerous soil parameters expected; a factor of 1'35 times the SLS values and the values calculated in consideration of a progressive collapse.
2-3-4 Advice on wall installation effects
specific guidance about what type of stress changes may occur. CIRIA 104 notes that the installation of a diaphragm wall may reduce the horizontal stress in the soil from its original value. BS 8002 does not give any specific guidance on the stress change that might occur due to the installation process, it only mentions that the ratio of horizontal to vertical stress for the soil at rest should not be used as it is affected by the installation process.
CIRIA C580 goes further, giving guideline values for the reduction in the in situ
horizontal earth pressure coefficient due to wall installation of 10% for bored pile walls and 20% for diaphragm walls installed in overconsolidated clays. These values are based on the work by Symons & Carder (1993) described earlier. It is clear that without further measurements of these stress changes in the field, considerable uncertainties remain and economy of design may not be fully achieved. CIRIA C580 also recommends that for linear elastic soil-structure interaction analyses a lateral earth pressure coefficient of 1 '"is likely to give reasonably realistic bending moments and prop loads". This suggestion in part relies on the fact that in such analyses the stiffness under unloading is generally underestimated.
2-4 Use of spade cells to measure horizontal stress in overconsolidated clay
2-4-1 Background
Spade cells are increasingly used to measure horizontal soil stresses as they are relatively cheap, easy to install and give reasonably reproducible readings. However, pushing a spade cell into the ground generates high local stresses due to the displacement of the soil as the cell is advanced. These stresses reduce over time as the excess pore water pressures generated during the undrained loading dissipate (Tedd et ai., 1990). In natural and placed soft clays, readings stabilize within a few days and there is considerable evidence to show that realistic values of total stress can then be measured (Massarsch (1975); Massarsch et