West Nile Virus-Inclusive Single-Cell RNA Sequencing Reveals
Heterogeneity in the Type I Interferon Response within Single
Cells
Justin T. O’Neal,
a,bAmit A. Upadhyay,
b,dAmber Wolabaugh,
b,dNirav B. Patel,
cSteven E. Bosinger,
b,c,dMehul S. Suthar
a,b*
aDepartment of Pediatrics, Division of Infectious Disease, Emory University School of Medicine, Atlanta, Georgia, USA bEmory Vaccine Center, Yerkes National Primate Research Center, Atlanta, Georgia, USA
cYerkes Genomics Core, Yerkes National Primate Research Center, Atlanta, Georgia, USA
dDepartment of Pathology and Lab Medicine, Emory University School of Medicine, Atlanta, Georgia, USA
ABSTRACT
West Nile virus (WNV) is a neurotropic mosquito-borne flavivirus of global
importance. Neuroinvasive WNV infection results in encephalitis and can lead to
pro-longed neurological impairment or death. Type I interferon (IFN-I) is crucial for
promot-ing antiviral defenses through the induction of antiviral effectors, which function to
re-strict viral replication and spread. However, our understanding of the antiviral response
to WNV infection is mostly derived from analysis of bulk cell populations. It is becoming
increasingly apparent that substantial heterogeneity in cellular processes exists among
individual cells, even within a seemingly homogenous cell population. Here, we present
WNV-inclusive single-cell RNA sequencing (scRNA-seq), an approach to examine the
transcriptional variation and viral RNA burden across single cells. We observed that only
a few cells within the bulk population displayed robust transcription of IFN-

mRNA,
and this did not appear to depend on viral RNA abundance within the same cell.
Fur-thermore, we observed considerable transcriptional heterogeneity in the IFN-I response,
with genes displaying high unimodal and bimodal expression patterns. Broadly,
IFN-stimulated genes negatively correlated with viral RNA abundance, corresponding with a
precipitous decline in expression in cells with high viral RNA levels. Altogether, we
dem-onstrated the feasibility and utility of WNV-inclusive scRNA-seq as a high-throughput
technique for single-cell transcriptomics and WNV RNA detection. This approach can be
implemented in other models to provide insights into the cellular features of protective
immunity and identify novel therapeutic targets.
IMPORTANCE
West Nile virus (WNV) is a clinically relevant pathogen responsible for
recurrent epidemics of neuroinvasive disease. Type I interferon is essential for
pro-moting an antiviral response against WNV infection; however, it is unclear how
het-erogeneity in the antiviral response at the single-cell level impacts viral control.
Spe-cifically, conventional approaches lack the ability to distinguish differences across
cells with varying viral abundance. The significance of our research is to
demon-strate a new technique for studying WNV infection at the single-cell level. We
dis-covered extensive variation in antiviral gene expression and viral abundance across
cells. This protocol can be applied to primary cells or
in vivo
models to better
under-stand the underlying cellular heterogeneity following WNV infection for the
develop-ment of targeted therapeutic strategies.
KEYWORDS
flavivirus, RNA-seq, single cell, type I interferon
M
osquito-borne flaviviruses represent a significant public health burden, annually
accounting for hundreds of millions of infections worldwide that, in certain cases,
can culminate in severe systemic or neuropathological outcomes (1–4). West Nile virus
CitationO’Neal JT, Upadhyay AA, Wolabaugh A, Patel NB, Bosinger SE, Suthar MS. 2019. West Nile virus-inclusive single-cell RNA sequencing reveals heterogeneity in the type I interferon response within single cells. J Virol 93:e01778-18.https:// doi.org/10.1128/JVI.01778-18.
EditorRozanne M. Sandri-Goldin, University of California, Irvine
Copyright© 2019 American Society for Microbiology.All Rights Reserved.
Address correspondence to Mehul S. Suthar, mehul.s.suthar@emory.edu.
*Present address: Mehul S. Suthar, Yerkes National Primate Research Center, Atlanta, Georgia, USA.
Received11 October 2018
Accepted20 December 2018
Accepted manuscript posted online9 January 2019
Published
crossm
March 2019 Volume 93 Issue 6 e01778-18 Journal of Virology jvi.asm.org 1
5 March 2019
on November 6, 2019 by guest
http://jvi.asm.org/
(WNV), a member of the
Flaviviridae
family, causes yearly epidemics of encephalitis and
virus-induced myelitis on a global scale with nearly 50,000 reported cases of WNV
disease and over 21,000 cases of neuroinvasive disease from 1999 to 2016 in the United
States alone (1–4). Currently, there are no licensed vaccines or approved targeted
therapeutics to prevent or treat WNV-infected patients, underscoring the need to better
understand the cellular response to WNV infection (1–4).
Type I IFN (IFN-
␣
/

or IFN-I) is the first line of defense against viral infection and
coordinates the early antiviral programs to restrict viral replication, as well as shape the
adaptive immune response (5–14). Loss of IFN-I signaling in WNV-infected mice results
in uncontrolled viral replication and rapid mortality, demonstrating that the IFN-I
response is required for protective immunity (9, 11, 14, 15). Pattern recognition
receptors (PRRs), including Toll-like receptors (TLRs) and retinoic acid-inducible gene I
(RIG-I)-like receptors (RLRs), detect broad viral signatures, such as 5=-triphosphate
ssRNA or dsRNA, in the cytosolic and endosomal compartments (9, 11, 12, 14). For
flavivirus infection, RLRs are critical for inducing IFN-I and binding to cytosolic viral RNA
signals through adaptor proteins, such as mitochondrial antiviral signaling protein
(MAVS), to activate transcription factors and induce interferon regulatory factor
(IRF)-mediated transcription of IFN-

(
Ifnb1
) and a subset of IFN-stimulated genes (ISGs) (9,
11, 12, 14, 16–22). Signaling in both an autocrine and paracrine manner, secreted IFN-

binds IFN-I receptor (IFNAR1/2 heterodimer) to activate Janus kinases, Jak1 and Tyk2,
which phosphorylate signal transducer and activator of transcription 1 (STAT1) and
STAT2 (7, 9, 10, 12, 18–21, 23–27). Phosphorylated STAT1 and STAT2 form a
het-erodimer and recruit IRF9 to form the ISG factor 3 (ISGF3) complex. The ISGF3 complex
then translocates to the nucleus and induces IFN-stimulated response element
(ISRE)-regulated genes, thereby reshaping the cellular landscape to an antiviral state (5, 7, 9,
12, 18–21, 23–28).
The induction of IFN-I and ISGs within a bulk population of infected cells has been
well characterized. However, mean values obtained via conventional bulk assays mask
transcriptional differences between infected and bystander cells and obscure any
heterogeneity present within the infected population. Recently, single-cell studies have
examined the heterogeneity across virally infected cells. Findings with influenza virus,
poliovirus, dengue virus (DENV) and Zika virus (ZIKV) have revealed extensive variation
in viral RNA abundance within single cells (29–31). Using high dimensional mass
cytometry by time-of-flight (CyTOF) analysis, others have described differences in
IFN-induced and proinflammatory cytokine production in infected and bystander
hu-man dendritic cells following DENV infection (32). Studies examining IFN-I induction at
the single-cell level have used fluorescently tagged cells, single-mRNA molecule
in situ
hybridization, single-cell quantitative PCR (qPCR), and single-cell RNA sequencing
(scRNA-seq) (16–19, 27, 33, 34). Previous studies have found that only a small fraction
of infected cells express
Ifnb1
mRNA (17–19, 27, 34). This is thought to be attributable
to stochasticity in signaling components and downstream signaling cascades, leading
to transcription factor activation or variability in the processes of
Ifnb1
expression,
perhaps at the level of chromatin organization (16–19, 35–37). Using PRR agonists or
nonproductive viral infection, others have demonstrated that IFN-I-dependent
para-crine signaling is pivotal in amplifying the host antiviral response (16–19, 26, 27). Lastly,
single-cell transcriptomic studies have also been used to globally investigate virus-host
interactions and identify novel candidate genes for host-targeted therapeutics (31).
Knockdown screens or knockout studies can only probe a subset of nonessential host
genes, limiting their scope (38–43). However, virus-inclusive scRNA-seq is a powerful
platform for the discovery of novel proviral and antiviral candidate genes in an
unbiased manner as recently highlighted by Zanini et al. with DENV and ZIKV (31).
Altogether, these studies have shed considerable light on the transcriptional
differ-ences present in single cells, and specifically with
Ifnb1
expression and viral RNA
abundance. However, we still lack a thorough understanding of the cellular
heteroge-neity in the IFN-I response following WNV infection. Population-level transcriptional
analyses are valuable and widely used approaches but in certain cases can belie gene
on November 6, 2019 by guest
http://jvi.asm.org/
expression patterns, such as bimodal variation, which can only be observed at
single-cell resolution (18, 27, 33). To better understand the underlying transcriptional
differ-ences across cells with varying viral abundance, we developed WNV-inclusive
scRNA-seq, a modified SMART-Seq protocol that incorporates a virus-specific primer for
parallel recovery of host messenger RNA (mRNA) and viral RNA from single cells. We
found that only a small fraction of cells exhibited robust
Ifnb1
expression, and this did
not significantly correlate with high viral RNA. We observed considerable transcriptional
heterogeneity in ISG expression and viral RNA abundance across cells. ISGs exhibited
both unimodal and bimodal variation and were negatively correlated with intracellular
viral RNA, displaying a steep decline in gene expression with increasing viral
abun-dance. Combining single-cell mRNA sequencing with quantification of
nonpolyadeny-lated viral RNA, we present WNV-inclusive scRNA-seq as a high-throughput technique
for single-cell transcriptome analysis of WNV-infected cells.
(This article was submitted to an online preprint archive [44].)
RESULTS
Population-level analysis of WNV infection in murine fibroblast L929 cells.
We
first modeled WNV infection kinetics in murine fibroblast L929 cells, an IFN-competent
cell line extensively used to study IFN-I-dependent signaling (19, 45). Cells were
infected at a multiplicity of infection (MOI) of 0.1, 1, or 10, as determined on BHK-21
cells, and intracellular viral envelope (E) protein immunostaining was performed at 6,
12, 24, and 48 h postinfection. Infected cells were labeled with WNV E16 antibody (Ab),
which recognizes a domain III neutralizing epitope within the E protein (46). For all
three MOIs, nearly 100% of cells stained positive for intracellular viral E protein by 48 h
postinfection (Fig. 1A). At an MOI of 10, intracellular viral E protein was detected in 99%
of cells as early as 24 h postinfection, suggesting that the majority of these cells were
likely infected during primary virus adsorption (Fig. 1A). For cells infected at an MOI of
1, intracellular viral E protein was detected in 59% of cells at 24 h postinfection (Fig. 1A).
To diminish asynchronous second-round infection, cells were infected with WNV
(MOI of 1) and incubated in the presence of WNV E16 neutralizing Ab (
⫹
Ab) (46).
Inoculation with UV-inactivated WNV served as a nonreplicating input control for
internalized viral RNA, and no expression of viral E protein was detected (Fig. 1B and C).
Notably, limiting
in vitro
spread resulted in a 5.4-fold decrease in the percentage of viral
E protein-positive cells (11%) at 24 h postinfection, corresponding with a comparable
5.2-fold reduction in viral RNA levels (Fig. 1B and C). Collectively, these two conditions,
WNV and WNV (
⫹
Ab), provide a cell population with a range of viral abundance and
another of predominantly bystander cells with which to survey the IFN-I response at the
population and single-cell level in all subsequent analyses.
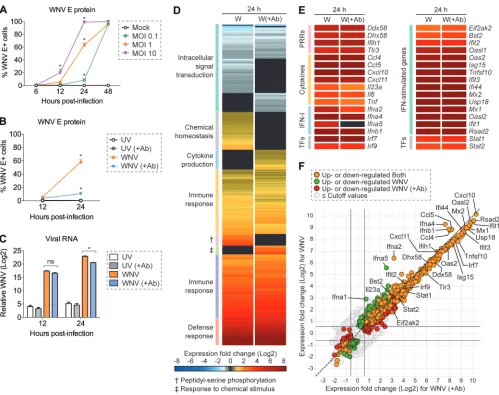
Before pursuing a single-cell approach, we next sought to evaluate transcriptional
changes following WNV infection at the population level by bulk RNA-seq. As expected,
numerous genes associated with the innate immune response and antiviral defense
response were upregulated following infection (Fig. 1D and E). Furthermore, the
majority of these genes were expressed at similar levels independent of reduced
asynchronous second-round infection (Fig. 1D and E). ISGs and PRR genes exhibited a
more consistent level of mean gene expression across these two conditions (Fig. 1E).
Conversely, IFN-I and cytokine genes displayed the most variability in expression
between genes within their respective categories (Fig. 1E). Most notably,
Ifna2
and
Ifna5
displayed
⬃
2-fold-higher levels of expression when allowing for
in vitro
spread,
al-though
Ifna2
dropped outside the preselected significance cutoff (
P
⬍
0.01; Fig. 1E and
F). This population-level analysis provides a contextual fundamental framework from
which to build as we examine the transcriptional differences observed across single
cells. Leveraging single-cell sequencing techniques complemented with viral RNA
detection, we next extended the resolution of our analysis to single cells to better
understand the underlying transcriptional heterogeneity present following WNV
infec-tion.
March 2019 Volume 93 Issue 6 e01778-18 jvi.asm.org 3
on November 6, 2019 by guest
http://jvi.asm.org/
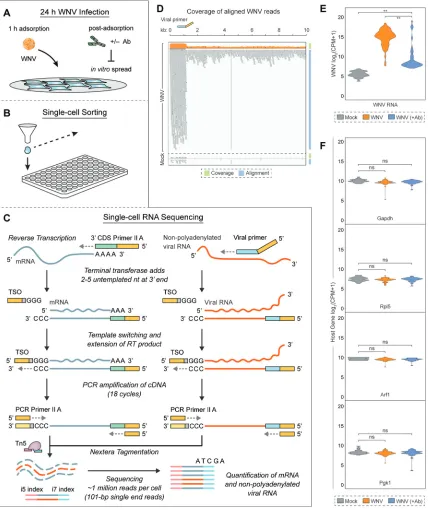
WNV-inclusive scRNA-seq captures mRNA and viral RNA from single cells.
WNV-inclusive scRNA-seq is adapted from the well-established Smart-seq2 protocol
(47) and the commercially available SMART-Seq v4 Ultra Low Input RNA kit (TaKaRa)
used for scRNA-seq. The SMART-Seq v4 protocol is modified to include a virus-specific
primer (WNV SC primer) during the reverse transcription (RT) step. For scRNA-seq
analysis, L929 cells are inoculated with virus for 1 h at an MOI of 1 and then incubated
in the presence or absence of WNV E16 neutralizing Ab (46) for 24 h (Fig. 2A). Viable
single cells are sorted by conventional flow cytometry into 96-well plates containing 10
l of lysis buffer per well (Fig. 2B). In the RT reaction, 3=
SMART-Seq CDS Primer II A
[30-nucleotide poly(dT) sequence with a 5=
25-nucleotide ISPCR universal anchor
sequence (47)] and WNV SC primer (21-nucleotide sequence complementary to
positive-strand viral RNA with a 5=
25-nucleotide ISPCR universal anchor sequence [47])
are added to capture host transcripts and viral RNA, respectively (Fig. 2C). Following
FIG 1Population-level analysis of WNV infection in L929 cells. (A) L929 cells were infected with WNV at an MOI of 0.1, 1, or 10 and incubated for 6, 12, 24, or 48 h (n⫽3). (A and B) Intracellular viral E protein staining was performed by flow cytometry using WNV E16 antibody. (B and C) L929 cells were inoculated with UV-inactivated WNV (UV) or WNV at an MOI of 1 and incubated for 12 or 24 h in the presence (⫹Ab) or absence of WNV E16 neutralizing antibody (5g/ml) to reducein vitrospread (n⫽3). (C) Viral RNA quantification was measured by qPCR, and theCTvalues were normalized to the reference geneGapdhand
represented as the fold change over time-matched mock values. (A to C) Two-way ANOVA with multiple comparison correction was used to test for significance (*,P⬍0.05). (D to F) Cells were infected as described for panel B and examined by bulk RNA-seq analysis at 24 h postinfection (n⫽3). (D and E) Heat map showing mean gene expression values normalized and represented as the fold change over time-matched mock values. Expression fold change values correspond to the color gradient (bottom). (D) Gene cluster description can be found on the left. (E) Expression fold change displayed for a panel of select genes. (F) Scatter plot for comparison of upregulated and downregulated genes in WNV and WNV (⫹Ab) conditions. Cutoff values were as follows: 1.5-fold change andP⬍0.01.
on November 6, 2019 by guest
http://jvi.asm.org/
[image:4.585.43.542.69.464.2]FIG 2WNV-inclusive single-cell RNA sequencing. (A) L929 cells were infected with WNV (MOI of 1) and incubated in the presence of the WNV E16 neutralizing Ab (5g/ml) to limitin vitrospread. (B) Single cells were sorted into 96-well PCR plates containing 10l lysis buffer per well. (C) During reverse transcription (RT), 3=SMART-Seq CDS Primer II A [30-nucleotide poly(dT) sequence with a 5=25-nucleotide ISPCR universal anchor sequence] and a WNV-specific viral primer (21-nucleotide sequence complementary to positive-strand viral RNA with a 5=25-nucleotide ISPCR universal anchor sequence) are added to capture host transcripts and viral RNA, respectively. When the reverse transcriptase reaches the 5=end of both host mRNA and viral RNA, its terminal transferase activity adds two to five untemplated nucleotides that serve as an anchor for the template-switching oligonucleotide (TSO), which allows extension of the RT product with sequence complementary to the universal anchor sequence. PCR Primer II A binds this sequence for concurrent amplification of both host and viral cDNA. In the final library preparation step, transposase 5 (Tn5)-based Nextera tagmentation adds sequencing indices. Illumina sequencing is performed using 101-bp single end reads, thereby quantifying host mRNA and viral RNA from single cells. (B and C) In total, 127 cells were successfully captured and profiled: 25 Mock cells, 68 WNV cells, and 34 WNV (⫹Ab) cells. (D) Coverage and alignment of WNV reads are shown with reference to the WNV genome and WNV SC primer (viral primer) location, andyaxes for coverage are presented in a log10scale. The cells representing the median value for WNV and Mock conditions are shown. (E) Violin plot showing expression as counts per million transcripts (CPM) in log2scale for WNV RNA in all three conditions described in panel A. Wilcoxon rank sum test with continuity correction was performed to test significance (**,P⬍10⫺9). (F) Violin plots showing expression as CPM in log2scale for housekeeping genes. Wilcoxon rank sum test with continuity correction was performed to test significance (ns, not significant;*,P⬍10⫺3;**,P⬍10⫺6).
March 2019 Volume 93 Issue 6 e01778-18 jvi.asm.org 5
on November 6, 2019 by guest
http://jvi.asm.org/
[image:5.585.44.472.74.584.2]template switching, PCR Primer II A served as the primer for parallel downstream
amplification of both host and viral complementary DNA (cDNA) (Fig. 2C). Samples
underwent Nextera tagmentation and were sequenced on an Illumina HiSeq at a depth
of approximately 1 million reads per cell (27, 48). Altogether, we successfully captured
and profiled a total of 127 cells across three conditions: Mock, WNV, and WNV (
⫹
Ab).
The outlined approach delivers exceptional coverage and sequencing depth allowing
for accurate quantification of host transcripts and nonpolyadenylated viral RNA.
Viral RNA was successfully recovered from single cells following WNV infection, and
the majority of WNV reads were aligned with the targeted region of the WNV genome
(Fig. 2D and E). To ensure that the addition of WNV SC primer did not adversely affect
the recovery of host mRNAs, the concentration of WNV SC primer was titrated and
cDNA quality was evaluated on an Agilent 2100 Bioanalyzer. Furthermore, we examined
the levels of housekeeping genes (
Gapdh
,
Rpl5
,
Arf1
, and
Pgk1
) across cells in all three
conditions: Mock, WNV, and WNV (
⫹
Ab). Unsurprisingly, expression of housekeeping
genes was not significantly different between mock-infected and infected conditions,
demonstrating that amplification of viral RNA does not impair recovery of host mRNA
(Fig. 2F).
Heterogeneity in viral RNA abundance and ISG induction at single-cell
resolu-tion.
At the single-cell level, we observed large differences in viral RNA abundance in
the presence and absence of limited
in vitro
spread (Fig. 2E). In the absence of
neutralizing antibody, we detected a wide range of intracellular viral RNA levels, with
97% of cells having greater than 2
10viral RNA counts per million transcripts (Fig. 2E).
Interestingly, only 24% of cells had greater than 2
10viral RNA counts per million
transcripts when limiting asynchronous secondary infection (Fig. 2E). Furthermore, the
heterogeneity of viral RNA abundance in the presence of neutralizing antibody
sug-gests that there might be variability in WNV replication during the primary round of
infection (Fig. 2E); however, this also may be due to a low level of secondary infection
not detectable by intracellular E protein staining at 24 h postinfection. Notably, the
percentage of single cells positive for viral RNA (WNV: 97%; WNV [
⫹
Ab]: 24%) is
markedly higher than the percentage predicted by flow cytometry-based viral E protein
immunostaining (WNV: 59%; WNV [
⫹
Ab]: 11%) for both infection conditions (Fig. 1B
and 2E).
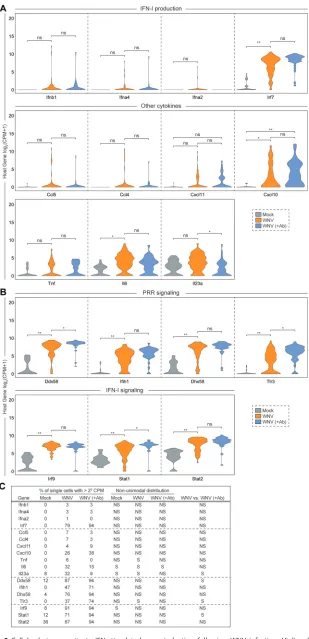
When examining transcriptional dynamics across single cells, we noticed some
interesting trends. Only a small fraction of WNV-infected cells (WNV: 3%; WNV [
⫹
Ab]:
3%) produced more than 2
5Ifnb1
counts per million transcripts (Fig. 3A and C).
Intriguingly, we observed a similar expression signature for
Ifna4
and
Ifna2
despite
greater than 2
5counts per million transcripts of
Irf7
, a transcription factor that drives
IFN-
␣
production (49–51), in the majority (WNV: 79%; WNV [
⫹
Ab]: 94%) of cells (Fig. 3A
and C). Furthermore, we identified three chemokine genes (
Ccl5
,
Ccl4
, and
Cxcl11
) that
displayed comparable cellular distributions to IFN-I genes.
Tnf
, along with other
pro-inflammatory cytokine genes such as
Cxcl10
,
Il6
and
Il23a
, exhibited greater cellular
heterogeneity but still retained a portion of cells with no detectable transcript (Fig. 3A;
WNV: 26%; WNV [
⫹
Ab]: 38%). Genes
Ddx58
and
Dhx58
, which, respectively, encode the
RLRs RIG-I and LGP2 (Laboratory of Genetics and Physiology 2), were highly expressed
with most cells (for
Ddx58
, WNV: 87%, WNV [
⫹
Ab]: 94%; for
Dhx58
, WNV: 76%, WNV
[
⫹
Ab]: 94%) containing greater than 2
5counts per million transcripts (Fig. 3B and C).
Interestingly,
Tlr3
and
Ifih1
, another important RLR gene that encodes MDA5
(mela-noma differentiation-associated gene 5), displayed greater variation in expression
across cells (Fig. 3B). Components of the ISGF3 complex (
Irf9
,
Stat1
, and
Stat2
) are
critical for IFN-I signaling and are induced to greater than 2
5counts per million
transcripts in the majority of cells (Fig. 3B and C; for
Irf9
, WNV: 91%, WNV [
⫹
Ab]: 94%;
for
Stat1
, WNV: 71%, WNV [
⫹
Ab]: 94%; for
Stat2
, WNV: 87%, WNV [
⫹
Ab]: 94%). Next, we
sought to examine the expression patterns for a panel of experimentally validated
WNV-targeting antiviral effector genes (
Rsad2
,
Tnfsf10
,
Ifi44l
,
Oas1b
,
Oas3
,
Ifitm3
,
Eif2ak2
,
and
Mov10
) and two well-established ISGs (
Ifit3
and
Mx1
) (26, 43, 52–60). Antiviral
effector genes feature both unimodal (
Tnfsf10
,
Ifi44l
,
Ifitm3
,
Eif2ak2
,
Mov10
, and
Mx1
)
on November 6, 2019 by guest
http://jvi.asm.org/
FIG 3Cellular heterogeneity in IFN-stimulated gene induction following WNV infection. Violin plots showing single-cell distributions for host gene expression as counts per million transcripts (CPM) in log2 scale. Genes are grouped by categories: IFN-I production and other cytokines (A) and PRR and IFN-I
(Continued on next page)
March 2019 Volume 93 Issue 6 e01778-18 jvi.asm.org 7
on November 6, 2019 by guest
http://jvi.asm.org/
[image:7.585.52.361.70.709.2]and bimodal (
Rsad2
,
Oas1b
,
Oas3
, and
Ifit3
) variation across single cells (Fig. 4). Notably,
several genes (
Ddx58
,
Tlr3
,
Stat1
,
Tnfsf10
,
Eif2ak2
,
Ifit3
, and
Mx1
) revealed significantly
different transcriptional signatures across cells with and without limited
in vitro
spread
(Fig. 3B and C and Fig. 4). Strikingly, most cells have no detectable reads for
Tnfsf10
(WNV: 59%; WNV [
⫹
Ab]: 21%) and
Mx1
(WNV: 53%; WNV [
⫹
Ab]: 15%) when allowing
for
in vitro
spread; however, in the presence of neutralizing Ab, the inverse is true
(Fig. 4).
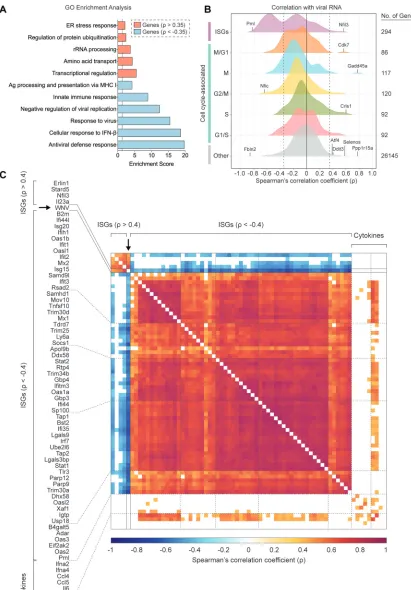
Correlation between host gene expression and viral RNA abundance for single
cells.
Building upon our ability to assess viral RNA abundance in singe cells, we
calculated Spearman’s correlation coefficients for host gene expression and viral RNA
burden across all WNV cells, which spanned a range of viral RNA levels. To
compre-hensively identify pathways that might be linked to viral RNA abundance, we
per-formed gene ontology (GO) enrichment analysis using the online bioinformatics tool
DAVID (61, 62), wherein we independently evaluated all positively correlated (
⬎
0.35)
FIG 3Legend (Continued)
signaling (B). Conditions are as described in Fig. 2A. Wilcoxon rank sum test with continuity correction was performed to test significance (ns, not significant;*,P⬍10⫺3;**,P⬍10⫺6). (C) Table summarizing for each condition: the percentage of single cells with⬎25CPM; whether the distribution was nonuni-modal (P⬍0.05); and the Wilcoxon rank sum test with continuity correction results for the WNV versus WNV (⫹Ab) comparison (NS, not significant; S, significant).
FIG 4Unimodal and bimodal variation in antiviral effector gene expression at single-cell following WNV infection. (A) Violin plots showing single-cell distributions for antiviral effector gene expression as counts per million transcripts (CPM) in log2scale. Conditions are described in Fig. 2A. Wilcoxon rank sum test with continuity correction was performed to test significance (ns, not significant;*,P⬍10⫺3;**,P⬍ 10⫺6). (B) Table summarizing for each condition: the percentage of single cells with greater than 25CPM; whether the distribution was nonunimodal (P⬍0.05); the Wilcoxon rank sum test with continuity correction results for the WNV versus WNV (⫹Ab) comparison; and the experimental system and citation for validated WNV-targeting antiviral effector genes (NS, not significant; S, significant).†, Percentage of single cells with⬎210CPM.
on November 6, 2019 by guest
http://jvi.asm.org/
[image:8.585.45.474.72.407.2]and negatively correlated (
⬍ ⫺
0.35) genes of significance (
P
⬍
0.001). The top
pathways extracted from the GO enrichment analysis for negatively correlated genes
were the antiviral defense response, cellular response to IFN-

, response to virus,
negative regulation of viral replication, innate immune response, and antigen
process-ing and presentation via MHC I (class I major histocompatibility complex molecule) (Fig.
5A). For the positively correlated gene set, the top pathways included transcriptional
regulation, amino acid transport, rRNA processing, regulation of protein ubiquitination,
and the endoplasmic reticulum (ER) stress response, providing a broad description of
viral RNA-correlated genes (Fig. 5A). Next using curated gene lists from published
large-scale ISG screen and single-cell transcriptomic studies (26, 63, 64), we examined
the distribution of correlation coefficients for ISGs and cell cycle-associated genes
subdivided by phase (G
1/S, S, G
2/M, M, and M/G
1). Predictably, the majority of genes do
not correlate with viral RNA abundance, and the distribution of coefficients skews
toward zero (Fig. 5B). When assessing viral RNA correlations for cell cycle-associated
genes, most genes were not significantly positively or negatively correlated, although
minor shifts were observed for S, M, and M/G
1phase genes (Fig. 5B). Interestingly, 124
of 294 ISGs were negatively correlated with viral RNA corresponding with a dramatic
shift in the coefficient distribution (Fig. 5B). As predicted by the GO enrichment analysis,
numerous genes associated with the ER stress response (
Gadd45a
,
Ppp1r15a
,
Selenos
,
Ddit3
,
Atf4
, and others) were strongly positively correlated with viral abundance
(Fig. 5B). A subset of correlated ISGs and panel of noncorrelated cytokine genes are
represented in a correlation matrix (Fig. 5C). Negatively correlated ISGs strongly
clus-tered together with high correlation coefficients approaching 1 (Fig. 5C). Conversely,
ISGs positively correlated with viral RNA only weakly correlated with other positively
correlated ISGs (Fig. 5C). Many cells expressing high levels of IFN-I and proinflammatory
cytokines also featured elevated viral abundance, but not to the extent of reaching
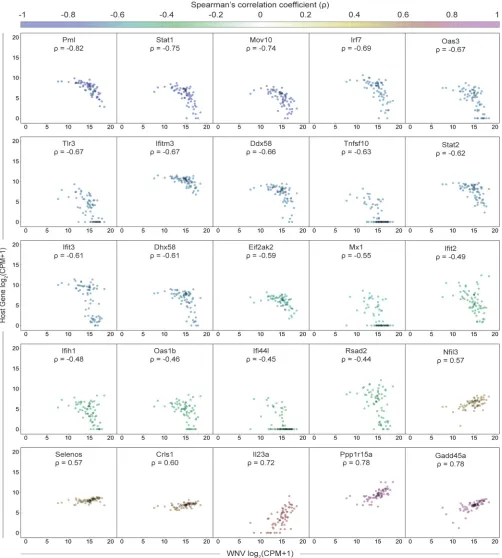
significant positive correlation (Fig. 5C). Scatter plots were generated for a subset of
viral RNA-correlated genes and collated in order of increasing correlation coefficients
(Fig. 6). Trends associated with negatively correlated ISGs mostly featured a precipitous
decline in gene expression as viral RNA levels in single cells exceeded around 2
15counts per million transcripts (Fig. 6). Alternatively, positively correlated genes often
were characterized by slopes near or less than 1 (Fig. 6). For WNV-validated antiviral
effector genes (
Rsad2
,
Tnfsf10
,
Ifi44l
,
Oas1b
,
Oas3
,
Ifitm3
,
Eif2ak2
, and
Mov10
), all genes
are negatively correlated with viral RNA as expected (Fig. 6). Interestingly,
Tnfsf10
,
Ifi44l
,
and
Mx1
represent extreme cases of the correlation trend observed for ISGs, wherein
cells with the highest viral RNA abundance have no detectable transcripts (Fig. 6).
DISCUSSION
Standard scRNA-seq protocols with oligo(dT)-based priming have been used to
examine transcriptional dynamics during viral infection, but the unique genomic
structure of flaviviruses, and other nonpolyadenylated viruses that are clinically
impor-tant pathogens, represents a distinct hurdle for such studies (29). We have
indepen-dently developed and demonstrated the feasibility of WNV-inclusive scRNA-seq as an
attractive approach for the quantification of host transcripts and viral RNA within single
cells. This protocol, in combination with previously published work by Zanini et al. (31),
establishes virus-inclusive scRNA-seq as a viable and tractable system for other
non-polyadenylated RNA viruses.
WNV-inclusive scRNA-seq revealed extensive transcriptional heterogeneity in viral
RNA abundance and the IFN-I response across single cells (Fig. 2E, 3, and 4). The
majority of WNV reads mapped to the targeted region of the WNV genome (Fig. 2D).
However, minimal nonrandom background was observed in Mock cells with a median
value of 45 WNV counts per million transcripts for Mock cells, compared to 37,246 WNV
counts per million transcripts for WNV cells. This background may result from index
hopping (65) and could be accounted for in subsequent iterations by using unique
indices. Notably, correlation values for viral RNA and cell cycle-associated genes skew
toward zero, suggesting that differences in cell cycle state are likely not a major source
March 2019 Volume 93 Issue 6 e01778-18 jvi.asm.org 9
on November 6, 2019 by guest
http://jvi.asm.org/
FIG 5ISGs negatively correlate with WNV RNA abundance. (A) Gene ontology (GO) enrichment analysis for genes significantly (P⬍0.001) positively correlated (⬎0.35) and negatively correlated (⬍ ⫺0.35) with viral RNA. Enrichment scores (ES) calculated for each pathway by the formula: –log10(Pvalue). Dotted line indicates significance cutoff (P⫽0.05; ES⫽1.3). (B) Density plots of host gene expression correlated viral RNA across all WNV cells. Spearman’s correlation coefficients () calculated for each host gene by viral
(Continued on next page)
on November 6, 2019 by guest
http://jvi.asm.org/
[image:10.585.43.454.70.660.2]of heterogeneity. While we include a condition to control for asynchronous secondary
infection, it is possible that the observed variation in viral RNA abundance could be
attributable to a low level of
in vitro
spread within the WNV (
⫹
Ab) condition. Additional
potential sources of heterogeneity might include stochasticity in host sensing and RLR
signaling or the events preceding replication. Importantly, we observe variability in
RIG-I (
Ddx58
) expression in Mock cells (Fig. 3B). Early recognition of viral RNA in these
precocious cells may accelerate the induction of IFN-I and antiviral effectors, blunting
viral replication and contributing to the observed heterogeneity in viral RNA
abun-dance. In support of published findings (17–19, 27, 34), we found that few cells produce
IFN-

transcript following viral infection (Fig. 3A) and observed a strong induction of
numerous ISGs (
Irf7
,
Ddx58
,
Dhx58
,
Irf9
,
Stat1
, and
Stat2
) with high unimodal expression
signatures (Fig. 3), highlighting the well-established importance of IFN-I-dependent
paracrine signaling (16–19, 26, 27). Interestingly, we saw a bifurcation in ISG
correla-tions with viral RNA, wherein 124 of 294 ISGs were negatively correlated with
intracel-lular viral abundance (Fig. 5B). Furthermore, a considerable fraction of ISGs featured a
precipitous downward trend in expression with increasing viral RNA, dissimilar to the
gradual upward trend exhibited by positively correlated genes (Fig. 6). Collectively,
these findings are reflective of the dynamic balance and interplay between host and
viral factors within a single cell. This represents the first single-cell transcriptomics study
of flavivirus infection to examine the correlation of ISGs with intracellular viral RNA. To
extend this arm of our analysis, we examined WNV-targeting antiviral effector genes
that have been previously validated through short hairpin RNA (shRNA) and small
interfering RNA (siRNA) knockdown screens, cell-based overexpression assays and
in
vivo
knockout models (26, 43, 52–60). These validated antiviral effector genes exhibited
both unimodal (
Tnfsf10
,
Ifi44l
,
Ifitm3
,
Eif2ak2
, and
Mov10
) and bimodal (
Rsad2
,
Oas1b
,
and
Oas3
) expression patterns and all negatively correlated with viral RNA (Fig. 4 and
6), demonstrating the technical capacity of WNV-inclusive scRNA-seq to probe
virus-host interactions and identify novel antiviral candidate genes.
The discovery that bimodal variation in IFN-stimulated genes (ISGs) correlates with
viral RNA abundance (Fig. 4 and 6) bears notable relevance to previous work examining
WNV antagonism of IFN-I signaling. WNV, among other flaviviruses, directly or indirectly
antagonizes IFN-I signaling and the JAK-STAT pathway to counter cellular antiviral
defenses (66–70). The WNV nonstructural protein NS5 blocks Jak1 and Tyk2 activation
by interacting with prolidase to inhibit surface expression of IFNAR1 (10, 66). In
addition, WNV recruits plasma membrane-derived cholesterol to replication sites in the
ER, and NS4A and NS4B contribute to membrane rearrangement and associated ER
stress, which are all thought to interfere with JAK-STAT signaling (66, 71–73). Bimodal
ISG expression patterns correlated with viral abundance (Fig. 4 and 6) may result from
viral antagonism in primary infected cells, allowing for higher replication. This is
supported by the almost uniformly high expression observed for ISGs when limiting
in
vitro
spread (Fig. 4), a cell population with a predominantly low-level of WNV replication
(Fig. 2E). Alternatively, bimodality may arise from preexisting cell-intrinsic differences,
such as the level of critical signaling components, specifically at the initial stage of
infection.
WNV-inclusive scRNA-seq provides a single-cell transcriptomics protocol to probe
cellular heterogeneity in the host response and quantify viral RNA. The outlined
approach can potentially serve as a valuable tool for
in vivo
studies to examine
cell-intrinsic responses to viral infection, extending the resolution to infected single
cells. Such studies can also leverage the added ability with this approach to screen for
FIG 5Legend (Continued)
RNA. Gene set labels (left) and totals (right) are shown. Cell cycle-associated genes are additionally subdivided by phase. Select genes were marked and labeled. Dotted lines indicate correlation coefficients () equal to⫺0.35 and 0.35. (C) Correlation matrix for 57 of 124 negatively correlated ISGs, all positively correlated ISGs, 9 noncorrelated cytokine genes, and WNV RNA. Correlation coefficients () calculated for each gene pairing are indicated by the color gradient (bottom). White boxes represent comparisons for which the correlation did not meet the significance cutoff (P⬍0.001).
March 2019 Volume 93 Issue 6 e01778-18 jvi.asm.org 11
on November 6, 2019 by guest
http://jvi.asm.org/
infected cells by qPCR and prioritize cDNA for sequencing to mitigate cost. Our study
demonstrates the feasibility and utility of WNV-inclusive scRNA-seq as a
high-throughput technique for single-cell transcriptomics and viral RNA detection, which can
be used to provide insights into the cellular features of protective immunity.
FIG 6Sharp downward trend for ISGs negatively correlated with viral RNA. Scatter plots showing expression as counts per million transcripts (CPM) in log2scale of positively and negatively correlated host genes by WNV RNA. Each cell is represented by a single dot with minimal transparency so areas of high density are easily discernible. Correlation coefficients () are indicated for each gene and correspond to the color gradient (top). Scatter plots have been collated from lowest to highest correlation coefficient. All genes shown here meet the following criteria: ||⬎0.4 andP⬍0.0005.
on November 6, 2019 by guest
http://jvi.asm.org/
[image:12.585.43.545.73.631.2]MATERIALS AND METHODS
Cells and viruses.Murine fibroblast L929 cells were obtained from ATCC and grown at 37°C with 5% CO2in Dulbecco modified Eagle medium (DMEM; Corning) supplemented with 10% heat-inactivated fetal bovine serum (FBS), 2 mML-glutamine (Corning), 25 mM HEPES buffer (Corning), 1 mM sodium pyruvate (Corning), MEM nonessential amino acids (Corning), and antibiotics/antimycotics (Corning). WNV isolate Texas 2002-HC (WNV-TX) has been previously described (3, 74, 75), and its titer was determined by standard plaque assay on BHK-21 cells. Working stocks were generated by passaging WNV-TX twice on Vero cells (ATCC CCL81) and used forin vitroexperiments. WNV was incubated directly under UV light for 1 h to generate UV-inactivated WNV, which was confirmed by plaque assay prior to use.
Infection and antibody treatment.L929 cells were plated to 70 to 80% confluent and infected with WNV-TX at different MOIs (0.1, 1, or 10). After a 1-h virus adsorption period at 37°C, the cells were washed once with complete DMEM (cDMEM) and subsequently incubated for 6 to 48 h with cDMEM or cDMEM supplemented with WNV E16 neutralizing antibody (5g/ml), a gift from Michael Diamond (Washington University, St. Louis, MO) (46). Cells were trypsinized for flow staining or lysed for RNA at 6, 12, 24, or 48 h postinfection. Antibody titration in supplemental media was performed at multiple MOIs (0.1, 1, or 10) for 48 h postinfection to determine the optimal concentration to considerably reducein vitrospread prior to use.
Flow cytometry.Conditions were run in biological triplicate samples. Cells were treated with 0.125% trypsin in phosphate-buffered saline (PBS) for 5 min at 37°C. All centrifugation steps were performed at 1,250 rotations per minute for 5 min at 4°C. Cells were pelleted, resuspended in fluorescence-activated cell sorting (FACS) buffer (1⫻PBS, 1% FBS, 1 mM EDTA), and blocked for 10 min on ice with anti-mouse Fc Shield (TONBO Biosciences) at 0.5l per sample in FACS buffer. Subsequently, samples were stained for 20 min on ice with Ghost 780 viability dye (TONBO Biosciences) at 0.1l per sample in PBS. Samples were washed and resuspended in FACS buffer. For WNV E protein staining, samples were fixed following viability staining with 1⫻Transcription Factor Fix/Perm (diluted in Transcription Factor Fix/Perm Diluent; TONBO Biosciences) for 20 min on ice and washed twice with 1⫻Flow Cytometry Perm Buffer (diluted in ddH2O; TONBO Biosciences). WNV E16 antibody was conjugated to Allophycocyanin (APC) using a Lightning-Link APC antibody labeling kit (Novus Biologicals). Samples were stained with APC-conjugated WNV E16 antibody at 0.25g per sample in Flow Cytometry Perm Buffer for 30 min on ice. Samples were washed, resuspended in FACS buffer, and run on a BD LSR II flow cytometer.
Single-cell sorting.Cells were stained with Ghost 780 viability dye (TONBO Biosciences) as stated above and filtered through a 35-m-pore size strainer into a 5-ml FACS tube. Single viable cells were sorted into skirted 96-well PCR plates containing 10l of RLT buffer (Qiagen) with2-mercaptoethanol (1:100) per well using a BSL-3 level BD Aria II flow cytometer.
Quantitative RT-PCR.Time-matched mock-infected and WNV-infected L929 cells (1⫻105cells per condition; in triplicate) were lysed in RNA lysis buffer. Total RNA was isolated from cells using the Quick-RNA MiniPrep kit (Zymo Research). Purified RNA was reverse transcribed using random primers with the High-Capacity cDNA reverse transcription kit (Applied Biosystems). WNV RNA levels were quantified by quantitative reverse transcription-PCR (qPCR) using PrimeTime Gene Expression Master Mix (Integrated DNA Technologies), WNV-specific primers and probe set, and TaqMan gene expression assay (Thermo Fisher) for the host geneGapdh(Mm99999915_g1). WNV-specific primer and probe sequences (forward primer, 5=-TCAGCGATCTCTCCACCAAAG-3=; reverse primer, 5=GGGTCAGCACGTTTGTCATTG-3=; and probe, 5=-6FAM-TGCCCGACCATGGGAGAAGCTC-MGB-3=) were adapted from Lanciotti et al. (75) and correspond to WNV isolate Texas 2002-HC (GenBank accession numberDQ176637.1).CTvalues were
normalized to the reference geneGapdhand represented as the fold change over time-matched mock values using the 2–ΔΔCTformula. All primers and probes were purchased from Integrated DNA
Technol-ogies (IDT). qPCR was performed in 384-well plates and run on an Applied Biosystems 7900 HT real-time PCR system.
Bulk mRNA sequencing.L929 cells were infected with WNV (MOI of 1) and incubated in the absence or presence (⫹Ab) of WNV E16 neutralizing Ab. In biological triplicate (n⫽3), 50,000 viable cells were sorted into 100l RLT buffer (Qiagen) with2-mercaptoethanol (1:100) at 24 h postinfection for each condition: time-matched mock, WNV and WNV (⫹Ab). mRNA sequencing libraries were prepared at Yerkes Genomics Core (http://www.yerkes.emory.edu/nhp_genomics_core/), and the quality of the libraries was verified using DNA-1000 kits (Agilent Bioanalyzer) and quantified using the Qubit 2.0 fluorometer (Life Technologies). Libraries were clustered and sequenced on an Illumina HiSeq (100-bp single-end reads). Sequencing reads were mapped to the GENCODE mouse reference genome (GRCm38.p5, release M16). Reads were normalized and differential expression analysis performed using DESeq2 (76). Normalized reads were expressed as the fold change over time-matched mock values.
Single-cell RNA sequencing.SMART-Seq v4 Ultra Low Input RNA kit (TaKaRa) was used for cDNA preparation. The protocol was modified to include a WNV-specific viral primer during the RT step. WNV SC primer (5=-AAGCAGTGGTATCAACGCAGAGTACGGGTCAGCACGTTTGTCATTG-3=) targets the positive-sense envelope protein (E) gene (75) and contains the 5=25-nucleotide ISPCR universal anchor sequence (underlined) from the Smart-seq2 protocol published by Picelli et al. (47) for downstream amplification alongside 3=SMART-Seq CDS Primer II A-primed transcripts. Similar to 3=SMART-Seq CDS Primer II A, 1
l of WNV SC primer (12M) was added to the RT reaction for all samples. Other WNV-specific primer sequences and concentrations were evaluated. The single-cell RNA sequencing (scRNA-seq) protocol was optimized to ensure high sensitivity for WNV RNA detection and to mitigate the formation of primer dimers or template-switching oligonucleotide (TSO) concatemers observed at high concentrations or with other primer sequences. During template switching, the RT product is extended with a sequence
March 2019 Volume 93 Issue 6 e01778-18 jvi.asm.org 13
on November 6, 2019 by guest
http://jvi.asm.org/
complementary to the TSO due to the addition of two to five untemplated nucleotides and the capacity of the RT enzyme to switch templates just as described for Smart-seq2 (47). PCR is performed using PCR Primer II A (the ISPCR universal anchor sequence) for concurrent amplification of both host and viral cDNA. After PCR amplification, cDNA quantification is performed for each sample, and cDNA quality assessment is accomplished using an Agilent 2100 bioanalyzer. For library preparation, amplified cDNA is fragmented and appended with dual-indexed barcodes using Illumina Nextera XT DNA Library Prep kits. Sequencing was performed using 101-bp single end reads at Yerkes Genomics Core (http://www .yerkes.emory.edu/nhp_genomics_core/) as previously described (77) on an Illumina HiSeq 3000 at a depth of ⬃1,000,000 reads per cell. In total, 127 cells were successfully captured and profiled for single-cell transcriptomic analysis: 25 Mock cells, 68 WNV cells, and 34 WNV (⫹Ab) cells.
Bioinformatics pipeline.Libraries were sequenced on an Illumina HiSeq 3000 generating 101-bp single-end reads. FastQC (78) was used to check the quality of fastq files. The primary assembly of GENCODE mouse reference genome (GRCm38.p5 Release M16) (79) and the complete genome of WNV isolate Texas 2002-HC (GenBank accession numberDQ176637.1) from ViPR (80) were used for mapping reads. The genome index was built by combining both the genomes, and alignments were carried out for the combined genomes. STAR v2.5.2b (81) was used with default parameters to map reads and obtain reads per gene counts (– quantMode Gene Counts). The counts obtained with STAR were used for downstream analysis in R. The counts were used to create a SingleCellExperiment v1.0.0 (82) object. The scater v1.6.3 (83) library was used for quality control of cells. Genes that were not expressed in any cell were filtered out. The isOutlier function from scran was used to remove cells that had a library size and number of detected genes greater than three median absolute deviations lower than the median values or those with percentage of mitochondrial genes that were three median absolute deviations higher than the median value (84). The cell cycle phase was predicted using the cyclone function in scran package v1.6.3 (82, 84). The normalized expression values were obtained using the calculateCPM function in the scater library.
Statistical analysis and software.Prism 6 (GraphPad), ggplot2 R package, diptest R package, ggridges R package, corrplot R package, and Hmisc R package were used for statistical analyses and graphical presentation of data. The dip.test function in diptest R package was used to test for statistically significant nonunimodal (multimodal) distributions. Spearman’s rank correlation coefficients () and associatedPvalues were computed for each gene pairing using the rcorr function in Hmisc R package. Two-way analysis of variance (ANOVA) with Tukey’s multiple comparison correction was used to evaluate significant differences between conditions for percentage of WNV E-positive cells and relative viral RNA. Wilcoxon rank sum test with continuity correction was performed to assess significant differences between single-cell distributions for host mRNA and viral RNA counts per million transcripts (CPM).
Accession number(s).All raw sequencing data have been deposited in NCBI’s Gene Expression Omnibus (GEO) repository and are accessible through accession numberGSE125241.
ACKNOWLEDGMENTS
We thank the Emory Vaccine Center Flow Core, specifically Kiran Gill and Barbara
Cervasi, for assistance with cell sorting and the Yerkes Genomics Core for library
preparation and sequencing.
This study was funded in part by National Institutes of Health grants U19AI083019
(M.S.S.), 5U19AI106772 (M.S.S.), R21AI113485 (M.S.S.), and ORIP/OD P51OD011132 (M.S.S.),
an Emory University Department of Pediatrics Junior Faculty Focused Award (M.S.S.),
Children’s Healthcare of Atlanta, the Emory Vaccine Center, and The Georgia Research
Alliance (M.S.S.). The funders had no role in study design, data collection and analysis,
decision to publish, or preparation of the manuscript.
REFERENCES
1. Chancey C, Grinev A, Volkova E, Rios M. 2015. The global ecology and epidemiology of West Nile virus. Biomed Res Int 2015:376230.https:// doi.org/10.1155/2015/376230.
2. Krow-Lucal E, Lindsey NP, Lehman J, Fischer M, Staples JE. 2017. West Nile virus and other nationally notifiable arboviral diseases—United States, 2015. MMWR Morb Mortal Wkly Rep 66:51–55.https://doi.org/10 .15585/mmwr.mm6602a3.
3. Suthar MS, Diamond MS, Gale M, Jr. 2013. West Nile virus infection and immunity. Nat Rev Microbiol 11:115–128. https://doi.org/10 .1038/nrmicro2950.
4. Swanson PA, 2nd, McGavern DB. 2015. Viral diseases of the central nervous system. Curr Opin Virol 11:44 –54.https://doi.org/10.1016/j.coviro.2014.12 .009.
5. Brien JD, Uhrlaub JL, Nikolich-Zugich J. 2008. West Nile virus-specific CD4 T cells exhibit direct antiviral cytokine secretion and cytotoxicity and are sufficient for antiviral protection. J Immunol 181:8568 – 8575. 6. Durrant DM, Robinette ML, Klein RS. 2013. IL-1R1 is required for
dendritic cell-mediated T cell reactivation within the CNS during
West Nile virus encephalitis. J Exp Med 210:503–516.https://doi.org/ 10.1084/jem.20121897.
7. Gorman MJ, Caine EA, Zaitsev K, Begley MC, Weger-Lucarelli J, Uccellini MB, Tripathi S, Morrison J, Yount BL, Dinnon KH, Rückert C, Young MC, Zhu Z, Robertson SJ, McNally KL, Ye J, Cao B, Mysorekar IU, Ebel GD, Baric RS, Best SM, Artyomov MN, Garcia-Sastre A, Diamond MS. 2018. An immunocompetent mouse model of Zika virus infection. Cell Host Mi-crobe 23:672– 685.https://doi.org/10.1016/j.chom.2018.04.003. 8. Klein RS, Lin E, Zhang B, Luster AD, Tollett J, Samuel MA, Engle M,
Diamond MS. 2005. Neuronal CXCL10 directs CD8⫹T-cell recruitment and control of West Nile virus encephalitis. J Virol 79:11457–11466.
https://doi.org/10.1128/JVI.79.17.11457-11466.2005.
9. Lazear HM, Lancaster A, Wilkins C, Suthar MS, Huang A, Vick SC, Clepper L, Thackray L, Brassil MM, Virgin HW, Nikolich-Zugich J, Moses AV, Gale M, Früh K, Diamond MS. 2013. IRF-3, IRF-5, and IRF-7 coordinately regulate the type I IFN response in myeloid dendritic cells downstream of MAVS signaling. PLoS Pathog 9:e1003118.https://doi.org/10.1371/ journal.ppat.1003118.
on November 6, 2019 by guest
http://jvi.asm.org/
10. Lubick KJ, Robertson SJ, McNally KL, Freedman BA, Rasmussen AL, Taylor RT, Walts AD, Tsuruda S, Sakai M, Ishizuka M, Boer EF, Foster EC, Chiramel AI, Addison CB, Green R, Kastner DL, Katze MG, Holland SM, Forlino A, Freeman AF, Boehm M, Yoshii K, Best SM. 2015. Flavivirus antagonism of type I interferon signaling reveals prolidase as a regulator of IFNAR1 surface expression. Cell Host Microbe 18:61–74.https://doi.org/10.1016/ j.chom.2015.06.007.
11. Pinto AK, Ramos HJ, Wu X, Aggarwal S, Shrestha B, Gorman M, Kim KY, Suthar MS, Atkinson JP, Gale M, Jr, Diamond MS. 2014. Deficient IFN signaling by myeloid cells leads to MAVS-dependent virus-induced sep-sis. PLoS Pathog 10:e1004086.
12. Schneider WM, Chevillotte MD, Rice CM. 2014. Interferon-stimulated genes: a complex web of host defenses. Annu Rev Immunol 32:513–545.
https://doi.org/10.1146/annurev-immunol-032713-120231.
13. Sen A, Rothenberg ME, Mukherjee G, Feng N, Kalisky T, Nair N, Johnstone IM, Clarke MF, Greenberg HB. 2012. Innate immune response to homol-ogous rotavirus infection in the small intestinal villous epithelium at single-cell resolution. Proc Natl Acad Sci U S A 109:20667–20672.https:// doi.org/10.1073/pnas.1212188109.
14. Suthar MS, Ma DY, Thomas S, Lund JM, Zhang N, Daffis S, Rudensky AY, Bevan MJ, Clark EA, Kaja MK, Diamond MS, Gale M, Jr. 2010. IPS-1 is essential for the control of West Nile virus infection and immunity. PLoS Pathog 6:e1000757.https://doi.org/10.1371/journal.ppat.1000757. 15. Samuel MA, Diamond MS. 2005. Alpha/beta interferon protects against
lethal West Nile virus infection by restricting cellular tropism and en-hancing neuronal survival. J Virol 79:13350 –13361.https://doi.org/10 .1128/JVI.79.21.13350-13361.2005.
16. Hu J, Nudelman G, Shimoni Y, Kumar M, Ding Y, Lopez C, Hayot F, Wetmur JG, Sealfon SC. 2011. Role of cell-to-cell variability in activating a positive feedback antiviral response in human dendritic cells. PLoS One 6:e16614.https://doi.org/10.1371/journal.pone.0016614.
17. Patil S, Fribourg M, Ge Y, Batish M, Tyagi S, Hayot F, Sealfon SC. 2015. Single-cell analysis shows that paracrine signaling by first responder cells shapes the interferon-beta response to viral infection. Sci Signal 8:ra16.https://doi.org/10.1126/scisignal.2005728.
18. Rand U, Rinas M, Schwerk J, Nöhren G, Linnes M, Kröger A, Flossdorf M, Kály-Kullai K, Hauser H, Höfer T, Köster M. 2012. Multi-layered stochas-ticity and paracrine signal propagation shape the type I interferon response. Mol Syst Biol 8:584.https://doi.org/10.1038/msb.2012.17. 19. Zhao M, Zhang J, Phatnani H, Scheu S, Maniatis T. 2012. Stochastic
expression of the interferon-beta gene. PLoS Biol 10:e1001249.https:// doi.org/10.1371/journal.pbio.1001249.
20. Sadler AJ, Williams BR. 2008. Interferon-inducible antiviral effectors. Nat Rev Immunol 8:559 –568.https://doi.org/10.1038/nri2314.
21. Schoggins JW. 2014. Interferon-stimulated genes: roles in viral patho-genesis. Curr Opin Virol 6:40 – 46.https://doi.org/10.1016/j.coviro.2014 .03.006.
22. Honda K, Takaoka A, Taniguchi T. 2006. Type I interferon [corrected] gene induction by the interferon regulatory factor family of transcription factors. Immunity 25:349 –360.https://doi.org/10.1016/j.immuni.2006.08 .009.
23. Ashour J, Laurent-Rolle M, Shi P-Y, García-Sastre A. 2009. NS5 of dengue virus mediates STAT2 binding and degradation. J Virol 83:5408 –5418.
https://doi.org/10.1128/JVI.02188-08.
24. Grant A, Ponia SS, Tripathi S, Balasubramaniam V, Miorin L, Sourisseau M, Schwarz MC, Sánchez-Seco MP, Evans MJ, Best SM, García-Sastre A. 2016. Zika virus targets human STAT2 to inhibit type I interferon signaling. Cell Host Microbe 19:882– 890.https://doi.org/10.1016/j.chom.2016.05.009. 25. Morrison J, Laurent-Rolle M, Maestre AM, Rajsbaum R, Pisanelli G, Simon
V, Mulder LCF, Fernandez-Sesma A, García-Sastre A. 2013. Dengue virus co-opts UBR4 to degrade STAT2 and antagonize type I interferon sig-naling. PLoS Pathog 9:e1003265. https://doi.org/10.1371/journal.ppat .1003265.
26. Schoggins JW, Wilson SJ, Panis M, Murphy MY, Jones CT, Bieniasz P, Rice CM. 2011. A diverse range of gene products are effectors of the type I interferon antiviral response. Nature 472:481– 485. https://doi.org/10 .1038/nature09907.
27. Shalek AK, Satija R, Shuga J, Trombetta JJ, Gennert D, Lu D, Chen P, Gertner RS, Gaublomme JT, Yosef N, Schwartz S, Fowler B, Weaver S, Wang J, Wang X, Ding R, Raychowdhury R, Friedman N, Hacohen N, Park H, May AP, Regev A. 2014. Single-cell RNA-seq reveals dynamic paracrine control of cellular variation. Nature 510:363–369. https://doi.org/10 .1038/nature13437.
28. Daffis S, Szretter KJ, Schriewer J, Li J, Youn S, Errett J, Lin TY, Schneller S,
Zust R, Dong H, Thiel V, Sen GC, Fensterl V, Klimstra WB, Pierson TC, Buller RM, Gale M, Jr, Shi PY, Diamond MS. 2010. 2=-O methylation of the viral mRNA cap evades host restriction by IFIT family members. Nature 468:452– 456.https://doi.org/10.1038/nature09489.
29. Russell AB, Trapnell C, Bloom JD. 2018. Extreme heterogeneity of influ-enza virus infection in single cells. Elife 71.
30. Schulte MB, Andino R. 2014. Single-cell analysis uncovers extensive biological noise in poliovirus replication. J Virol 88:6205– 6212.https:// doi.org/10.1128/JVI.03539-13.
31. Zanini F, Pu SY, Bekerman E, Einav S, Quake SR. 2018. Single-cell tran-scriptional dynamics of flavivirus infection. Elife 7:e32942.https://doi .org/10.7554/eLife.32942.
32. Hamlin RE, Rahman A, Pak TR, Maringer K, Mena I, Bernal-Rubio D, Potla U, Maestre AM, Fredericks AC, Amir ED, Kasarskis A, Ramos I, Merad M, Fernandez-Sesma A. 2017. High-dimensional CyTOF analysis of dengue virus-infected human DCs reveals distinct viral signatures. JCI Insight 2:92424.https://doi.org/10.1172/jci.insight.92424.
33. Avraham R, Haseley N, Brown D, Penaranda C, Jijon HB, Trombetta JJ, Satija R, Shalek AK, Xavier RJ, Regev A, Hung DT. 2015. Pathogen cell-to-cell variability drives heterogeneity in host immune responses. Cell 162:1309 –1321.https://doi.org/10.1016/j.cell.2015.08.027. 34. Wimmers F, Subedi N, van Buuringen N, Heister D, Vivie J,
Beeren-Reinieren I, Woestenenk R, Dolstra H, Piruska A, Jacobs JFM, van Oud-enaarden A, Figdor CG, Huck WTS, de Vries IJM, Tel J. 2018. Single-cell analysis reveals that stochasticity and paracrine signaling control interferon-alpha production by plasmacytoid dendritic cells. Nat Com-mun 9:3317.https://doi.org/10.1038/s41467-018-05784-3.
35. Alvarez-Errico D, Vento-Tormo R, Sieweke M, Ballestar E. 2015. Epigenetic control of myeloid cell differentiation, identity and function. Nat Rev Immunol 15:7–17.https://doi.org/10.1038/nri3777.
36. Ford E, Thanos D. 2010. The transcriptional code of human IFN-beta gene expression. Biochim Biophys Acta 1799:328 –336.https://doi.org/ 10.1016/j.bbagrm.2010.01.010.
37. Xue S, Liu C, Sun X, Li W, Zhang C, Zhou X, Lu Y, Xiao J, Li C, Xu X, Sun B, Xu G, Wang H. 2016. TET3 inhibits type I IFN production independent of DNA demethylation. Cell Rep 16:1096 –1105.https://doi.org/10.1016/ j.celrep.2016.06.068.
38. Kwon YJ, Heo J, Wong HE, Cruz DJ, Velumani S, da Silva CT, Mosimann AL, Duarte Dos Santos CN, Freitas-Junior LH, Fink K. 2014. Kinome siRNA screen identifies novel cell-type-specific dengue host target genes. An-tiviral Res 110:20 –30.https://doi.org/10.1016/j.antiviral.2014.07.006. 39. Marceau CD, Puschnik AS, Majzoub K, Ooi YS, Brewer SM, Fuchs G,
Swaminathan K, Mata MA, Elias JE, Sarnow P, Carette JE. 2016. Genetic dissection of Flaviviridae host factors through genome-scale CRISPR screens. Nature 535:159 –163.https://doi.org/10.1038/nature18631. 40. Zhang R, Miner JJ, Gorman MJ, Rausch K, Ramage H, White JP, Zuiani A,
Zhang P, Fernandez E, Zhang Q, Dowd KA, Pierson TC, Cherry S, Dia-mond MS. 2016. A CRISPR screen defines a signal peptide processing pathway required by flaviviruses. Nature 535:164 –168.https://doi.org/ 10.1038/nature18625.
41. Krishnan MN, Ng A, Sukumaran B, Gilfoy FD, Uchil PD, Sultana H, Brass AL, Adametz R, Tsui M, Qian F, Montgomery RR, Lev S, Mason PW, Koski RA, Elledge SJ, Xavier RJ, Agaisse H, Fikrig E. 2008. RNA interference screen for human genes associated with West Nile virus infection. Nature 455:242–245.https://doi.org/10.1038/nature07207.
42. Ma H, Dang Y, Wu Y, Jia G, Anaya E, Zhang J, Abraham S, Choi JG, Shi G, Qi L, Manjunath N, Wu H. 2015. A CRISPR-based screen identifies genes essential for West-Nile-virus-induced cell death. Cell Rep 12:673– 683.
https://doi.org/10.1016/j.celrep.2015.06.049.
43. Li J, Ding SC, Cho H, Chung BC, Gale M, Jr, Chanda SK, Diamond MS. 2013. A short hairpin RNA screen of interferon-stimulated genes identi-fies a novel negative regulator of the cellular antiviral response. mBio 4:e00385-13.
44. O’Neal JT, Upadhyay AA, Wolabaugh A, Patel NB, Bosinger SE, Suthar MS. 2019. West Nile virus-inclusive single-cell RNA sequencing reveals het-erogeneity in the type I interferon response within single cells. bioRxiv
https://doi.org/10.1101/434852.
45. Hoss-Homfeld A, Zwarthoff EC, Zawatzky R. 1989. Cell type specific expression and regulation of murine interferon alpha and beta genes. Virology 173:539 –550.
46. Nybakken GE, Oliphant T, Johnson S, Burke S, Diamond MS, Fremont DH. 2005. Structural basis of West Nile virus neutralization by a therapeutic antibody. Nature 437:764 –769.https://doi.org/10.1038/nature03956. 47. Picelli S, Faridani OR, Bjorklund AK, Winberg G, Sagasser S, Sandberg R.
March 2019 Volume 93 Issue 6 e01778-18 jvi.asm.org 15
on November 6, 2019 by guest
http://jvi.asm.org/
2014. Full-length RNA-seq from single cells using Smart-seq2. Nat Protoc 9:171–181.https://doi.org/10.1038/nprot.2014.006.
48. Wu AR, Neff NF, Kalisky T, Dalerba P, Treutlein B, Rothenberg ME, Mburu FM, Mantalas GL, Sim S, Clarke MF, Quake SR. 2014. Quantitative assess-ment of single-cell RNA-sequencing methods. Nat Methods 11:41– 46.
https://doi.org/10.1038/nmeth.2694.
49. Marie I, Durbin JE, Levy DE. 1998. Differential viral induction of distinct interferon-alpha genes by positive feedback through interferon regula-tory factor-7. EMBO J 17:6660 – 6669.https://doi.org/10.1093/emboj/17 .22.6660.
50. Sato M, Hata N, Asagiri M, Nakaya T, Taniguchi T, Tanaka N. 1998. Positive feedback regulation of type I IFN genes by the IFN-inducible transcription factor IRF-7. FEBS Lett 441:106 –110.
51. Sato M, Suemori H, Hata N, Asagiri M, Ogasawara K, Nakao K, Nakaya T, Katsuki M, Noguchi S, Tanaka N, Taniguchi T. 2000. Distinct and essential roles of transcription factors IRF-3 and IRF-7 in response to viruses for IFN-␣/gene induction. Immunity 13:539 –548.
52. Brass AL, Huang IC, Benita Y, John SP, Krishnan MN, Feeley EM, Ryan BJ, Weyer JL, van der Weyden L, Fikrig E, Adams DJ, Xavier RJ, Farzan M, Elledge SJ. 2009. The IFITM proteins mediate cellular resistance to influenza A H1N1 virus, West Nile virus, and dengue virus. Cell 139: 1243–1254.https://doi.org/10.1016/j.cell.2009.12.017.
53. Gorman MJ, Poddar S, Farzan M, Diamond MS. 2016. The interferon-stimulated geneIfitm3restricts West Nile virus infection and pathogen-esis. J Virol 90:8212– 8225.https://doi.org/10.1128/JVI.00581-16. 54. Kajaste-Rudnitski A, Mashimo T, Frenkiel M-P, Guénet J-L, Lucas M,
Desprès P. 2006. The 2=,5=-oligoadenylate synthetase 1b is a potent inhibitor of West Nile virus replication inside infected cells. J Biol Chem 281:4624 – 4637.https://doi.org/10.1074/jbc.M508649200.
55. Liu XY, Chen W, Wei B, Shan YF, Wang C. 2011. IFN-induced TPR protein IFIT3 potentiates antiviral signaling by bridging MAVS and TBK1. J Immunol 187:2559 –2568.https://doi.org/10.4049/jimmunol.1100963. 56. Perelygin AA, Scherbik SV, Zhulin IB, Stockman BM, Li Y, Brinton MA.
2002. Positional cloning of the murine flavivirus resistance gene. Proc Natl Acad Sci U S A 99:9322–9327. https://doi.org/10.1073/pnas .142287799.
57. Szretter KJ, Brien JD, Thackray LB, Virgin HW, Cresswell P, Diamond MS. 2011. The interferon-inducible gene viperin restricts West Nile virus pathogenesis. J Virol 85:11557–11566.https://doi.org/10.1128/ JVI.05519-11.
58. Verhelst J, Parthoens E, Schepens B, Fiers W, Saelens X. 2012. Interferon-inducible protein Mx1 inhibits influenza virus by interfering with func-tional viral ribonucleoprotein complex assembly. J Virol 86: 13445–13455.https://doi.org/10.1128/JVI.01682-12.
59. Shrestha B, Pinto AK, Green S, Bosch I, Diamond MS. 2012. CD8⫹T cells use TRAIL to restrict West Nile virus pathogenesis by controlling infection in neurons. J Virol 86:8937– 8948.https://doi.org/10.1128/ JVI.00673-12.
60. Li Y, Banerjee S, Wang Y, Goldstein SA, Dong B, Gaughan C, Silverman RH, Weiss SR. 2016. Activation of RNase L is dependent on OAS3 expression during infection with diverse human viruses. Proc Natl Acad Sci U S A 113:2241–2246.https://doi.org/10.1073/pnas.1519657113. 61. Huang da W, Sherman BT, Lempicki RA. 2009. Systematic and integrative
analysis of large gene lists using DAVID bioinformatics resources. Nat Protoc 4:44 –57.https://doi.org/10.1038/nprot.2008.211.
62. Huang d. W, Sherman BT, Lempicki RA. 2009. Bioinformatics enrichment tools: paths toward the comprehensive functional analysis of large gene lists. Nucleic Acids Res 37:1–13.https://doi.org/10.1093/nar/gkn923. 63. Macosko EZ, Basu A, Satija R, Nemesh J, Shekhar K, Goldman M, Tirosh
I, Bialas AR, Kamitaki N, Martersteck EM, Trombetta JJ, Weitz DA, Sanes JR, Shalek AK, Regev A, McCarroll SA. 2015. Highly parallel genome-wide expression profiling of individual cells using nanoliter droplets. Cell 161:1202–1214.https://doi.org/10.1016/j.cell.2015.05.002.
64. Baranek T, Manh TP, Alexandre Y, Maqbool MA, Cabeza JZ, Tomasello E, Crozat K, Bessou G, Zucchini N, Robbins SH, Vivier E, Kalinke U, Ferrier P, Dalod M. 2012. Differential responses of immune cells to type I inter-feron contribute to host resistance to viral infection. Cell Host Microbe 12:571–584.https://doi.org/10.1016/j.chom.2012.09.002.
65. Illumina, Inc. 2017. Effects of index misassignment on multiplexing and downstream analysis. Illumina, Inc, San Diego, CA.https://www . i l l u m i n a . c o m / c o n t e n t / d a m / i l l u m i n a - m a r k e t i n g / d o c u m e n t s / products/whitepapers/index-hopping-white-paper-770-2017-004 .pdf.
66. Best SM. 2017. The many faces of the flavivirus NS5 protein in
antago-nism of type I interferon signaling. J Virol 91:e01970-16.https://doi.org/ 10.1128/JVI.01970-16.
67. Bowen JR, Zimmerman MG, Suthar MS. 2017. Taking the defensive: immune control of Zika virus infection. Virus Reshttps://doi.org/10.1016/ j.virusres.2017.08.018.
68. Quicke KM, Diamond MS, Suthar MS. 2017. Negative regulators of the RIG-I-like receptor signaling pathway. Eur J Immunol 47:615– 628.
https://doi.org/10.1002/eji.201646484.
69. Quicke KM, Suthar MS. 2013. The innate immune playbook for restricting West Nile virus infection. Viruses 5:2643–2658.https://doi.org/10.3390/ v5112643.
70. Bowen JR, Quicke KM, Maddur MS, O’Neal JT, McDonald CE, Fedorova NB, Puri V, Shabman RS, Pulendran B, Suthar MS. 2017. Zika virus antagonizes type I interferon responses during infection of human dendritic cells. PLoS Pathog 13:e1006164.https://doi.org/10.1371/journal.ppat.1006164. 71. Ambrose RL, Mackenzie JM. 2011. West Nile virus differentially
modu-lates the unfolded protein response to facilitate replication and immune evasion. J Virol 85:2723–2732.https://doi.org/10.1128/JVI.02050-10. 72. Mackenzie JM, Khromykh AA, Parton RG. 2007. Cholesterol manipulation
by West Nile virus perturbs the cellular immune response. Cell Host Microbe 2:229 –239.https://doi.org/10.1016/j.chom.2007.09.003. 73. Roosendaal J, Westaway EG, Khromykh A, Mackenzie JM. 2006.
Regu-lated cleavages at the West Nile virus NS4A-2K-NS4B junctions play a major role in rearranging cytoplasmic membranes and Golgi trafficking of the NS4A protein. J Virol 80:4623– 4632.https://doi.org/10.1128/JVI .80.9.4623-4632.2006.
74. Aguilar-Valenzuela R, Netland J, Seo YJ, Bevan MJ, Grakoui A, Suthar MS. 2018. Dynamics of tissue-specific CD8⫹T cell responses during West Nile virus infection. J Virol 92:e00014-18.https://doi.org/10.1128/JVI.00014-18. 75. Lanciotti RS, Kerst AJ, Nasci RS, Godsey MS, Mitchell CJ, Savage HM,
Komar N, Panella NA, Allen BC, Volpe KE, Davis BS, Roehrig JT. 2000. Rapid detection of West Nile virus from human clinical specimens, field-collected mosquitoes, and avian samples by a TaqMan reverse transcriptase-PCR assay. J Clin Microbiol 38:4066 – 4071.
76. Love MI, Huber W, Anders S. 2014. Moderated estimation of fold change and dispersion for RNA-seq data with DESeq2. Genome Biol 15:550.
https://doi.org/10.1186/s13059-014-0550-8.
77. Upadhyay AA, Kauffman RC, Wolabaugh AN, Cho A, Patel NB, Reiss SM, Havenar-Daughton C, Dawoud RA, Tharp GK, Sanz I, Pulendran B, Crotty S, Lee FE, Wrammert J, Bosinger SE. 2018. BALDR: a computational pipeline for paired heavy and light chain immunoglobulin reconstruc-tion in single-cell RNA-seq data. Genome Med 10:20.https://doi.org/10 .1186/s13073-018-0528-3.
78. Andrews S. 2010. FastQC: a quality control tool for high throughput se-quence data.https://www.bioinformatics.babraham.ac.uk/projects/fastqc/. 79. Harrow J, Frankish A, Gonzalez JM, Tapanari E, Diekhans M, Kokocinski F,
Aken BL, Barrell D, Zadissa A, Searle S, Barnes I, Bignell A, Boychenko V, Hunt T, Kay M, Mukherjee G, Rajan J, Despacio-Reyes G, Saunders G, Steward C, Harte R, Lin M, Howald C, Tanzer A, Derrien T, Chrast J, Walters N, Balasubramanian S, Pei B, Tress M, Rodriguez JM, Ezkurdia I, van Baren J, Brent M, Haussler D, Kellis M, Valencia A, Reymond A, Gerstein M, Guigó R, Hubbard TJ. 2012. GENCODE: the reference human genome annotation for The ENCODE Project. Genome Res 22: 1760 –1774.https://doi.org/10.1101/gr.135350.111.
80. Pickett BE, Sadat EL, Zhang Y, Noronha JM, Squires RB, Hunt V, Liu M, Kumar S, Zaremba S, Gu Z, Zhou L, Larson CN, Dietrich J, Klem EB, Scheuermann RH. 2012. ViPR: an open bioinformatics database and analysis resource for virology research. Nucleic Acids Res 40:D593.
https://doi.org/10.1093/nar/gkr859.
81. Dobin A, Davis CA, Schlesinger F, Drenkow J, Zaleski C, Jha S, Batut P, Chaisson M, Gingeras TR. 2013. STAR: ultrafast universal RNA-seq aligner. Bioinformatics 29:15–21.https://doi.org/10.1093/bioinformatics/bts635. 82. Lun A, Risso D, Korthauer K. 2018. Single cell experiment: S4 classes for single cell data. https://www.bioconductor.org/packages/release/bioc/ html/SingleCellExperiment.html.
83. McCarthy DJ, Campbell KR, Lun AT, Wills QF. 2017. Scater: pre-processing, quality control, normalization and visualization of single-cell RNA-seq data in R. Bioinformatics 33:1179 –1186.https://doi.org/ 10.1093/bioinformatics/btw777.
84. Scialdone A, Natarajan KN, Saraiva LR, Proserpio V, Teichmann SA, Stegle O, Marioni JC, Buettner F. 2015. Computational assignment of cell-cycle stage from single-cell transcriptome data. Methods 85:54 – 61.https:// doi.org/10.1016/j.ymeth.2015.06.021.
on November 6, 2019 by guest
http://jvi.asm.org/