Statistics
in focus
SCIENCE AND
TECHNOLOGY
23/2007
Author
August GÖTZFRIED
C o n t e n t s
Main findings ... 1
At EU level R&D intensity is
stable but expenditure is
increasing in volume ... 2
In the EU, 55% of R&D
expenditure was funded by the
BES in 2005 ... 3
Researchers accounted for
almost 1 % of total employment
in the EU in 2004 ... 4
In 2004, R&D personnel in FTE
in the EU-25 numbered about
2 millions ... 5
Between 2002 and 2004, there
were 3% more EU researchers
per year on average ... 6
R& D ex p e n d i t u r e a n d
p e r s o n n e l
R&D intensity in the EU-25 unchanged at 1.85% in
2005 compared to 2004, but China making rapid
[image:1.595.216.558.248.493.2]progress
Figure 1: R&D intensity (R&D expenditure as a % of GDP), all sectors, EU-25, NMS10, China, Japan, Russia and the United States — 1994 to 2005
NOTES
Eurostat estimations: EU-25 and NMS10 JP 1994-1995: Overestimated data
Provisional data: US 2003 and 2004 CN 1994-1999: underestimated data
US 1993 - 2004: Excludes most or all capital expenditure Break in series: JP 1996, US 1998, CN 2000
Source: Eurostat/R&D statistics -OECD - MSTI 2006/1
2.79 2.92
2.82 2.89
3.02 3.04 3.05 3.13
3.18 3.20 3.18
2.42 2.51
2.55 2.58 2.62 2.66
2.74 2.76
2.65 2.68 2.68
1.82 1.77 1.80 1.80 1.86 1.87 1.88 1.89 1.88 1.85 1.85
0.64
0.57 0.57 0.64 0.65 0.84 0.85
0.97 1.04 0.95 1.00 1.05
1.18 1.25 1.28
0.78 0.77 0.79 0.82 0.76
1.13 0.95
0.90 1.07
1.23 1.34
1.16 1.07
0.77 0.77
0.78 0.77
0.0 0.5 1.0 1.5 2.0 2.5 3.0 3.5
1994 1995 1996 1997 1998 1999 2000 2001 2002 2003 2004 2005 2006 % of GDP
'
US
EU-25
CN
NMS10 RU JP
Main findings
‚ In 2005 R&D intensity (i.e. R&D expenditure as a % of GDP) in the European Union stabilised at 1.85%.
‚ In 2005 however, EUR 200.6 billion in nominal terms were spent on R&D in the EU-25, an increase of 3.6 % over the previous year.
‚ At national level, only two countries reached R&D intensities above the 2010 target of 3 % set by the Lisbon Strategy, namely Sweden (3.86 %) and Finland (3.48 %). China has made rapid progress, achieving an R&D intensity of 1.34 % in 2005.
‚ In the business enterprise sector (BES) the highest values in 2005 were recorded by Sweden (2.92 %), ahead of Finland (2.46 %), Germany (1.76 %) and Denmark (1.67 %).
‚ The business sector accounts for more than half of R&D expenditure, with an average of 55%. The situation at national level reveals a more diverse picture, with Luxembourg (80%), Japan (75 %), Switzerland, (70 %) and Finland (69 %) all achieving higher percentages.
‚ In 2004 more than 2% of all persons employed were active as researchers in Switzerland (4.4 %), Iceland (2.3 %) and Finland (2.2 %).
(
#
Manuscript completed on: 21.02.2007 Data extracted on: 11.10.2006 ISSN 1977-0316
2 St a t i s t i c s i n f o c u s — Science and technology — 23/2007 _______________________________________________
#
In 2005, R&D intensity (i.e. R&D expenditure as a % of GDP) in the EU stabilised at 1.85%, following the slight decrease observed in 2004. A similar slowdown was seen in the United States and Japan, leaving the gap between the three major economies in terms of R&D intensity unchanged. By contrast R&D intensity increased in the new
Member States (NMS10) who joined in May 2004 and China by 0.03 and 0.11 percentage points respectively. In 2005, China confirmed the steep increase which had enabled it to double its R&Dratio in less than a decade. For NMS10, the increase in R&D expenditure as a share of GDP is the first increase recorded in the last 10 years (Figure 1).
At EU level R&D intensity is stable but expenditure is increasing in volume
At the level of individual EU Member States, only Sweden (3.86 %) and Finland (3.48 %) achieved R&D intensities above the 2010 target of 3 % set by the Lisbon Strategy. Sweden is still at the top of the league, far ahead of other countries, even though its figures are slowly falling. For instance, more than 1.3 percentage points separated Germany, ranked in third position, from Sweden and only six countries had R&D intensities above 2 %. Among those countries Austria (2.36 %), Finland (3.48 %) and Germany (2.51 %) recorded positive trends in R&D intensity (Table 2). Significant increases in R&D intensity were also observed
for the Czech Republic and Latvia (more than + 0.15 percentage points).
In the business enterprise sector (BES), the highest values in 2005 were recorded by Sweden (with 2.92 %), ahead of Finland (2.46 %), Germany (1.76 %) and Denmark (1.67 %). For these countries there were only slight changes compared to the previous year. The biggest percentage point increases were in the Czech Republic (+ 0.12 %), Austria (+ 0.09 %) and Estonia (+ 0.08 %).
Table 2: R&D expenditure in million euro and as a percentage of GDP, all sectors and business enterprise sector, EU-27, EU-25 and selected countries — 2002 to 2005
EU-27 185 878 s 187 708 s 193 984 s 201 020 s 1.88 s 1.87 s 1.84 s 1.84 s 119 083 s 119 669 s 123 582 128 091 s 1.21 s 1.19 s 1.17 s 1.17 s EU-25 185 613 s 187 416 s 193 650 s 200 633 s 1.89 s 1.88 s 1.85 s 1.85 s 118 957 s 119 533 s 123 428 s 127 913 s 1.21 s 1.20 s 1.18 s 1.18 s BE 5 201 5 177 5 350 p 5 428 p 1.94 1.89 1.85 p 1.82 p 3 662 3 608 3 714 p 3 705 p 1.37 1.31 1.28 p 1.24 p BG 81 89 99 106 0.49 0.50 0.51 0.50 15 18 24 23 0.09 0.10 0.12 0.11 CZ 959 1 013 1 100 1 417 1.20 1.25 1.26 1.42 586 618 701 914 0.73 0.76 0.80 0.92 DK 4 634 4 855 4 899 p 5 097 p 2.51 2.56 2.48 p 2.44 p 3 198 3 355 3 332 3 481 p 1.73 1.77 1.69 1.67 p DE 53 364 54 539 55 215 56 356 e 2.49 2.52 2.50 2.51 e 36 950 38 029 38 611 39 406 e 1.72 1.76 1.75 1.76 e EE 56 67 83 104 p 0.72 0.79 0.88 0.94 p 17 23 32 47 p 0.22 0.27 0.34 0.42 p IE 1 436 e 1 607 e 1 780 p 2 020 ep 1.10 e 1.16 e 1.21 p 1.25 ep 988 e 1 076 1 150 p 1 320 ep 0.76 e 0.77 0.78 p 0.82 ep EL : 978 1 021 p 1 112 p : 0.63 0.61 p 0.61 p 287 313 317 p 326 p 0.20 0.20 0.19 p 0.18 p ES 7 194 8 213 8 946 10 100 ep 0.99 1.05 1.06 1.12 ep 3 926 b 4 443 4 865 5 491 ep 0.54 b 0.57 0.58 0.61 ep FR 34 527 34 569 35 534 36 396 p 2.23 2.17 2.14 2.13 p 21 839 21 646 22 210 22 543 p 1.41 1.36 1.34 1.32 p
IT 14 600 14 769 15 253 : 1.13 1.11 1.10 : 7 057 6 979 7 293 7 806 p 0.54 0.52 0.53 0.55 p CY 34 41 47 54 p 0.30 0.35 0.37 0.40 p 7 9 10 12 p 0.06 0.07 0.08 0.09 p LV 42 38 47 73 0.42 0.38 0.42 0.57 17 13 21 30 0.17 0.13 0.19 0.23 LT 100 111 137 157 0.66 0.67 0.76 0.76 17 23 29 32 0.11 0.14 0.16 0.16
LU : 426 448 458 p : 1.66 1.66 1.56 p : 379 393 395 p : 1.48 1.46 1.34 p
HU 706 i 693 i 721 i 838 i 1.00 i 0.93 i 0.88 i 0.94 i 250 255 297 362 0.35 0.34 0.36 0.41 MT 12 11 28 b 27 p 0.26 0.26 0.63 b 0.61 p 3 4 19 b 19 p 0.07 0.08 0.45 b 0.42 p NL 8 019 8 376 8 723 p : 1.72 1.76 1.78 p : 4 543 4 804 5 039 5 148 p 0.98 1.01 1.03 1.02 p AT 4 684 4 998 e 5 250 5 784 ep 2.12 2.21 e 2.23 2.36 ep 3 131 : 3 556 3 919 ep 1.42 : 1.51 1.60 ep PL 1 172 1 036 1 139 1 386 0.56 0.54 0.56 0.57 238 284 327 440 0.11 0.15 0.16 0.18 PT 1 029 e 1 020 1 104 ep 1 189 p 0.76 e 0.74 0.77 ep 0.81 p 334 e 338 384 ep 430 p 0.25 e 0.25 0.27 ep 0.29 p RO 184 203 235 : 0.38 0.39 0.39 : 111 118 130 : 0.23 0.22 0.21 :
SI 360 328 379 338 i 1.52 1.32 1.45 1.22 i 215 209 254 241 p 0.91 0.84 0.97 0.87 p SK 148 169 174 194 0.57 0.58 0.51 0.51 95 93 86 97 0.37 0.32 0.25 0.25
FI 4 830 5 005 5 253 5 474 3.36 3.43 3.46 3.48 3 375 3 528 3 683 3 877 2.34 2.42 2.42 2.46
SE : 10 642 i : 11 109 : 3.95 i : 3.86 : 7 886 i : 8 410 : 2.93 i : 2.92
UK 30 496 28 658 29 956 : 1.83 1.79 1.73 : 19 830 18 319 18 883 : 1.19 1.14 1.09 :
IS 280 e 274 297 : 2.99 e 2.86 2.83 : 160 e 142 167 : 1.71 e 1.48 1.59 :
NO 3 388 3 411 3 317 3 599 p 1.67 1.73 1.62 1.51 p 1 946 1 960 1 821 1 944 p 0.96 0.99 0.89 0.82 p EEA28 189 281 s 191 101 s 197 259 s 204 574 s 1.89 s 1.88 s 1.85 s 1.84 s 121 063 s 121 635 s 125 404 s 130 034 s 1.21 s 1.20 s 1.18 s 1.17 s
CH : : 8 486 : : : 2.93 : : : 6 257 : : : 2.16 :
HR 271 292 345 : 1.11 1.11 1.22 : 115 114 144 : 0.47 0.44 0.51 :
TR 1 280 : : : 0.66 : : : 367 : : : 0.19 : : :
CN 16 452 16 444 19 097 24 030 1.07 1.13 1.23 1.34 10 066 10 256 12 761 7 719 0.65 0.71 0.82 0.91 JP 115 676 119 748 133 684 : 3.18 3.20 3.18 : 86 112 89 783 100 519 : 2.36 2.40 2.39 : RU 4 545 4 899 5 473 6 559 1.25 1.28 1.16 1.07 3 176 3 353 3 780 4 458 0.87 0.88 0.80 0.73 US 292 153 i 258 520 pi 251 254 pi : 2.65 i 2.68 pi 2.68 pi : 205 021 i 180 343 pi 176 241 pi : 1.86 i 1.87 ip 1.88 ip :
NOTES
EU-27, EU-25 and EEA28: Eurostat estimates Information note (i):
HU - Total R&D expenditure: Defence is excluded; SE - 2003: underestimated data; SI - 2005 and Total R&D expenditure: underestimated data; US: excludes most or all capital expenditure.
Source: Eurostat/R&D statistics -OECD - MSTI 2006/1
2002 2004
Millions of Euro as a % of GDP
2002 2004 2005 2005
2003 2003
Business enterprise R&D expenditure
Millions of Euro as a % of GDP Total R&D expenditure
2002 2004 2005
[image:2.595.45.554.290.725.2]______________________________________________ 23/2007 — Science and technology — St at ist ic s in foc us 3
#"
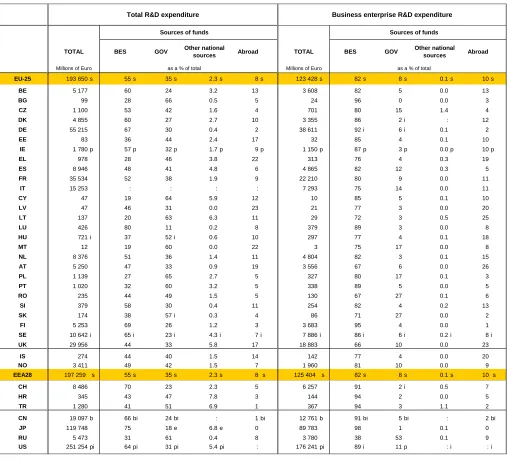
In the EU, 55% of R&D expenditure was funded by the BES in 2005
Table 3 indicates that ‘industry’ is the most important source of financing of R&D in almost all countries except the new Member States. On average, however, the EU's performance is below the objective of the Lisbon Strategy which set a level of 66 % for private R&D funding. It is the business sector- with 55% - that still contributes the largest share. This percentage ranks behind the national rates of Luxembourg (80 %), Japan (75 %), Switzerland (70 %), Finland (69 %), China (66 %) and the United States (63 %).
The government sector (GOV) comes in second place, funding 35 % of the EU's R&D expenditure, whereas funding from abroad remains small - amounting to 8 % in the EU in 2004.
The situation is different in the new Member States, the candidate countries and the Russian Federation, where the sources of finance are more balanced and the government sector plays a greater role in R&D funding.
Table 3: R&D expenditure by sources of funds in million euro and as a percentage of total, all sectors and business enterprise sector, EU-25 and selected countries — 2004
EU-25 193 650 s 55 s 35 s 2.3 s 8 s 123 428 s 82 s 8 s 0.1 s 10 s
BE 5 177 60 24 3.2 13 3 608 82 5 0.0 13
BG 99 28 66 0.5 5 24 96 0 0.0 3
CZ 1 100 53 42 1.6 4 701 80 15 1.4 4
DK 4 855 60 27 2.7 10 3 355 86 2 i : 12
DE 55 215 67 30 0.4 2 38 611 92 i 6 i 0.1 2
EE 83 36 44 2.4 17 32 85 4 0.1 10
IE 1 780 p 57 p 32 p 1.7 p 9 p 1 150 p 87 p 3 p 0.0 p 10 p
EL 978 28 46 3.8 22 313 76 4 0.3 19
ES 8 946 48 41 4.8 6 4 865 82 12 0.3 5
FR 35 534 52 38 1.9 9 22 210 80 9 0.0 11
IT 15 253 : : : : 7 293 75 14 0.0 11
CY 47 19 64 5.9 12 10 85 5 0.1 10
LV 47 46 31 0.0 23 21 77 3 0.0 20
LT 137 20 63 6.3 11 29 72 3 0.5 25
LU 426 80 11 0.2 8 379 89 3 0.0 8
HU 721 i 37 52 i 0.6 10 297 77 4 0.1 18
MT 12 19 60 0.0 22 3 75 17 0.0 8
NL 8 376 51 36 1.4 11 4 804 82 3 0.1 15
AT 5 250 47 33 0.9 19 3 556 67 6 0.0 26
PL 1 139 27 65 2.7 5 327 80 17 0.1 3
PT 1 020 32 60 3.2 5 338 89 5 0.0 5
RO 235 44 49 1.5 5 130 67 27 0.1 6
SI 379 58 30 0.4 11 254 82 4 0.2 13
SK 174 38 57 i 0.3 4 86 71 27 0.0 2
FI 5 253 69 26 1.2 3 3 683 95 4 0.0 1
SE 10 642 i 65 i 23 i 4.3 i 7 i 7 886 i 86 i 6 i 0.2 i 8 i
UK 29 956 44 33 5.8 17 18 883 66 10 0.0 23
IS 274 44 40 1.5 14 142 77 4 0.0 20
NO 3 411 49 42 1.5 7 1 960 81 10 0.0 9
EEA28 197 259 s 55 s 35 s 2.3 s 8 s 125 404 s 82 s 8 s 0.1 s 10 s
CH 8 486 70 23 2.3 5 6 257 91 2 i 0.5 7
HR 345 43 47 7.8 3 144 94 2 0.0 5
TR 1 280 41 51 6.9 1 367 94 3 1.1 2
CN 19 097 b 66 bi 24 bi : 1 bi 12 761 b 91 bi 5 bi : 2 bi
JP 119 748 75 18 e 6.8 e 0 89 783 98 1 0.1 0
RU 5 473 31 61 0.4 8 3 780 38 53 0.1 9
US 251 254 pi 64 pi 31 pi 5.4 pi : 176 241 pi 89 i 11 p : i : i
NOTES
EU-25, EEA28: Eurostat estimates
Exceptions to the reference year 2004: MT, TR 2002; BE, DK, EL, LU, NL, PT, SE, IS, NO, JP: 2003 Information note (i):
HU - Total R&D expenditure: Defence is excluded; DK: includes other classes;DE: BES underestimated data, GOV overestimated data; SE, SK: underestimated data. CH: Federal or central government only; CN: the sum of the breakdown does not add up to the total; US - Total R&D expenditure: excludes most or all capital expenditure.
US - BES and sector of funds BES: excludes most or all capital expenditure, includes R&D in the SSH and includes other classes; US - BES and sector of funds Other and Abroad: included elsewhere.
Source: Eurostat/R&D statistics -OECD - MSTI 2006/1 Millions of Euro as a % of total
Sources of funds
BES GOV Other national sources Abroad TOTAL
as a % of total Millions of Euro
Abroad Other national
sources GOV
TOTAL
Total R&D expenditure
BES
Sources of funds
[image:3.595.46.553.233.694.2]4 St a t i s t i c s i n f o c u s — Science and technology — 23/2007 _______________________________________________
#
Researchers accounted for almost 1 % of total employment in the EU in 2004
In Switzerland (4.4 %), Iceland (2.3 %) and Finland (2.2 %) more than 2% of all persons employed were active as researchers in 2004 (Figure 4). Norway and Denmark recorded respective shares of 1.6% and 1.4% followed by larger countries such as Japan (1.3%) and Germany (1.1%). At the lower end, in Romania, Cyprus, Turkey and Bulgaria researchers accounted for 0.3 % to 0.4 % of total employment in 2004.
In the business enterprise sector the biggest proportions of researchers in total employment were observed in the small
EU economies: Finland (1.1 %) comes ahead of Luxembourg (0.9%) and Denmark (0.8%). Also in this sector, in seven countries researchers make up over 0.7% of total employment, which is almost twice the EU average (Figure 4). The only country which stood out in all performance sectors was Finland.
[image:4.595.55.542.251.724.2]Researchers were not very well represented in business employment, with rates below 0.1 % in seven countries (Greece, Cyprus, Latvia, Lithuania, Poland, Portugal and Slovakia).
Figure 4: R&D researchers as a percentage of total employment (HC), all sectors and business enterprise sector, EU-25 and selected countries — 2004
Notes
EU-25: Eurostat estimate
Exceptions to the reference year 2004: TR 2002; BE, DE, EL, LU, NL, PT, SE, IS, NO, JP: 2003 Information note (i):
FR, HU - Total: Defence excluded; IE: provisional data; FI: data by qualification; MT: the sum of the breakdown does not add up to the total; SE, NO: University graduates instead of researchers; LU: Data in the Total sectors with reference to the HES correspond to 2001.
Source: Eurostat/R&D statistics -OECD - MSTI 2006/1
Total sectors 0.9 1.1 0.4 0.7 1.4 1.1 1.0 0.9 0.7 0.9 1.0 0.5 0.4 0.6 0.8 1.1 0.8 0.6 0.6 1.2 0.7 0.7 0.3 0.6 0.8 2.2 0.8 2.3 1.6 4.4 0.8 0.3 1.3 0.6
0.0 1.0 2.0 3.0 4.0 5.0
EU-25 BE BG CZ DK DE EE IE EL ES FR IT CY LV LT LU HU MT NL AT PL PT RO SI SK FI SE IS NO CH HR TR JP RU
Business enterprise sector
0.4 0.5 0.0 0.3 0.8 0.5 0.2 0.4 0.1 0.2 0.5 0.1 0.1 0.1 0.0 0.9 0.1 0.1 0.3 0.5 0.1 0.1 0.1 0.2 0.1 1.1 0.7 0.8 0.7 1.4 0.1 0.0 0.8 0.4
0.0 0.2 0.4 0.6 0.8 1.0 1.2 1.4 1.6
______________________________________________ 23/2007 — Science and technology — St at ist ic s in foc us 5
#"
In 2004, R&D personnel in FTE in the EU-25 numbered about 2 millions
In 2005, Germany and France employed almost half of the EU’s R&D personnel measured in full-time equivalents, as their R&D personnel amounted to 469 500 and 352 485 persons respectively (Table 5). Spain and Italy came next, with 173 804 and 164 026 persons respectively.
Whereas Germany accounted for 23% of total R&D personnel in the EU-25, it employed 27% of the EU-25’s R&D personnel in the BES and only 15% in the higher education (HES). In absolute terms, Germany and France also led in all economic sectors, generally followed in third and fourth places by Spain and Italy.
Among the new member states, the main countries employing R&D personnel are Poland (76 761), the Czech Republic (43 371) and Hungary (23 239). At the EU-25 level these three rank 7th, 12th and 15th respectively. Except for the Czech Republic, most of the R&D personnel work in the public sector, in contrast to the old Member States.
The biggest proportions of researchers among R&D personnel are found in Portugal (82 %), Poland (81 %), Estonia (76 %) and Slovakia (76 %). In the big economies like Germany, France or Italy, other R&D personnel make up to 40% of the total.
Table 5: R&D personnel and researchers in FTE and in percentage, EU-25 and selected countries — 2005
EU-25 2 040 667 s 1 095 490 s 292 185 s 632 313 s 60 s 55 s 55 s 70 s
BE 54 128 p 31 861 p 3 967 p 17 689 p 59 p 51 p 56 p 74 p
BG 15 853 2 062 10 172 3 367 63 56 60 77
CZ 43 370 22 143 10 223 10 776 56 47 60 70
DK 43 545 p 28 461 p 3 078 p 11 668 p 65 p 62 p 66 p 71 p
DE 469 500 e 298 000 e 76 000 e 95 500 e 57 e 54 e 53 e 69 e
EE 4 363 p 1 399 p 696 2 176 76 p 63 p 68 88
IE 16 168 ep 10 000 ep 1 168 ep 5 000 e 69 ep 64 ep 44 ep 85 e
EL 34 004 p 11 099 p 5 509 p 17 189 p 50 p 39 p 42 p 60 p
ES 173 804 pe 75 616 pe 31 832 pe 66 001 pe 63 pe 47 pe 64 pe 81 pe
FR 352 485 197 223 51 931 i 97 036 57 54 48 i 67
IT 164 026 67 519 32 401 60 694 44 41 44 47
CY 1 075 p 240 p 360 p 400 p 59 p 50 p 31 p 94 p
LV 5 483 1 370 1 256 2 856 60 34 47 78
LT 11 002 1 190 3 113 6 699 69 60 58 76
LU 4 360 p 3 623 p 553 p 184 p 48 p 42 p 69 p 96 p
HU 23 239 i 7 393 7 652 i 8 194 68 i 68 65 i 72
MT 701 p 353 p 56 292 63 p 54 p 50 77
NL 91 594 p 49 915 13 579 i 28 100 p 41 46 57 i 36
AT 46 612 ep 31 671 ep 2 212 ep 12 499 ep 61 ep 57 ep 51 ep 72 ep
PL 76 761 13 966 17 877 44 763 81 67 68 90
PT 25 651 p 6 208 p 4 173 p 11 892 p 82 p 66 p 71 p 94 p
RO 33 361 16 368 9 853 6 917 64 56 64 82
SI 7 021 4 292 1 788 910 55 44 65 82
SK 14 404 3 524 3 717 7 146 76 55 67 90
FI 57 471 32 109 7 422 17 453 69 68 59 74
SE 77 925 56 941 3 391 17 223 69 60 84 97
UK : 147 356 : : : 65 : :
IS 3 050 1 422 794 746 65 62 60 77
NO 30557 p 16710 p 5147 p 8700 p 72 p 68 p 67 p 80 p
EEA28 2 073 353 s 1 113 062 s 297 964 s 641 559 s 60 s 55 s 55 s 71 s
CH 52 250 33 085 810 i 18 355 e 49 38 52 i 67 e
HR 11 162 2 831 3 634 4 697 64 36 67 79
TR 28 964 5 918 5 502 17 544 83 62 50 100 i
CN 1 094 831 656 097 249 477 189 257 79 74 77 98
JP 882 414 580 628 61 893 224 049 77 79 54 77
RU 973 382 592 625 278 756 99 299 50 45 53 72
NOTES
EU-25, EEA28: Eurostat estimates
Exceptions to the reference year 2005: EU-25, EU-15, EEA, FR, IT, NL (Total personnel), IS, CH, HR, RO: 2004; NL (RSE), CN, JP, RU: 2003; TR 2002. Information note (i):
FR, HU - Total: Defence excluded; NL: includes other classes; TR: University graduates instead of researchers; CH: Federal or central government only.
Source: Eurostat/R&D statistics -OECD - MSTI 2006/1
Researchers as a % of total R&D personnel
TOTAL BES GOV HES
BES TOTAL
TOTAL R&D personnel in FTE
[image:5.595.42.551.249.701.2]6 St a t i s t i c s i n f o c u s — Science and technology — 23/2007 _______________________________________________
#
Between 2002 and 2004, there were 3% more EU researchers per year on average
The annual percentage increase in the number of researchers was greater than the increase in total R&D personnel: 3.5 % against 1.9 % in 2004 (Table 6). In particular there was an increase in researchers in seven countries which recorded annual growth rates above 5 %: Sweden, Hungary, Denmark, Cyprus, Spain, Austria and the Czech Republic.
Except for Germany, the number of researchers increased over the past year in all the big EU economies.
At the other end of the scale, R&D personnel showed a small decrease, i.e. less than 2 %, in eight EU countries. Estonia was the exception, recording a decrease of about 8 % (Table 6).
Disparities between countries also appear when calculating the annual average growth rate (AAGR) of total R&D personnel for the period 2002-2005. The top rankings are held by three smaller economies: the Czech Republic once again (18.5 %), Malta (13.8 %) and Cyprus (9.3 %), ahead of Spain (9 %). These countries are leading in terms of both total R&D personnel and researchers in FTE.
Spain is ahead among the bigger EU countries, with an AAGR of 9 %, but a large gap separates it from the other countries, namely France (1.3 %), Italy (0%) and Germany (-0.7 %). No data were available for the UK.
Table 6: R&D personnel and researchers in FTE, annual growth rate and annual average growth rate 2002 – 2005, EU-25 and selected countries — 2002 – 2005
EU-25 2.2 s 0.6 s 1.9 s : 1.3 3.0 s 2.4 s 3.5 s : 3.0
BE -7.0 0.4 1.3 p 2.3 p 1.3 -4.9 0.8 1.8 p 1.6 p 1.4
BG 0.5 2.8 1.3 1.3 1.8 0.1 4.0 2.5 2.3 2.9
CZ -0.3 7.4 2.9 50.8 18.5 -0.1 5.6 3.1 48.3 17.3
DK 6.3 -1.9 2.6 2.0 p 0.9 31.3 b -2.6 5.2 7.7 p 3.3
DE -0.1 e -1.6 -0.3 -0.3 e -0.7 0.5 e 1.2 0.7 -1.0 e 0.3
EE 10.3 0.4 14.3 -7.9 p 1.9 14.1 -1.4 11.7 -1.1 p 2.9
IE 2.0 e 6.4 8.7 p 2.9 ep 6.0 4.8 e 7.1 8.7 p 2.2 ep 5.9
EL : 2.6 : 3.3 p 3.0 : 4.3 : 4.4 p 4.3
ES 6.8 12.8 6.9 7.3 pe 9.0 4.0 11.0 9.2 8.7 pe 9.6
FR 3.1 0.7 1.9 : 1.3 5.1 3.4 3.8 : 3.6
IT 6.6 -1.3 1.4 : 0.0 6.8 -1.3 2.4 : 0.5
CY 19.2 12.1 10.3 5.8 p 9.3 30.4 12.6 19.0 8.2 p 13.2
LV -3.3 -8.2 5.0 7.4 1.2 -1.3 -7.2 3.8 -1.3 -1.7
LT -20.2 1.2 9.4 4.2 4.9 -21.7 4.4 11.4 3.8 6.5
LU : : 7.7 1.0 p : : : 4.2 3.0 p :
HU 3.3 i -1.7 i -2.1 i 1.8 i -0.7 i 2.0 i 1.4 i -1.8 i 6.5 i 2.0 i
MT : -13.1 73.5 b -2.2 p 13.8 : 1.6 57.7 b 1.5 p 17.6
NL -2.0 -1.6 6.5 p : 2.4 -16.2 b -2.3 : : :
AT : : 5.0 8.7 ep 6.2 : : 3.7 8.7 ep 5.4
PL -1.3 1.1 1.7 -2.0 0.2 1.0 3.3 4.0 2.0 3.1
PT 5.6 e 5.3 0.2 ep 0.2 p 1.9 7.1 e 6.6 1.9 ep 1.8 p 3.4
RO 0.5 0.8 0.9 : 0.9 2.8 3.3 1.4 : 2.4
SI 0.1 -21.0 4.8 -1.6 -6.6 3.2 -18.7 6.8 -4.9 -6.2
SK -5.5 -2.0 7.3 0.5 1.9 -4.2 4.9 11.3 1.9 6.0
FI 3.0 3.9 1.9 -1.4 1.4 : : : -3.5 :
SE : 0.5 : 3.3 1.9 : 2.0 : 6.3 4.1
UK : : : : : : : : : :
IS -3.6 e 5.1 3.7 : 4.4 : 1.5 3.7 : 2.2
NO 1.0 6.1 2.5 2.7 p 3.8 : 2.3 0.8 3.3 p 2.2
EEA28 2.2 s 0.7 s 1.9 s : 1.3 3.0 s 2.4 s 3.6 s : 3.0
CH : : 0.0 : : : : -0.9 : :
HR : -29.4 22.0 : -7.2 : -31.6 21.8 : -8.7
TR 4.6 : : : : 5.7 : : : :
CN 8.2 5.8 : : : 9.1 6.4 : : :
JP -3.9 b 2.9 : : : -4.3 b 4.5 : : :
RU -2.1 -1.4 -2.2 : -1.8 -2.7 -0.9 -2.0 : -1.5
NOTES
EU-25, EEA28: Eurostat estimates
AAGR: Annual average growth rate; AGR: Annual growth rate; Exceptions to the reference periods:
AAGR 2002-2005 - Total personnel: EU-25, EEA, FR, IT, NL, IS, CH, RU: 2002-2004; EL, SE: 2001-2005 AGR - Total personnel:EL, SE 2001/03, 2003/05; AT: 2002/04; CH: 2000/04 AAGR 2002-2005 - RSE: EU-25, EEA, FR, HR, RO, RU: 2002-2004; IS: 2001-2004; EL, SE: 2001-2005 AGR - RSE: see the exception for total personnel plus IS, NO: 2001/03 Information note (i):
HU: Defence excluded.
Source: Eurostat/R&D statistics -OECD - MSTI 2006/1 2002
Total R&D personnel - FTE
2002 2003
2003
Researchers - FTE
Annual growth rate - %
2005 2004
AAGR 2002-2005 % 2004
2005
AAGR 2002-2005 %
[image:6.595.45.553.262.692.2]______________________________________________ 23/2007 — Science and technology — St at ist ic s in foc us 7
#"
Ü
E S S E N T I A L I N F O R M A T I O N – M E T H O D O L O G I C A L N O T E S
Research and experimental development (R&D)
Research and experimental development activities comprise creative work undertaken on a systematic basis in order to increase the stock of knowledge, including knowledge of man, culture and society and the use of this stock of knowledge to devise new applications.
Institutional classifications
Internal expenditure and R&D personnel are broken down with reference to the four institutional sectors in which the R&D takes place.
The business enterprise sector (BES)
With regard to R&D, the business enterprise sector includes: all firms, organizations and institutions whose primary activity is the market production of goods or services (other than higher education) for sale to the general public at an economically significant price and the private non-profit institutions mainly serving them — Frascati Manual, § 163.
The government sector (GOV)
In the field of R&D, the government sector includes: all departments, offices and other bodies which furnish but normally do not sell to the community those common services, other than higher education, which cannot otherwise be conveniently and economically provided, and administer the state and the economic and social policy of the community (public enterprises are included in the business enterprise sector) as well as PNPs controlled and mainly financed by government — Frascati Manual, § 184.
The higher education sector (HES)
This sector comprises: all universities, colleges of technology and other institutes of post-secondary education, whatever their source of finance or legal status. It also includes all research institutes, experimental stations and clinics operating under the direct control of or administered by or associated with higher education establishments — Frascati Manual, § 206.
The private non-profit sector (PNP)
This sector covers: non-market, private non-profit institutions serving households (i.e. the general public) and private individuals or households — Frascati Manual, § 194.
R&D indicators - Expenditure
‚ Current EUR
Current EUR values are obtained for the Eurozone by recalculating former national currency values on the basis of the fixed exchange rate and then applying the average exchange rate for the year in question. As a result, the values for countries appearing in tables quoted in national currencies differ from those quoted in current EUR for years before 1999, except in the case of Greece (2001). Current EUR values for non-Eurozone countries are obtained by directly applying the average exchange rate for the year in question.
‚ R&D intensity and GDP
R&D intensity represents the R&D expenditure as a percentage of GDP. It is calculated by relating R&D expenditure in current national currencies to GDP for the sectors and years in question.
At the national level, the GDP used for the calculation of R&D intensity correspond to the table ‘a_gdp_c’ in NewCronos. The release date for both GDP tables was 18/11/2006.
Eurostat implemented the allocation of FISIM in the annual European aggregates starting with the first regular release on 30 November 2005. Before that date, there was no allocation of FISIM in euro-zone and EU-25 aggregates.
‚ R&D expenditure by sources of funds
Sources of funds are subdivided into five sources of funds: Business Enterprise, Government, Higher Education, Private non-profit and Abroad.
R&D indicators - R&D personnel
All persons employed directly on R&D should be counted, as well as those providing direct services such as R&D managers, administrators and clerical staff. Those providing indirect services, such as canteen and security staff, should be excluded — Frascati Manual, § 294-296.
‚ Researchers (RSE)
Researchers are professionals engaged in the conception or creation of new knowledge, products, processes, methods and systems, and in the management of the projects concerned —
Frascati Manual, § 301.
‚ Full-time equivalent (FTE)
One FTE may be thought of as one person-year. For instance, a person who normally spends 40% of his time on R&D and the rest of it on other work (e.g. lecturing, university administration, guidance) should be counted as only 0.4 FTE — Frascati Manual, § 331-345.
‚ Personnel by number of individuals (by headcounts, HC)
It represents the number of individuals who are employed mainly or partly on R&D — Frascati Manual, § 326-330.
‚ R&D personnel and researchers as a percentage of employment
The source for the employment statistics is the European Labour Force Survey (EU LFS).
European aggregates
For R&D personnel, EU totals are calculated as the sum of the national data by sector. If data are missing, estimates are first made for the country in question, reference period, institutional sector or relevant R&D variable, as appropriate. This method is not identically applied to the calculation of R&D personnel in head count (HC). The estimates for R&D personnel in full-time equivalent (FTE) serve as a basis for the HC calculation. An FTE/HC ratio based on available FTE and HC personnel data at the national level is estimated for the EU aggregates, by institutional sector and by year. This ratio is then applied to the FTE data to calculate the EU totals in HC.
Sources
United States, Japan and China: OECD, Main Science and
Technology Indicators – MSTI 2006/1.
General abbreviations
AAGR annual average growth rate p provisional value
e estimated value s Eurostat estimate r revised value f forecast b break in series
i more information in metadata : not available
Reference manual
Standard method proposed for research and experimental development surveys — Frascati Manual, OECD, 2002.
Further information:
Data:
EUROSTAT Website/Home page/Science and technology/Data
Science and technology
Research and development
Statistics on research and development
R&D expenditure at national and regional level
R&D personnel at national and regional level