UNIVERSITI TEKNIKAL MALAYSIA MELAKA
FATIGUE LIFE SIMULATION OF SPOT WELD JOINT
STRUCTURE BASED ON FINITE ELEMENT ANALYSIS
This report submitted in accordance with requirement of the Universiti Teknikal Malaysia Melaka (UTeM) for the Bachelor Degree of Engineering Technology
(Manufacturing Engineering Technology) (Hons.) (Product Design)
by
MUHAMMAD FAIZ BIN CHE MUSA
B071310451
UNIVERSITI TEKNIKAL MALAYSIA MELAKA
BORANG PENGESAHAN STATUS LAPORAN PROJEK SARJANA MUDA
TAJUK: Fatigue Life Simulation on Spot Weld Joint Structure Based On Finite Element Analysis
SESI PENGAJIAN: 2015/16 Semester 2
Saya MUHAMMAD FAIZ BIN CHE MUSA
Mengaku membenarkan Laporan PSM ini disimpan di PerpustakaanUniversiti Teknikal Malaysia Melaka (UTeM) dengan syarat-syarat kegunaan seperti berikut:
1. Laporan PSM adalah hak milik Universiti Teknikal Malaysia Melaka dan penulis. 2. Perpustakaan Universiti Teknikal Malaysia Melaka dibenarkan membuat salinan untuk
tujuan pengajian sahaja dengan izin penulis.
3. Perpustakaan dibenarkan membuat salinan laporan PSM ini sebagai bahan pertukaran antara institusi pengajian tinggi.
4. **Sila tandakan ( )
SULIT
TERHAD
TIDAK TERHAD
(Mengandungi maklumat yang berdarjah keselamatan atau kepentingan Malaysia sebagaimana yang termaktub dalam AKTA RAHSIA RASMI 1972)
(Mengandungi maklumat TERHAD yang telah ditentukan oleh organisasi/badan di mana penyelidikan dijalankan)
AlamatTetap:
NO 2, JALAN MELOR 1/2
Disahkan oleh:
i
DECLARATION
I hereby, declared this report entitled “Fatigue Life Simulation Of Spot Weld Joint
Structure Based On Finite Element Analysis ” is the results of my own research except
as cited in references.
Signature : ……….
Author’s Name : ………
APPROVAL
This report is submitted to the Faculty of Engineering Technology of UTeM as a
partial fulfillment of the requirements for the degree of Bachelor of Manufacturing
Engineering Technology (Product Design) with Honours. The member of the
supervisory is as follow:
………
iii
ABSTRAK
Projek ini bertujuan untuk menjalankan analisis unsur-unsur pada model tempat
struktur kimpal untuk meramal dan menentukan hayat lesu dengan menggunakan
perisian Solidworks. Bahan yang digunakan adalah besi tergalvani dan aluminium. Dua
plat besi Tergalvani dan aluminium akan dianalisis dalam perisian Solidworks bertindak
sebagai dua plat yang digunakan pada tempat kimpalan rintangan. Kajian mengenai
hayat lesu pada bahan yang digunakan akan dijalankan.
Bahan-bahan yang akan dianalisis mempunyai ketebalan yang berbeza. Beban ini
akan digunakan untuk bahan bagi menentukan apakah had bahan boleh bertahan
sebelum ianya lesu. Data daripada masa kitaran dan beban bahan yang akan
dikumpulkan dan ianya akan dianalisis bagi menentukan kaedah yang berkesan untuk
mengurangkan kelesuan bahan. Hayat lesu akan diteliti melalui analisis unsur-unsur
yang terdiri daripada plot kontur dalam proses simulasi. Nilai yang menyebabkan
kelesuan bahan boleh ditentukan daripada plot kontur.
Hasil ramalan akan dibandingkan dengan data eksperimen dalam mencari kaedah
prestasi dan analisis yang terbaik. Daripada data yang telah dikumpulkan, ianya akan
menunjukkan masa kitaran dan loading yang sesuai untuk bahan-bahan bagi mencegah
ABSTRACT
This project was aimed to run finite element analysis on spot welded joint model
to predict and determine fatigue life for spot welded by using Solidworks software. The
material that is using is the galvanized iron and aluminum. Two plates of galvanized iron
and aluminum will be analyzed in the Solidworks software reacted as two plates that are
using by spot welding. There will be studies about fatigue life on the material that are
used.
The materials that will be analyzed have different thicknesses. The load will be
applied to the material to determine what are the limitation of the material can hold
before it fatigue. The data from cycle time and loading of the material will be collected
and it will be analyzed which are the effective method to reduce the fatigue of the
material. Fatigue life will be observed through the finite element analysis which consists
of the contour plot in the simulation process. The value that causes the fatigue of the
material can be determined from the contour plot.
The result of the prediction will be compared to an experimental data in finding
the best performance and analysis method. From the data that have been collected, it will
show that which cycle time and loading that are suitable for materials to prevent the
v
DEDICATION
Firstly thank to Allah S. W. T for the opportunity to finish this project. I owe this project
and my true happiness to my beloved parent. Since the day I started going to this
ACKNOWLEDGMENTS
This report teaches and provides me a basic knowledge of engineering and helps
me to understanding more about Fatigue life studies and force direction. This report
inevitably involves many helping hands. First of all, I am extremely grateful and thanks
to my supervisor, Mr. Mohammad Khalid b. Wahid for all the guidance and critics given
to me directly or indirectly, and also his friendly in time to teach and explain to me
amicably. Once again thanks you for your idea, knowledge and guidance that make me
more understand and can develop further thinking for this project.
Finally, I would like to thank to all my family and friends, thank you for all the
spirit word, love and helping me during the whole period which gave me the strength I
vii
TABLE OF CONTENTS
Declaration i
Supervisor’s Approval ii
Abstrak iii
Abstract iv
Dedication v
Acknowledgement vi
Table of Contents vii-ix
List of Table x
List of Figure xi-xiii
CHAPTER 1: INTRODUCTION
1.1 Background of Project 1
1.2 Statement of Problems 2
1.3 Objectives 2
1.4 Scope of Project 2
1.5 Significance of Project 3
1.6 Summary 3
CHAPTER 2: LITERATURE REVIEW
2.1 Introduction 4
2.2 Fatigue Life 4-5
2.3 Fatigue Parameter 5
2.4 S-N Fatigue curve 6
2.5 Finite Element Analysis (FEA) 7
2.5.1Pre-Processing 7-8
2.5.2 Solution 8
2.5.4 Advantage of Finite Element Analysis 9-10
2.6 Principle Spot Welding
2.6.1 Resistance of Spot Welding 10
2.6.2 Heat Generation 11
2.6.3 Welding Cycle 11
2.7 Material Properties 12
2.7.1 Aluminum properties 12-14
2.7.2 Iron Properties 14-15
CHAPTER 3: METHODOLOGY
3.1 Introduction 16
3.2 Project Planning 17
3.3 Flow process 18
3.4 Problem Statement 19
3.5 Gathering Information 19
3.6 Generating Cad Model 20
3.6.1 Material Selection 21
3.7 Finite Element Analysis 22-23
3.8 Pre-processing 23
3.8.1 Applied Meshing 23-24
3.8.2 Fixed Geometry 24
3.8.3 Applied Force 25
3.8.4 Loading Event (Fatigue Simulation) 26
3.9 Solution 27
ix CHAPTER 4: RESULT AND DISCUSSION
4.1 Introduction 28
4.2 Result 28
4.3 Aluminum Alloy H14
4.3.1 100 N (Lateral Force) 29-30
4.3.2 300 N (Lateral Force) 31-32
4.3.3 500 N (Lateral Force) 33-34
4.3.4 100 N (Shear Force) 35-36
4.3.5 300 N (Shear Force) 36-37
4.3.6 500 N (Shear Force) 37-39
4.4 Grey Cast Iron
4.4.1 100 N (Lateral Force) 39-41
4.4.2 300 N (Lateral Force) 42-43
4.4.3 500 N (Lateral Force) 44-45
4.4.4 100 N (Shear Force) 46-47
4.4.5 300 N (Shear Force) 47-48
4.4.6 500 N (Shear Force) 48-49
4.5 Discussion 49
CHAPTER 5: CONCLUSION & FUTURE WORK
5.0 Introduction 50
5.1 Conclusion 50-51
5.2 Future work 51
LIST OF TABLE
Table 3.0 Gantt Charts Planning 17
Table 4.0 100 N (Lateral Force) Aluminum 30
Table 4.1 300 N (Lateral Force) Data 32
Table 4.2 500 N (Lateral Force) Data 34
Table 4.3 100 N (shear Force Table) 36
Table 4.4 300 N (Shear Force) 37
Table 4.5 500 N (Shear Force) 38
Table 4.6 100 N 41
Table 4.7 300 N lateral Force Grey Cast Iron 43
Table 4.8 500 N Grey Cast Iron 45
Table 4.9 100 N Shear Force 46
Table 4.10 300 N Shear Force data 48
xi
LIST OF FIGURES
Figure 2.0: S-N curve 6
Figure 2.1: The result of stress analysis on the coupling 9
Figure 2.2: Illustration Resistance Spot Welding 10
Figure 2.3: Welding Cycle 11
Figure 2.4: Mechanical properties for aluminum alloy 1050 H14 13
Figure 2.5: Physical properties for aluminum alloy 1050 13
Figure 2.6: Fabrication response for aluminum alloy 1050 13
Figure 2.7: Properties of Cast Iron Type (Grey Cast Iron) 14
Figure 3.0 Flow Chat Process for Fatigue Life Simulation 18
Figure 3.1 3D Model of Resistance Spot Weld Specimen 20
Figure 3.2 (a) Aluminum Properties (b) Grey Cast Iron properties 21
Figure 3.3 (a) Static Study (b) Fatigue Study 22
Figure 3.4 1 Mm Meshing For Specimen 24
Figure 3.5 Fixed position of specimen 24
Figure 3.6 (a) Lateral Force (b) Shear Force 25
Figure 3.7 Loading Event of Fatigue Studies 26
Figure 3.8 Applied Fatigue Data to the Material 26
Figure 4.1: SN- Curve 30
Figure 4.2 (a) Maximum Stress of 300 N Force
(b) Fatigue Life (Damage Plot) 31
Figure 4.3 S-N Curve 32
Figure 4.4: (a) Maximum Stress at 2603 MPa
(b) Fatigue Life at 100 Cycle 33
Figure 4.5 SN-Curve of 500 N 34
Figure 4.6 (a) Stress value of 100 N
(b) Strain value of 100 N 35
Figure 4.7 Stress of 300 N (Shear Force) 36
Figure 4.8 Maximum Area of Strain Plot 37
Figure 4.9 (a) Stress of 500 N Shear Force
(b) Strain of 500 N Shear Force 37-38
Figure 4.10: (a) Minimum value
(b) Maximum value of Von Mises Stress 38-39
Figure 4.11: (a) Stress Plot of 100 N Grey Cast Iron
(b) Strain Plot of 100 N Grey Cast Iron
(c) Fatigue Damage at 100 Percentages 39-40
xiii Figure 4.13: (a) Von Mises at 2211 MPa
(b) Fatigue life of 300 N Grey Cast Iron
(c) S-N Curve of 300 N Grey Cast Iron 42-43
Figure 4.14: Stress value of 500 N Grey Cast Iron 44
Figure 4.15: (a) Damage Area and Minimum Fatigue Life Value
(b) S-N curve for 500 N (Lateral Force) 45
Figure 4.16: (a) Stress Value (b) Displacement (c) Strain Value 46
Figure 4.17: Variable of Stress Force value 47
Figure 4.18: (a) 90 MPa stress of 300 N (b) Stress area of the specimen 47
CHAPTER 1
INTRODUCTION
1.1 Background of The Project
Fatigue life is the processes that are weakening the material when the load is
applied repeatedly. It is occurred relying upon the cyclic loading. Cyclic stresses may be
caused by fluctuating mechanical load. The crack of the material is known as fatigue
failure. Fatigue test method involves testing specimens under various states of stress,
usually in a combination of tension and bending. [Serope Kalpakjian et al. 2010]
In this project, the fatigue life will be determine through the Finite Element
Analysis (FEA) by applied the load and determine the cycle time until the material are
crack. The data will be collected from the simulation analysis and then, from the
observation, the current of the spot welding are determine depending on the selecting of
the material such as aluminum which has a much higher thermal conductivity and
electrical conductivity. The material properties will be inserting into Solidworks
software.
After that, the simulation of the software will be setting to the next stage which is
the load are inserted. The result will be determine in the contour plot of the simulation
that will be analyzes. From the result, the data will be collected and then, it will be
compared to the experimental process to determine whether it can be made some
2 1.2 Statement of Problem
There is a requirement to do the spot welding on the simulation by using the
galvanized iron and aluminum. The uses of the material are limited and also not
economical to do the experimental. From the experimental, the material has been testing
to predict what the cycles times and load that is caused the fatigue failure in spot
welding. The simulation on the software with help to analyzed the result similar to the
actual force and stress. By using Solidworks software, it can predict the fatigue life with
the accurate analysis in simulation on the material.
1.3 Objectives
The aim of the project is to predict and determine fatigue life for spot welded by
using Solidworks software.
The main objectives are:
∑ Determine fatigue life for spot welded in simulation environment
1.4 Scope of Project
The main purpose of this project was to determine fatigue life on spot welded
joint model on simulation and make a comparison to the experimental existing method.
There is requirement to analyze the materials which are:
∑ Type of material that are used is Galvanized iron and aluminum
∑ The thickness of the material is the limit to 0.5 mm-1.0 mm.
1.5 Significance of Project
The method that is using to predict the fatigue life by the simulation is way
faster, easier and accurate analysis for the material before it take to the actual worked.
The project will determine the fatigue life thus it helps in order to achieve the aim of the
project to verify the fatigue failure that occurred in the selecting material of the spot
welding.
1.6 Summary
Basically, this chapter describes how the project is going to be carried out.
Hence, it points out each objective and scopes that the project is going to targets and
focuses on. In addition to that, this chapter also shows the significance of the project,
4
CHAPTER 2
LITERATURE REVIEW
2.1 Introduction
This chapter will be review literature related to the finite element analysis,
fatigue failure of the material in spot welding, principle of spot welding and properties
of the iron and aluminum. Literature shows there are a lot of cause that occur the fatigue
life in the spot welding. By using the experimental method, it is waste of materials used.
The study will review before analysis method were using.
2.2 Fatigue Life
Basically, the testing on the spot weld material is included tensile-shear and cross
tension. Fatigue occurs in the spot weld based on the different loading condition and also
it intermediate-cycle fatigue life increased with increased base material strength. When
the cycle fatigue life at the higher, the performance of the fatigue was found to be
independent of strength.
In the spot welding, Fatigue performance was controlled by the primary variables
which are nugget size, sheet thickness, and the corresponding joint stiffness. When the
dynamic load is applied, the fatigue occurs when it is repeated cyclic stress from a
maximum to a minimum. The example of the fatigue is the fracture piece of wire that
had been bending in one direction and the other repeated for the number of cycle [R. W.
When the crack begins, it starts to propagate to the area that had form higher
stress concentration and it also proceed to propagates until the remaining stress area
becomes small and when it cannot support the load statically further, the sudden fracture
occurred.
The fatigue failure slowly spreading a crack with the load that applied to the
cycle of the stress, and it is known as the basic of the mechanism for the high-cycle
fatigue failure. In order for a crack to propagate, it only occurred when the stress of the
part in tension condition.
For the surface is hardened, it increases the fatigue strength. But in fact, it is
ambiguous statement which is the result for the material is depend on the material that
are chosen and type of heat treatment that applied on the material. In fatigue testing, a
specimen is subjected to periodically varying constant amplitude stress [Abass at al.
2013]
To prevent the fatigue or extending the life of the fatigue, the constant of
compressive surface stress need to be created in the outer layer of the specimen and it is
known as residual stress. It is also help to reduce or eliminate the tensile stresses that
occur during loading. In weld, it is consider as the stress that would exist in the body if
the external load were removed and sometimes it is called as internal stresses.
Apparently, it is caused by non-uniform temperature in welding.
2.3 Fatigue Life Parameter
Resistance spot welding is the most preferred method to join metal sheets. The
design variables for spot-weld joints affecting their strengths are basically sheet
thickness, spot weld nugget diameter, number of spot welds and the joint type as
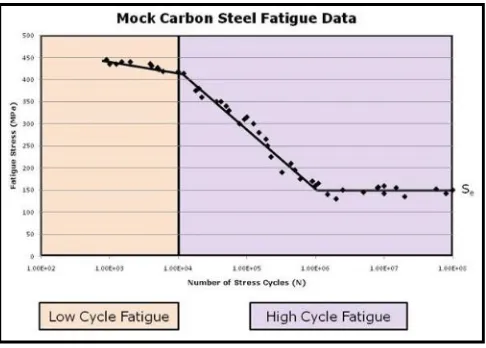
6 2.4 S-N Fatigue Curve
S-N curve is the graph between stress and number of cycle plotted for fatigue
loading. When the fatigue failure is consider, it means that the material is subjected to
alternate tensile and compressive stresses at the same time. The result of the fatigue
testing plotted on the graph is called as S-N curve. To develop the curve, a series of
samples is tested to failure at various stress ranges.
The resulting lives are plotted versus the corresponding stress range. The S-N
curve is the locus of these data points. In more thorough testing, multiple samples are
tested at each stress range. Common practice is to plot the S-N curve through the mean
[image:21.612.207.450.306.480.2]value at each stress range. [Robert Stone, 2008]
Figure 2.0: S-N curve
(Source: <http://www.solidworks.com>05/01/16)
The stress range and its associated mean stress are determined from the load
history shown in the graph. The load history is “filled with rain.” After the stress range
and mean have been determined, the “rain” is drained from the lowest point. The range
and mean for each remaining portion of trapped “rain” are then determined. From the
results, Miner’s rule can be applied, and the fatigue life can be calculated.
2.5 Finite Element Analysis (FEA)
Finite element analysis is the analysis based on the computerized method for
predicting how a product reacts to real-world forces, vibration, heat, fluid flow, and
other physical effects. Finite element analysis will determine whether a product will
break, wear out, or work the way it was designed. The finite element method is
comprised of three major phases:
1. Pre-processing
2. Solution
3. Post-processing
2.5.1 Pre-Processing
In Pre-processing, the subject geometry is divide into sub-domains which
is, it is builds up by finite element mesh for mathematical analysis, applies
material properties and boundary conditions. In pre-processing, the finite element
mesh subdivides the geometry into elements, which are found are nodes. The
nodes, which are really just point locations in space, are generally located at the
element corners and maybe near each mid side. For three-dimensional (3D) thin
shell analysis, it is basically a 2D element and may be slightly different in order
to comfort to the 3D surface. For the spot weld, nodes that are created will be
mesh to get the element size for the model.
Developing the mesh is usually the most time consuming task in FEA. In
the past, node locations were keyed in manually to approximate the geometry.
The more modern approach is to develop the mesh directly on the CAD
geometry, which will be (1) wireframe, with points and curves representing
edges, (2) surfaced, with surfaces defining boundaries, or (3) solid, defining
where the material is. Solid geometry is preferred, but often a surfacing package
8 As far as geometric detail, an underlying rule of FEA is to "model what is
there", and yet simplifying assumptions simply must be applied to avoid huge
models. Analyst experience is of the essence. The geometry is meshed with a
mapping algorithm or an automatic free meshing algorithm.
The first maps a rectangular grid onto a geometric region, which must
therefore have the correct number of sides. Mapped meshes can use the accurate
and cheap solid linear brick 3D element, but can be very time consuming, if not
impossible, to apply to complex geometries.
Free meshing automatically subdivides meshing regions into elements,
with the advantages of fast meshing, easy mesh size transitioning (for a denser
mesh in regions of large gradient), and adaptive capabilities. Disadvantages
include generation of huge models, generation of distorted elements, and, in 3D,
and the use of the rather expensive solid parabolic tetrahedral element.
It is always important to check elemental distortion prior to solution. A
badly distorted element will cause a matrix singularity, killing the solution. A
less distorted element may solve, but can deliver very poor answers. Acceptable
levels of distortion are dependent upon the solver being used.
[http://www.finiteelement.com/feawhite3.html]
2.5.2 Solution/Solver
Solution is the programs that are used to solve the matrix equation from
the model and solve the equation to the major quantities. The solvers that are
usually used in the solving method are by using the ACUSOLVE software in the
hypermesh which is, it can solve the equation for the numerical equation of
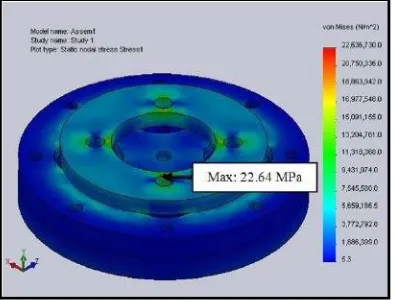
2.5.3 Post-Processing
The post-processing is in which the analyst check the legitimate solution
of the model and examines the values of major quantities such as displacements
and stresses, and derives and examines additional quantities such as specialized
[image:24.612.248.445.195.345.2]stresses and error indicators.
Figure 2.1: The result of stress analysis on the coupling (Rayothee al et. , 2015)
The FEA analysis can be performed to shown the stress-strain which
determined the critical area and safety level at various region in the component.
The element behavior is usually known under the support and load system. After
the model was designing by using Hyperwork software, the finite element
analysis is used. In order to study the stress-strain distribution, the model was
designed as actual size and can be use for further experiment. [Pitchaya Rayothee