The impact of investment in innovation on productivity:
firm-level evidence from Ireland
Mattia Di Ubaldo
a,band Iulia Siedschlag*
a,bAbstract: This paper examines the relationship between investment in innovation and productivity across firms in Ireland. We estimate a structural model using information from three linked micro data sets over the period 2005-2012 and identify the relationships between investment in innovation, innovation outputs and productivity. Our results indicate that innovation is positively linked to productivity. This result holds for all types of innovation and for both R&D and non-R&D expenditures. The innovation-related
productivity gains range from 16.2 per cent to 35.4 per cent. The strongest link between innovation and productivity is found for firms with R&D spending and with product innovation.
*Corresponding Author: iulia.siedschlag@esri.ie
Keywords: Investment in innovation; innovation outputs; productivity, firm heterogeneity. JEL Classification: F10; F23; O31.
Acknowledgements: This research is part of the joint Research Programme on “Enterprise Exporting, Innovation and Productivity” undertaken by the Economic and Social Research Institute, Enterprise Ireland and the Department of Jobs, Enterprise and Innovation. The views expressed in this research paper are those of the authors and may not necessarily coincide with the views of Enterprise Ireland and the Department of Jobs, Enterprise and Innovation. Results are based on analysis of strictly controlled Research Microdata Files provided by the Central Statistics Office (CSO). The CSO does not take any responsibility for the views expressed or the outputs generated from this research. We would like to thank Gerard Doolan, Andrew Murray, Ben Berstock and Alan Corcoran in the CSO for their support with data access and clearance. We also thank Marie Bourke, Elizabeth Harvey, Karen Hynes, Declan Hughes, and Garrett Murray, for useful discussions.
_____________
a The Economic and Social Research Institute, Dublin b Department of Economics, Trinity College, Dublin
ESRI working papers are not ESRI reports. They represent un-refereed work-in-progress by researchers who are solely responsible for the content and any views expressed therein. Any comments on these papers will be welcome and should be sent to the author(s) by email. Papers may be downloaded for personal use only.
Working Paper No.
57
1
2
1 Introduction
It is widely acknowledged that investment in innovation is a major driver of productivity growth.2
However, not all firms invest in innovation and not all investments in innovation are translated directly into productivity gains. Existing international evidence has found that investment in innovation results in various innovation outputs such as product, process, organisational and
marketing innovations which affect productivity via different channels.3
The objective of this analysis is to examine the relationship between investment in innovation and firm productivity in Ireland. To this purpose, we estimate a structural model which links investment in innovation to innovation outputs and productivity. More specifically, the following questions are addressed: (i) Which types of enterprises are more likely to invest in innovation and how much do they invest? (ii) Is spending on innovation translated into innovation outputs? (iii) Is firm productivity linked to innovation outputs?
We add to the literature on innovation and productivity at firm-level in three ways. Firstly, while most of existing evidence is based on cross-section data, we examine a panel data generated by linking information provided by Ireland’s Central Statistics Office (CSO) from four waves of the Community Innovation Survey (CIS 2006, 2008, 2010, and 2012), annual data from the Census of Industrial Production (CIP) and the Annual Services Inquiry (ASI) over the period 2006-2012. The panel data allows us to account for persistence in the relationships we examine and to correct for
endogeneity linked to reverse causality.4 Secondly, we improve on the previous studies by
estimating an augmented version of the widely used CDM model (Crépon, Duguet, Mairesse, 1998). The augmented version we estimate allows firms to implement jointly three types of innovation: product, process and organisational innovation. Thirdly, we link the three types of innovation inputs to three types of innovation expenditures: R&D expenditure only (expenditures for in-house R&D and expenditures for purchased R&D); non-R&D expenditures only (acquisitions of advanced machinery, equipment, software; acquisitions of other external knowledge such as purchased or licensed patented and non-patented inventions, know-how, and other types of knowledge from
2 Recent evidence is reviewed among others by Syverson (2011), and Ruane and Siedschlag (2013).
3 Recent international evidence has been reviewed by Hall (2011), and Siedschlag and Zhang (2015)among
others.
4 To the best of our knowledge, only a small number of country-specific studies have used panel data to
3
other enterprises and organisations for the development of new or significantly improved products and processes); and total innovation expenditures (combined R&D and non R&D expenditures).
Our results indicate that innovation is positively linked to labour productivity. This result holds for all types of innovation and all types of innovation expenditures (R&D and non-R&D expenditures). The productivity gains associated with the introduction of innovation outputs range from 16.2 per cent to 35.4 per cent. The strongest link between innovation and productivity is found for firms with R&D spending and with product innovation.
The remainder of this paper is organised as follows. Section 2 describes the data used for this analysis. Section 3 presents the empirical methodology. Next, Section 4, discusses the empirical results and Section 5 concludes and discusses policy implications drawn from the evidence provided in this paper.
2 Data and Descriptive Statistics
We use three linked micro data sets over the period 2005-2012 available from Irelands’ Central Statistics Office: Community Innovation Survey (CIS), Census of Industrial Production (CIP), and Annual Services Inquiry (ASI). The data matching has been done using the common firm identifier provided by the CSO.
The information on innovation expenditures collected with the CIS include R&D expenditures
(in-house R&D5 and purchased external R&D) as well as non-R&D expenditures (acquisitions of
advanced machinery, equipment, software; acquisitions of other external knowledge such as purchased or licensed patented and non-patented inventions, know-how, and other types of knowledge from other enterprises and organisations for the development of new or significantly improved products and processes).
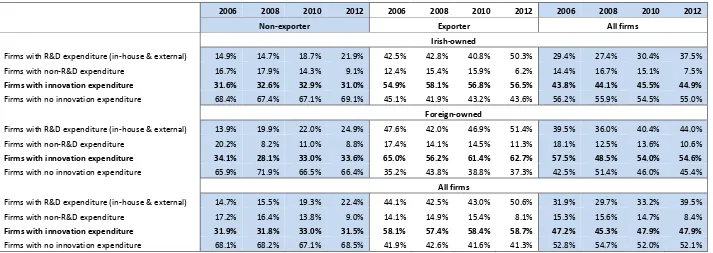
Figures 1 and 2 describe patterns and trends of firms’ R&D and non-R&D expenditures over the period 2006-2012 broken down by ownership, export participation and size class. This analysis is based on weighted data from the CIS 2006, 2008, 2010, and 2012. The firm-level weights are computed using grossing factors for the number of firms provided by the CSO. Tables A1 and A2 in the Appendix report detailed descriptive statistics broken down for the categories of firms considered.
Looking first at Figure 1, a common pattern across all firms as well as Irish and foreign-owned firms is the higher share of firms with R&D expenditure for firms engaged in exporting in comparison to
5 Capital expenditures on buildings and equipment specifically for R&D and current expenditures for creative
4
firms serving only the Irish market. It is also noteworthy that the proportion of firms with R&D expenditure has increased over the analysed period, 2006-2012 across all three categories of firms. The share of firms with R&D expenditure in the case of exporters ranges from 44 to 51 per cent, among all firms; from 43 to 50 percent among Irish-owned firms, and from 48 to 51 per cent in the case of foreign-owned firms. In the case of firms serving only the Irish market, the share of firms with R&D expenditure ranges from 15 to 22 per cent for Irish-owned firms and from 14 to 25 per cent in the case of foreign-owned firms. In contrast, the shares of firms with non-R&D expenditures do not differ too much across exporters and non-exporters. They also seem to be similar across Irish and foreign-owned firms. In addition, it seems that the increase over time of the share of firms with R&D expenditure, in particular at the end of the period has been accompanied by a decline of the share of firms with non-R&D expenditure. Taking together R&D and non R&D expenditures, at the end of the period (in 2012) the share of firms with expenditure on innovation was 56 percent among Irish exporters (higher by 3 percentage points than in 2006), and 63 per cent among foreign-owned exporters (lower by 2 percentage points compared to 2006).
Figure 2 shows that the share of firms with R&D expenditure is increasing with firm size. This pattern is in general consistent across all firms as well as and foreign-owned firms. In 2012, for Irish-owned large firms the share of firms with R&D expenditure is lower than in the middle-sized group. This pattern is due to an increase by 12 percentage points of the share of medium-sized firms with R&D expenditure in 2012 compared with 2006 which has been mirrored by a decrease by 11 percentage points of the share of large firms with R&D expenditure. In the case of foreign-owned firms, large firms are clearly ahead of the small and medium-sized firms with respect to the proportion of firms with R&D expenditure. In 2012, 70 percent of large firms had R&D expenditures compared to 45 per cent and 30 percent in the case of medium-sized and small foreign-owned firms, respectively.
5
Figure 1: The share of firms with R&D and with non-R&D expenditures in total firms, by ownership and export participation
Source: Authors’ calculations based on linked micro-data from the CIS, CIP and ASI data sets. The data is weighted using firm-level weights based on grossing factors for the number of firms provided by the CSO.
0% 10% 20% 30% 40% 50% 60% 70% 80% 90% 100% 20 06 20 08 20 10 20 12 20 06 20 08 20 10 20 12 20 06 20 08 20 10 20 12 20 06 20 08 20 10 20 12 20 06 20 08 20 10 20 12 20 06 20 08 20 10 20 12 20 06 20 08 20 10 20 12 20 06 20 08 20 10 20 12 20 06 20 08 20 10 20 12
Non exporter Exporter Total Non exporter Exporter Total Non exporter Exporter Total
Irish Foreign Total
6
Figure 2: The share of firms with R&D and with non-R&D expenditures in total firms, by ownership and size class
Source: Authors’ calculations based on linked micro-data from the CIS, CIP and ASI data sets. The data is weighted using firm-level weights based on grossing factors for the
number of firms provided by the CSO. 0% 10% 20% 30% 40% 50% 60% 70% 80% 90% 100% 20 06 20 08 20 10 20 12 20 06 20 08 20 10 20 12 20 06 20 08 20 10 20 12 20 06 20 08 20 10 20 12 20 06 20 08 20 10 20 12 20 06 20 08 20 10 20 12 20 06 20 08 20 10 20 12 20 06 20 08 20 10 20 12 20 06 20 08 20 10 20 12 20 06 20 08 20 10 20 12 20 06 20 08 20 10 20 12 20 06 20 08 20 10 20 12
Small Medium Large Total Small Medium Large Total Small Medium Large Total
Irish Foreign Total
7
Figure 3: The productivity distribution of firms with innovation and with no innovation expenditure
Source: Authors’ estimates based on linked micro-data from the CIS, CIP and ASI data sets.
3 Empirical Methodology
Our empirical analysis uses an econometric structural model which links investment in innovation, innovation outputs and productivity. The estimated model is an augmented version of the model
developed by Crépon, Duguet and Mairesse (1998) known as the CDM model.6
The CDM model estimates three sets of relationships. The first set consists of two equations relating to the investment phase, namely the propensity of enterprises to invest in innovation and the innovation expenditure intensity conditional on spending on innovation. The second set relates the various types of innovation outcomes to innovation expenditure intensity (innovation expenditure per employee) and other enterprise and industry characteristics. The third set links output/productivity to innovation outcomes and other enterprise characteristics.
6 Previous analyses of the links between innovation and productivity based on modified versions of the CDM
8
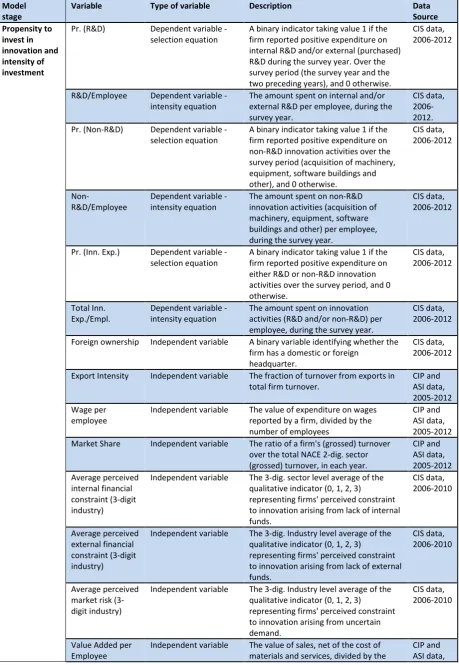
The original CDM model was estimated for innovative firms only. To account for the fact that the group of innovators might not be random, we extend a modified version of the CDM model proposed by Griffith et al. (2006) that controls for this selection bias. The econometric model is described below. Detailed definitions of the variables used in the analysis are given in Table B1.
The Innovation Investment Equations
This stage of the model comprises two equations which explain the firms’ decision to invest/not invest in innovation and, if investing, the amount of innovation expenditure per employee. We only observe the innovation expenditure reported by firms. However, this group of firms may not be random implying a selection bias. To account for this potential bias, the propensity of firms to invest in innovation is estimated on the basis of the following selection equation:
≤
+
+
+
=
>
+
+
+
=
=
τ
ε
µ
λ
γ
τ
ε
µ
λ
γ
it t j ijt ijt ijt t j ijt ijt ijtX
y
if
X
y
if
y
* *0
1
(1) ijty
is an observed binary variable which equals one if firm i in industry j is engaged in innovationinvestment at time t and zero otherwise. Firms engage in innovation and/or report innovation
expenditure if the unobserved latent variable *
ijt
y
corresponding to investment in innovation isabove a certain threshold level
τ
.X
ijt is a vector of firm-level variables explaining the innovationdecision,
γ
is the vector of parameters,λ
j is an industry-specific effect,µ
tis a time-specific effectand
ε
ijtis the error term.Conditional on investing in innovation, the amount of innovation expenditure per employee (
w
ijt) isgiven by the following equation:
=
=
+
+
+
=
=
0
0
1
,
* ijt ijt ijt t j ijt ijt ijty
if
y
if
Z
w
w
β
λ
µ
w
(2)
*
ijt
w
is the unobserved latent variable reflecting the intensity of investment in innovation,Z
ijtis avector of firm characteristics and
w
ijt is an error term.Following Griffith et al. (2006), under the assumption that the error terms in equations (1) and (2)
follow a bivariate normal distribution with mean zero (variances
σ
ε2=
1
andσ
w2), equations (1) and9
The Innovation Output Equations
This second stage of the model explains the innovation outcomes given by the following knowledge production function: ijt t j ijt ijt
ijt
w
H
g
=
α
+
δ
+
λ
+
µ
+
ν
(3)where
g
ijt is innovation output proxied by product, process, and organisational innovationindicators.
w
ijt is the predicted innovation expenditure per employee estimated from the modeldescribed by Equations (1) and (2). These values are predicted for all firms and not just the sample reporting innovation expenditure. By using the predicted values of this variable to instrument the
innovation effort (
w
ijt), we account for the possibility that innovation expenditure per employeeand the innovation outputs could be simultaneously determined. The selection and innovation
expenditure intensity equations (1) and (2) thus correct for this endogeneity.
H
ijtis a vector of otherdeterminants of innovation output,
α
andδ
are the parameter vectors,λ
jis an industry-specificeffect,
µ
t is a time-specific effect, andν
ijtis the error term.Following on from a literature strand on the complementarity of different types of innovations
initiated by Milgrom and Roberts (1990, 1995), 7 we model the probability that firms introduce
product, process and organisational innovations jointly. To this purpose, we estimate a tri-variate probit model which allows the error terms in the three innovation output equations to be correlated. The system of three simultaneous equations to be estimated is as follows:
+
+
+
+
+
+
+
+
+
+
+
+
=
ijt t j ijt ijt ijt t j it ijt ijt t j ijt ijt onal Organisati ijt ocess ijt oduct ijtH
w
H
w
H
w
g
g
g
3 3 3 3 2 2 2 2 1 1 1 1 Pr Prν
µ
λ
δ
ν
µ
λ
δ
ν
µ
λ
δ
j
(4)The Output Production Equation
The last stage of the model explains the output production as a function of labour, capital, and innovation outcomes as follows:
ijt t j ijt ijt
ijt
k
g
p
=
ζ
+
ϑ
+
λ
+
µ
+
υ
(5)
7 Mairesse and Robin (2008) use a bivariate probit model to model the joint introduction of product and
10
ijt
p
is labour productivity (log of output per employee),k
itis the log of physical capital per workerand
g
ijt denotes the predicted innovation probabilities (for product, process, organisationalinnovation),
ζ
andϑ
are vectors of parameters,λ
jis an industry-specific effect,µ
tis atime-specific effect, and
υ
ijtis the error term. Using the predicted innovation probabilities on the basis ofthe system of simultaneous equations (4) corrects for the fact that productivity and innovation output could be simultaneously determined.
4 Empirical Results
Columns 1, 3, and 5 in Table 1 show the estimates of determinants of the propensity of firms to invest in innovation based on the model (1) described above. The model is estimated separately for R&D spending, spending on non-R&D assets and total innovation expenditure (spending on R&D and
non-R&D assets). On the basis of recent studies using the CDM model,8 the explanatory variables of
the likelihood to invest in innovation (selection equation) include foreign ownership export intensity, wage per employee (a proxy for human capital), market share (a proxy for competition), perceived
internal and external financing constraints9, age and age squared, total number of employees (a
proxy for firm size) and engagement in co-operation for innovation activities.
The results in Column 1 indicate that firms which are more likely to invest in R&D are those which are larger, Irish-owned, with large export intensity (measured as export sales per employee), and firms engaged in co-operation for innovation activities. The propensity of firms to invest in R&D is higher in industries with better access to external financing and in industries in which innovation is perceived to be constrained by the lack of internal financing. This latter result could be linked to the fact that firms investing in R&D are more likely to perceive the lack of internal financing as a
constraint to innovation relative to firms with no R&D investment.10 Furthermore, this result might
be explained by the fact that small firms which are likely to be more financially constrained than
larger firms11 are underrepresented in the CIS data.12 This implies that the result of a positive link
8 Recent studies using the CDM model have been reviewed by Hall (2011), Ruane and Siedschlag (2013) and
Siedschlag and Zhang (2015).
9 We follow Hall and Sena (2017) and construct measures of perceived internal and external financing
constraints at industry level (at the 3 digit NACE Rev. 2 classification).
10 Similar results have been found in other analyses of the effect of financing constraints on investment in
innovation and innovation performance using data from the Community Innovation Surveys (CIS). See for example Mohnen and Röller (2005) using data from Ireland, Denmark, Germany and Italy, Mohnen et al. (2008) for the Netherlands, Savignac (2008) for France, Silva and Carreira (2012) for Portugal, and Hall and Sena (2017) for the UK.
11
between financing constraints and investment in innovation is likely to be driven by the larger firms, without being necessary representative for all firms, for small firms in particular.
As shown in Column 3, firms’ propensity to invest in non-R&D assets is higher for Irish-owned firms relative to foreign-owned firms, firms engaged in co-operation for innovation activities, and it is increasing in firms’ size and export intensity. Taking together R&D and non-R&D investments, the results in Column 5 indicate that the propensity of firms to invest in innovation is higher for Irish-owned firms, larger firms, firms with a higher export intensity, firms with a higher human capital/skills intensity. Firms in industries with better access to external financing and in industries in which innovation is perceived to be constrained by the lack of internal financing are more likely to invest in both R&D and non-R&D assets.
Following previous studies, we model the intensity of innovation expenditure as a function of the same variables included in the selection equation excluding for identification purposes: firm size, age, age squared, and engagement in co-operation for innovation activities. We add labour productivity lagged by one year to account for firms’ innovation capability.
Columns 2, 4, and 6 in Table 1 above show the estimates on determinants of firms’ intensity of investment in innovation separately for R&D spending, non-R&D spending, and innovation expenditures including spending on both R&D and non R&D inputs. The model specification is described by model (2) above.
12
Table 1: Determinants of firms’ propensity to invest in innovation
(1) (2) (3) (4) (5) (6)
R&D expenditure Non-R&D expenditure Total innovation exp.
Dependent variables Pr.(R&D) Ln(R&D/Emp.)
Pr.(Non-R&D) Ln(Non- R&D/Emp.) Pr.(Inn. Exp.) Ln(Total Inn. Exp./Empl)
Equation Selection Intensity Selection Intensity Selection Intensity
Foreign ownership -0.360*** 0.008 -0.167*** 0.006 -0.285*** 0.022'
(0.097) (0.010) (0.062) (0.010) (0.084) (0.014)
Ln(Export Intensity)t-1 1.048*** 0.073*** 0.358*** 0.005 0.766*** 0.049'
(0.149) (0.019) (0.109) (0.018) (0.145) (0.031)
Ln(Wage/Employee)t-1 0.408 0.234*** -0.177 0.062 0.649** 0.290***
(0.351) (0.063) (0.255) (0.048) (0.323) (0.093)
Market Sharet-1 -0.152 -0.165** 0.066 0.056 -0.129 0.028
(0.549) (0.064) (0.371) (0.062) (0.541) (0.114)
Average perceived internal
fin. constraints (3-digit ind.) 0.888*** (0.197) 0.025 (0.018) 0.147 (0.141) 0.012 (0.028) 0.638*** (0.195) 0.065** (0.026)
Average perceived external
fin. constraints (3-digit ind.) -0.562*** (0.198) -0.007 (0.020) -0.111 (0.141) -0.029 (0.028) -0.446** (0.196) -0.042 (0.035)
Average perceived market
risk (3-digit ind.) 0.140 (0.167) 0.009 (0.016) 0.123 (0.103) -0.017 (0.021) 0.244' (0.149) -0.045* (0.026)
Ln(Value Added/Emp. t-1) 0.029* 0.028*** 0.024'
(0.016) (0.007) (0.015)
Ln(Age) 4.201' 0.518 3.005
(2.647) (1.979) (2.383)
Ln(Age squared) -1.901' -0.295 -1.388
(1.179) (0.882) (1.061)
Ln(Employees) 0.244*** 0.131*** 0.181***
(0.040) (0.029) (0.040)
Cooperation for innovation 1.143*** 0.775*** 1.238***
(0.078) (0.060) (0.083)
Constant -4.753*** -0.104' -1.274* -0.012 -3.527*** -0.130
(1.009) (0.065) (0.749) (0.115) (0.906) (0.115)
Industry group dummiesa Yes No Yes No Yes No
NACE 2-digit FE No Yes No Yes No Yes
Year FE Yes Yes Yes Yes Yes Yes
N 2914 2914 2917 2917 2911 2911
Source: Authors’ estimates based on data from the linked CIS, CIP and ASI data sets, 2005-2012.
Notes: Robust standard errors clustered at the firm level in parentheses; ' p <0.15, * p <0.10, ** p <0.05, ***p
< 0.01. Value Added was calculated as the difference between turnover and the cost of material and services. Results in columns 1, 2, 5 and 6 were obtained with the maximum likelihood Heckman estimator; results in column 3 and 4 were obtained with the two-step Heckman estimator, because of the lack of convergence of the maximum likelihood estimator. a representing industry groups by technology intensity in manufacturing
and services sectors, according to the Eurostat classification,
http://europa.eu/eurostat/cache/metadata/Annexes/htec_esms_an3.pdf.
13
employee, perceived external financial constraints, perceived market risk13, foreign ownership, age
and age squared, firm size, and engagement in co-operation for innovation activity.
The results indicate that firms with a higher R&D expenditure per employee are more likely to introduce product and process innovations. Firms with a higher intensity of non-R&D expenditures are more likely to introduce process innovations. When total innovation expenditure per employee is considered, we find a positive but statistically not significant relationship with the likelihood of innovation outputs. Taken together these results suggest that the relationship between the likelihood of innovation outputs and innovation expenditure intensity is stronger in the case of product and process innovation and weaker in the case of organisational innovation.
Larger firms, firms engaged in co-operation for innovation, and firms in industries with a higher perceived market risk are more likely to introduce innovation outputs. These effects are large and statistically significant across the three types of innovation expenditures considered for all types of innovations. The importance of other factors considered vary across the three types of innovations and innovation expenditures. Export intensity is positively linked to the likelihood to introduce product innovations. The relationship appears to be stronger in the case of firms with non-R&D expenditures only and when total innovation expenditures are considered. Firms with a higher import intensity are more likely to introduce organisational innovations. These results hold across all three types of innovation expenditures (R&D only, non-R&D only, and total innovation expenditures). Finally, firms with a higher intensity of investment in tangible capital are more likely to introduce process innovations.
13 Tiwari et al. (2007) suggest that perceived financing constraints interact with perceived market risk in
14
Table 2: The impact of spending on R&D and non-R&D inputs on innovation outputs
(1) (2) (3) (4) (5) (6) (7) (8) (9)
R&D expenditure Non-R&D expenditure Total innovation expenditure
Dependent variables Product
Innovation Process Innovation Organizational Innovation Product Innovation Innovation Process Organizational Innovation Product Innovation Process Innovation Organizational Innovation R&D/employee (predicted) 2.655*** 1.452** 0.675
(0.718) (0.730) (0.677)
Non-R&D/employee (predicted) 0.153 1.760** 0.474
(0.559) (0.803) (0.452)
Inn. Exp./employee (predicted) 0.649 0.556 0.482
(0.727) (0.597) (0.587) Ln(Export Intensity)t-1 0.222 -0.193 0.139 0.447*** -0.087 0.192 0.407*** -0.096 0.169
(0.161) (0.162) (0.158) (0.150) (0.152) (0.151) (0.158) (0.155) (0.154) Ln(Import Intensity)t-1 -0.072 -0.178 0.682*** 0.054 -0.125 0.710*** 0.004 -0.182 0.673***
(0.274) (0.246) (0.250) (0.270) (0.245) (0.249) (0.263) (0.250) (0.253)
Ln(Tangibles/employee) 0.028 0.526** 0.018 0.173 0.507** 0.032 0.136 0.556*** 0.016
(0.206) (0.212) (0.241) (0.200) (0.210) (0.238) (0.203) (0.212) (0.241) (0.139) (0.121) (0.114) (0.141) (0.120) (0.114) Perceived external financial
constraints -0.048 (0.126) -0.052 (0.109) 0.110 (0.107) -0.051 (0.123) -0.057 (0.109) 0.109 (0.106) -0.049 (0.124) -0.044 (0.108) 0.118 (0.106)
Perceived market risk 0.541*** 0.360*** 0.343*** 0.535*** 0.365*** 0.344*** 0.531*** 0.365*** 0.349*** (0.102) (0.088) (0.091) (0.100) (0.088) (0.091) (0.101) (0.088) (0.091)
Foreign ownership -0.015 -0.059 -0.007 0.048 -0.058 0.001 0.029 -0.038 0.012
(0.090) (0.089) (0.080) (0.087) (0.089) (0.079) (0.091) (0.090) (0.083)
Ln(Age) 0.554 0.876 1.952 0.417 0.799 1.929 0.173 0.628 1.856
(2.588) (2.389) (2.408) (2.575) (2.399) (2.407) (2.581) (2.391) (2.434)
Ln(Age squared) -0.298 -0.438 -0.916 -0.233 -0.403 -0.906 -0.125 -0.323 -0.866
(1.151) (1.062) (1.072) (1.145) (1.067) (1.072) (1.148) (1.063) (1.084) Ln(Employees) 0.227*** 0.197*** 0.244*** 0.223*** 0.193*** 0.243*** 0.222*** 0.194*** 0.237***
(0.039) (0.042) (0.038) (0.039) (0.042) (0.038) (0.039) (0.042) (0.039) Cooperation 1.109*** 1.023*** 0.924*** 1.120*** 1.024*** 0.926*** 1.113*** 1.023*** 0.915***
(0.085) (0.085) (0.087) (0.085) (0.086) (0.086) (0.085) (0.086) (0.088)
Corr. (Product, Process) 0.384*** 0.389*** 0.365***
(0.048) (0.048) (0.046)
Corr. (Product, Organizational) 0.242*** 0.244*** 0.205***
(0.045) (0.045) (0.045)
Corr. (Process, Organizational) 0.491*** 0.491*** 0.486***
(0.045) (0.045) (0.044)
Constant -2.687*** -1.766** -2.264** -2.604*** -1.780** -2.270** -2.578*** -1.738* -2.304** (0.983) (0.887) (0.920) (0.983) (0.890) (0.919) (0.990) (0.890) (0.928)
Sector technology dummiesa Yes Yes Yes Yes Yes Yes Yes Yes Yes
Time dummies Yes Yes Yes Yes Yes Yes Yes Yes Yes
N observations 2390 2390 2390 2390 2390 2390 2390 2390 2390
Source: Authors’ estimates based on data from the linked CIS, CIP and ASI data sets, 2005-2012. Notes: Robust standard errors clustered at the firm level in parentheses; ' p <0.15, * p <0.10, ** p <0.05, ***p < 0.01. The method of estimation is simulated maximum likelihood (with 10 draws) on a trivariate probit model.a: Industry groups defined on the basis of technology intensity in manufacturing and services sectors,
15
Table 3 shows the estimated relationships between innovation outputs and productivity. The model specification is described by Equation (5). The dependent variable in the productivity models is the one-year forward value added per employee in logs. The explanatory variables include the predicted probabilities to introduce innovations (product, process and organisational innovations), investment in tangible assets per employee, age and age squared, and a set of categorical variables for firms’ engagement in international trade (the reference category is indigenous firms serving only the Irish market).
Taken together, the results indicate that innovation outputs are positively linked to labour productivity. This result holds for all types of innovation outputs and all types of investment in innovation (spending on R&D and on non-R&D assets). The productivity gains associated with innovation over the analysed period, 2006-2012 range from 16.2 per cent to 35.4 per cent. The strongest link between innovation and productivity is found for firms with R&D spending and with product innovation. Relative to firms with no innovation outputs, labour productivity in firms with product innovations is on average higher by 35.4 per cent. In the case of firms with non-R&D expenditure, relative to non-innovators, labour productivity in firms with process innovation is higher on average by 27.1 per cent while organisational innovation increases productivity by 21.3 per cent. In the case of firms with both R&D and non-R&D expenditure, the labour productivity elasticity is highest for organisational innovation, 21.9 per cent.
A number of additional results are worth discussing. Productivity is positively linked to the intensity of investment in tangible fixed assets across all models. Irish-owned firms with importing activity are more productive than firms serving only the Irish-market. This result is also obtained for all types of innovations and all types of innovation expenditures considered. With the exception of firms with R&D expenditure only and product innovation, Irish-owned firms with both importing and exporting activity are more productive than Irish-owned firms with no international activity. Regardless of their engagement in international trade, foreign-owned firms are more productive than Irish-owned firms across all types of estimated models.
16
Table 3: The impact of innovation on productivity(1) (2) (3) (4) (5) (6) (7) (8) (9)
Dependent variable
Value added per employee in t+1
R&D expenditure Non-R&D expenditure Total innovation expenditure
Product Innovation
(predicted probability) 0.354*** (0.073) 0.162** (0.075) 0.202*** (0.075)
Process Innovation
(predicted probability) 0.277*** (0.080) 0.271*** (0.080) 0.190** (0.081)
Organisational Innovation
(predicted probability)
0.243***
(0.081) 0.213*** (0.082) 0.219*** (0.082)
Ln(Tangibles/employee) 1.171*** 1.140*** 1.190*** 1.194*** 1.144*** 1.193*** 1.189*** 1.164*** 1.193***
(0.220) (0.222) (0.223) (0.224) (0.223) (0.224) (0.224) (0.224) (0.224)
Ln(Age) -0.052 -0.034 -0.079 0.102 -0.026 -0.040 0.086 0.063 -0.041
(1.101) (1.103) (1.097) (1.104) (1.103) (1.098) (1.104) (1.103) (1.098)
Ln(Age squared) 0.050 0.042 0.061 -0.020 0.038 0.044 -0.012 -0.002 0.044
(0.491) (0.492) (0.489) (0.492) (0.492) (0.490) (0.492) (0.492) (0.490)
Irish Importer 0.095* 0.099* 0.096* 0.102* 0.099* 0.097* 0.101* 0.102* 0.097*
(0.052) (0.052) (0.052) (0.052) (0.052) (0.052) (0.052) (0.052) (0.052)
Irish Exporter 0.113 0.137' 0.134' 0.139' 0.138' 0.138' 0.134' 0.145* 0.137'
(0.083) (0.084) (0.084) (0.085) (0.084) (0.084) (0.084) (0.085) (0.084)
Irish Importer-Exporter 0.073' 0.093** 0.086* 0.098** 0.093** 0.090** 0.093** 0.101** 0.089*
(0.046) (0.045) (0.046) (0.046) (0.045) (0.046) (0.046) (0.045) (0.046)
Foreign non trader 0.539*** 0.557*** 0.560*** 0.562*** 0.558*** 0.562*** 0.557*** 0.564*** 0.561***
(0.135) (0.136) (0.136) (0.136) (0.136) (0.136) (0.136) (0.136) (0.136)
Foreign Importer 0.396*** 0.420*** 0.408*** 0.422*** 0.421*** 0.413*** 0.417*** 0.428*** 0.411***
(0.127) (0.128) (0.129) (0.130) (0.128) (0.129) (0.129) (0.129) (0.129)
Foreign Exporter 0.365*** 0.406*** 0.399*** 0.403*** 0.407*** 0.404*** 0.395*** 0.415*** 0.402***
(0.136) (0.136) (0.137) (0.137) (0.136) (0.137) (0.137) (0.136) (0.137)
Foreign
Importer-Exporter 0.375*** 0.416*** 0.401*** 0.412*** 0.416*** 0.407*** 0.404*** 0.425*** 0.404***
(0.068) (0.067) (0.069) (0.070) (0.067) (0.070) (0.070) (0.067) (0.070)
Year dummies Yes Yes Yes Yes Yes Yes Yes Yes Yes
NACE 2-dig. sector FE Yes Yes Yes Yes Yes Yes Yes Yes Yes
N 2172 2172 2172 2172 2172 2172 2172 2172 2172
Source: Authors’ estimates based on data from the linked CIS, CIP and ASI data sets, 2005-2012.
17
5 Conclusions and Policy ImplicationsThis paper examines the links between investment in innovation, innovation outputs and productivity across firms in Ireland. The empirical analysis is based on estimates obtained with a structural model using a panel of annual data over the period 2005-2012. The key findings are summarised below.
Firms which are more likely to invest in R&D are those which are larger, Irish-owned, with large export intensity (measured as export sales per employee), and firms engaged in co-operation for innovation activities. Furthermore, the propensity of firms to invest in R&D is higher in industries with better access to external financing. We also find that firms in industries in which internal financing for innovation is perceived as constrained are more likely to invest in R&D. This result and similar findings for the propensity of firms to invest in both R&D and non-R&D assets, as well as for the intensity of innovation expenditures reported below could be explained by the fact that firms engaged in innovation are more likely to be aware of financing constraints. Similar results indicating a positive link between perceived financing constraints and investment in innovation using data from the Community Innovation Surveys have been reported in other country studies (see for example, Savignac 2008 for France; Silva and Carreira 2012 for Portugal; Hall and Sena 2017 for the UK) as well as cross-country analysis (Mohnen and Röller 2005, using data from Ireland, Denmark, Germany and Italy). Further research using richer information on firms’ financing conditions could shed more light on the extent to which investment in innovation is conditioned by access to finance.
Further, our results indicate that firms’ propensity to invest in non-R&D assets is higher for Irish-owned firms relative to foreign-Irish-owned firms, firms engaged in co-operation for innovation activities, and it is increasing in firms’ size and export intensity.
Taking together R&D and non-R&D investments, the propensity of firms to invest in innovation is higher for Irish-owned firms, larger firms, firms with a higher export intensity, firms with a higher human capital/skills intensity, firms in industries with better access to external financing and in industries in which internal financing for innovation is constrained.
18
The research results indicate a strong positive link between the intensity of R&D expenditures and the likelihood to introduce product innovations and process innovations while the intensity of non-R&D expenditures is positively linked to the probability to introduce process innovations.
The likelihood of innovation outputs vary across firms and across industries. Larger firms, firms engaged in co-operation for innovation, and firms in industries with a higher perceived market risk are more likely to introduce innovation outputs. These effects are large and statistically significant across the three types of innovation expenditures considered and for all types of innovations. The importance of other factors considered vary across the three types of innovations and innovation expenditures. The likelihood to introduce product innovations is positively linked to export intensity. The relationship appears to be stronger in the case of firms with non-R&D expenditures only and when total innovation expenditures are considered. Firms with a higher import intensity are more likely to introduce organisational innovations. This result holds across all three types of innovation expenditures (R&D only, non-R&D only, and total innovation expenditures). Finally, firms with a higher intensity of investment in tangible capital are more likely to introduce process innovations.
The results of this analysis indicate that innovation is positively linked to labour productivity across all types of innovation and all types of innovation expenditures (R&D and non-R&D). The productivity gains associated with introducing innovation outputs over the analysed period, 2006-2012 range from 16.2 per cent to 35.4 per cent. The strongest link between innovation and productivity is found for firms with R&D spending and with product innovation. For these firms, introducing product innovations is linked to an increased labour productivity by 35.4 per cent.
Productivity is positively linked to the intensity of investment in tangible fixed assets across all models. Irish-owned firms with importing activity are more productive than firms serving only the Irish-market. With the exception of firms with R&D expenditure only and with product innovation, Irish-owned firms with both importing and exporting activity are more productive than Irish-owned firms with no international activities. Regardless of their engagement in international trade, foreign-owned firms are more productive than Irish-foreign-owned firms across all types of estimated models.
19
Further research on how access to finance and other factors impact on firms’ decisions to invest in innovation could provide useful evidence. In this context, it would be also useful to assess the impact of direct and indirect enterprise supports such as R&D grants and R&D tax credits on firms’ investment in R&D and their innovation, productivity and export performance. Another research avenue worth pursuing is an examination of the complementarity or substitutability of investment in R&D and in non-R&D assets and how these affect firm outcomes.
20
References
Bartelsman, E., G. van Leewan, and M. Polder (2017). “CDM using a Cross-Country Micro-Moments Data Base”, Economics of Innovation and New Technology, 26(1-1): 168-182.
Crépon, B., E. Duguet, and J. Mairesse (1998) “Research, Innovation, and Productivity: An Econometric Analysis at the Firm Level”, Economics of Innovation and New Technology 7: 115-156.
Griffith, R., E. Huergo, J. Mairesse, B. Peters (2006). “Innovation and Productivity across Four Euroepan Countries”, Oxford Review of Economic Policy, 22(4): 483-498.
Hall, B. H., and J. Lerner (2010). “The Financing of R&D and Innovation”, in B. H. Hall and N. Rosenberg, Economics of Innovation, vol. 1, 610-639, Elsevier, Amsterdam.
Hall, B. H. (2011). “Innovation and Productivity”, Nordic Economic Policy Review 2: 167-204.
Hall, B. H., F. Lotti, and J. Mairesse (2013). “Evidence on the Impact of R&D and ICT Investments on Innovation and Productivity in Italian Firms.” Economics of Innovation and New Technology 22 (3): 300–328.
Hall, B. H. and V. Sena (2017). “Appropriability Mechanisms, Innovation, and Productivity: Evidence from the UK”, Economics of Innovation and New Technology, 26(1-2): 42-62.
Huergo, E., L. Moreno (2011). ”Does history matter for the relationship between R&D, innovation and productivity?”, Industrial and Corporate Change, 20: 1335–1368.
Milgrom, P., and J. Roberts (1990). “The Economics of Modern Manufacturing: Technology, Strategy, and Organization.” American Economic Review, 80 (3): 511–528.
Milgrom, P., and J. Roberts. 1995. “Complementarities and Fit Strategy, Structure, and
Organizational Change in Manufacturing.” Journal of Accounting and Economics 19 (2–3):
179–208.
Mohnen, P., and L. Röller (2005. “Complementarities in Innovation policy”, European Economic Review, 49(6): 1431-1450.
Mohnen, P., F. C. Palm, S. Schim van der Loeff, A. Tiwari (2008). “Financial Constraints and Other Obstacles: Are They a Threat to Innovation Activity?”, De Economist, 156(2): 201-2014. Ruane, F. P., I. Siedschlag (2013). “Boosting Innovation and Productivity in Enterprises: What
Matters? What Works?”, in Pete Lunn and Frances Ruane, Using Evidence to Inform Policy, Dublin: Gill & MacMillan, pp. 96-117.
Peters, B., R. Riley, I. Siedschlag, P. Vahter, J. McQuinn (2014). “Innovation and Productivity in Services: Firm-level Evidence from Germany, Ireland and the United Kingdom”, ESRI Working Paper No. 480.
Parisi, M.L., F. Schiantarelli, A. Sembenelli (2006). “Productivity, Innovation and R&D: Microevidence for Italy”, European Economic Review, 50: 2037–2061.
Polder, M. G. van Leeuwen, P. Mohnen, and W. (2010). “Product, Process and Organizational Innovation: Drivers, Complementarity and Productivity Effects”, UNU-MERIT Working Paper 2010-035.
Raymond, W., P. Mohnen, F. Palm, S. Schim van der Loeff (2010). “Persistence of innovation in Dutch manufacturing: is it spurious?”, Review of Economics and Statistics, 92: 495–504. Raymond, W., J. Mairesse, P. Mohnen, F. Palm (2015). “Dynamic Models of R&D, Innovation and
Productivity: Panel Data Evidence for Dutch and French Manufacturing”, European Economic Review, 78: 285-306.
Savignac, F. (2008). “Impact of Financial Constraints on Innovation: What Can Be Learned from a Direct Measure?”, Economics of Innovation and New Technology, 17(6); 553-569. Siedschlag, I., N. Killeen, D. Smith, C. O’Brien (2011). “Internationalisation and the Innovation
21
Siedschlag, I. and X. Zhang (2015). “Internationalisation of Firms and their Innovation and Productivity”, Economics of Innovation and New Technology, Vol. 24, No. 3, pp. 183-203. Silva, F., and C. Carreira (2012). “Do Financial Constraints Threat the innovation Process? Evidence
from Portuguese Firms”, Economics of Innovation and New Technology, 21(8): 701-736. Syverson, C., (2011), “What Determines Productivity?”, Journal of Economic Literature, 49 (2),
326-365.
22
Table A1: The share of firms with innovation expenditure in all firms by ownership and export participation
2006 2008 2010 2012 2006 2008 2010 2012 2006 2008 2010 2012
Non-exporter Exporter All firms
Irish-owned
Firms with R&D expenditure (in-house & external) 14.9% 14.7% 18.7% 21.9% 42.5% 42.8% 40.8% 50.3% 29.4% 27.4% 30.4% 37.5%
Firms with non-R&D expenditure 16.7% 17.9% 14.3% 9.1% 12.4% 15.4% 15.9% 6.2% 14.4% 16.7% 15.1% 7.5%
Firms with innovation expenditure 31.6% 32.6% 32.9% 31.0% 54.9% 58.1% 56.8% 56.5% 43.8% 44.1% 45.5% 44.9%
Firms with no innovation expenditure 68.4% 67.4% 67.1% 69.1% 45.1% 41.9% 43.2% 43.6% 56.2% 55.9% 54.5% 55.0%
Foreign-owned
Firms with R&D expenditure (in-house & external) 13.9% 19.9% 22.0% 24.9% 47.6% 42.0% 46.9% 51.4% 39.5% 36.0% 40.4% 44.0%
Firms with non-R&D expenditure 20.2% 8.2% 11.0% 8.8% 17.4% 14.1% 14.5% 11.3% 18.1% 12.5% 13.6% 10.6%
Firms with innovation expenditure 34.1% 28.1% 33.0% 33.6% 65.0% 56.2% 61.4% 62.7% 57.5% 48.5% 54.0% 54.6%
Firms with no innovation expenditure 65.9% 71.9% 66.5% 66.4% 35.2% 43.8% 38.8% 37.3% 42.5% 51.4% 46.0% 45.4%
All firms
Firms with R&D expenditure (in-house & external) 14.7% 15.5% 19.3% 22.4% 44.1% 42.5% 43.0% 50.6% 31.9% 29.7% 33.2% 39.5%
Firms with non-R&D expenditure 17.2% 16.4% 13.8% 9.0% 14.1% 14.9% 15.4% 8.1% 15.3% 15.6% 14.7% 8.4%
Firms with innovation expenditure 31.9% 31.8% 33.0% 31.5% 58.1% 57.4% 58.4% 58.7% 47.2% 45.3% 47.9% 47.9%
Firms with no innovation expenditure 68.1% 68.2% 67.1% 68.5% 41.9% 42.6% 41.6% 41.3% 52.8% 54.7% 52.0% 52.1%
23
Table A2: The share of firms with innovation expenditure in all firms by ownership and size class
2006 2008 2010 2012 2006 2008 2010 2012 2006 2008 2010 2012 2006 2008 2010 2012
Irish-owned
Small Medium Large All firms
Firms with R&D expenditure (in-house & external) 24.4% 23.3% 24.3% 31.5% 35.9% 34.2% 40.9% 48.2% 56.5% 49.0% 50.0% 45.1% 29.4% 27.4% 30.4% 37.5% Firms with non-R&D expenditure 12.0% 17.0% 15.9% 7.7% 19.5% 16.5% 13.5% 6.9% 14.1% 14.4% 15.4% 8.5% 14.4% 16.7% 15.1% 7.5% Firms with innovation expenditure 36.5% 40.3% 40.1% 39.2% 55.4% 50.7% 54.4% 55.1% 70.7% 63.5% 65.4% 53.7% 43.8% 44.1% 45.5% 44.9% Firms with no innovation expenditure 63.5% 59.7% 59.7% 60.8% 44.6% 49.5% 49.5% 44.9% 29.3% 36.5% 36.5% 46.3% 56.2% 55.9% 55.9% 55.0%
Foreign-owned
Firms with R&D expenditure (in-house & external) 22.6% 19.8% 26.8% 29.7% 41.1% 38.0% 40.1% 44.9% 64.4% 67.4% 71.6% 70.4% 39.5% 36.0% 40.4% 44.0% Firms with non-R&D expenditure 20.0% 13.7% 13.2% 6.6% 18.1% 12.3% 14.3% 14.8% 14.1% 10.4% 11.2% 6.7% 18.1% 12.5% 13.6% 10.6% Firms with innovation expenditure 42.6% 33.5% 40.1% 36.3% 59.2% 50.3% 54.3% 59.6% 78.5% 77.8% 82.8% 77.0% 57.5% 48.5% 54.0% 54.6% Firms with no innovation expenditure 57.0% 66.5% 66.5% 63.4% 41.1% 49.8% 49.8% 40.4% 21.5% 22.2% 22.2% 23.0% 42.5% 51.4% 51.4% 45.4%
All firms
Firms with R&D expenditure (in-house & external) 24.2% 22.7% 24.7% 31.1% 37.7% 35.7% 40.6% 46.9% 61.2% 59.4% 62.9% 60.4% 31.9% 29.7% 33.2% 39.5% Firms with non-R&D expenditure 13.2% 16.4% 15.4% 7.5% 19.0% 14.8% 13.8% 10.0% 14.5% 12.1% 13.4% 7.4% 15.3% 15.6% 14.7% 8.4% Firms with innovation expenditure 37.4% 39.2% 40.1% 38.6% 56.7% 50.5% 54.4% 56.9% 75.8% 71.5% 76.3% 67.7% 47.2% 45.3% 47.9% 47.9% Firms with no innovation expenditure 62.7% 60.8% 60.8% 61.3% 43.3% 49.5% 49.5% 43.1% 24.7% 28.5% 28.5% 31.8% 52.8% 54.7% 54.7% 52.1%
24
Table B1: Description of Variables – Linked CIS/CIP/ASI data
Model
stage Variable Type of variable Description Data Source
Propensity to invest in innovation and intensity of investment
Pr. (R&D) Dependent variable -
selection equation A binary indicator taking value 1 if the firm reported positive expenditure on internal R&D and/or external (purchased) R&D during the survey year. Over the survey period (the survey year and the two preceding years), and 0 otherwise.
CIS data, 2006-2012
R&D/Employee Dependent variable -
intensity equation The amount spent on internal and/or external R&D per employee, during the survey year.
CIS data, 2006-2012.
Pr. (Non-R&D) Dependent variable -
selection equation A binary indicator taking value 1 if the firm reported positive expenditure on non-R&D innovation activities over the survey period (acquisition of machinery, equipment, software buildings and other), and 0 otherwise.
CIS data, 2006-2012
Non-R&D/Employee Dependent variable - intensity equation The amount spent on non-R&D innovation activities (acquisition of machinery, equipment, software buildings and other) per employee, during the survey year.
CIS data, 2006-2012
Pr. (Inn. Exp.) Dependent variable -
selection equation A binary indicator taking value 1 if the firm reported positive expenditure on either R&D or non-R&D innovation activities over the survey period, and 0 otherwise.
CIS data, 2006-2012
Total Inn.
Exp./Empl. Dependent variable - intensity equation The amount spent on innovation activities (R&D and/or non-R&D) per employee, during the survey year.
CIS data, 2006-2012
Foreign ownership Independent variable A binary variable identifying whether the
firm has a domestic or foreign headquarter.
CIS data, 2006-2012
Export Intensity Independent variable The fraction of turnover from exports in
total firm turnover. CIP and ASI data,
2005-2012 Wage per
employee Independent variable The value of expenditure on wages reported by a firm, divided by the number of employees
CIP and ASI data, 2005-2012
Market Share Independent variable The ratio of a firm's (grossed) turnover
over the total NACE 2-dig. sector (grossed) turnover, in each year.
CIP and ASI data, 2005-2012 Average perceived internal financial constraint (3-digit industry)
Independent variable The 3-dig. sector level average of the
qualitative indicator (0, 1, 2, 3)
representing firms' perceived constraint to innovation arising from lack of internal funds. CIS data, 2006-2010 Average perceived external financial constraint (3-digit industry)
Independent variable The 3-dig. Industry level average of the
qualitative indicator (0, 1, 2, 3)
representing firms' perceived constraint to innovation arising from lack of external funds.
CIS data, 2006-2010
Average perceived market risk (3-digit industry)
Independent variable The 3-dig. Industry level average of the
qualitative indicator (0, 1, 2, 3)
representing firms' perceived constraint to innovation arising from uncertain demand.
CIS data, 2006-2010
Value Added per
25
number of employees. 2005-2012
Age Independent variable The number of years a firm has been
active, since it was first surveyed in the CIP or the ASI questionnaires. Gap years are counted towards the total age.
CIP and ASI data, 1991-2012
Employees Independent variable The number of employees reported by a
firm. CIP and ASI data,
2006-2012
Cooperation Independent variable A binary indicator taking value 1 if the
firm reported to have cooperated with other enterprises or institutions on its innovation activities. CIS data, 2006-2012 Knowledge production -innovation output Product
Innovation Dependent variable A binary indicator taking value 1 if the firm reports to have introduced a new product over the survey period (survey year and preceding 2 years).
CIS data, 2006-2012
Process
Innovation Dependent variable A binary indicator taking value 1 if the firm reports to have introduced a process innovation over the survey period (survey year and preceding 2 years).
CIS data, 2006-2012
Organizational
Innovation Dependent variable A binary indicator taking value 1 if the firm reports to have introduced an organizational innovation over the survey period (survey year and preceding 2 years).
CIS data, 2006-2012
Predicted R&D per
employee Independent variable The predicted amount of R&D (internal and external) expenditure per employee from the 1st stage
1st stage of model output Predicted Non-R&D per employee
Independent variable The predicted amount of non-R&D
expenditure per employee from the 1st stage 1st stage of model Predicted Innovation Expenditure per employee
Independent variable The predicted amount of total innovation
expenditure per employee from the 1st stage
1st stage of model output
Import intensity Independent variable The ratio of purchases from abroad over
total firm turnover CIP and ASI data,
2005-2012 Tangibles per
Employee Independent variable The value of investment in tangible capital, obtained by subtracting the investment in intangibles from the total investment, divided by the number of employees. CIP and ASI data, 2006-2012 Perceived internal financial constraints
Independent variable A binary indicator taking value 1 if the
firm reports constraints to innovation arising from lack of internal funds.
CIS data, 2006-2010
Perceived external financial
constraints
Independent variable A binary indicator taking value 1 if the
firm reports constraints to innovation arising from lack of external funds.
CIS data, 2006-2010
Perceived market
risk Independent variable A binary indicator taking value 1 if the firm reports constraints to innovation arising from uncertain demand.
CIS data, 2006-2010
Productivity Value added per
employee Dependent variable The value of sales, net of the cost of materials and services, divided by the number of employees.
CIP and ASI data, 2006-2012 Predicted
probability of product Innovation
Independent variable The predicted probability that a firm
reports to have introduced a new product over the survey period (survey year and preceding two years).
2nd stage of model output
26
probability of process Innovation
reports to have introduced a new process over the survey period (survey year and preceding two years).
of model output
Predicted probability of organizational innovation
Independent variable The predicted probability that a firm
reports to have introduced an
organizational innovation over the survey period (survey year and preceding two years).
2nd stage of model output
Exporter Independent variable A binary variable identifying whether the
firm reported sales from exporting. CIP and ASI data,
2006-2012
Importer Independent variable A binary variable identifying whether the
firm reported to have imported goods and services.
CIP and ASI data, 2006-2012
Year
Number
Title/Author(s)
ESRI Authors/Affiliates
Italicised
2017
570 The value of tourist angling: a travel cost method estimation of demand for two
destination salmon rivers in Ireland
Gianluca Grilli, John Curtis, Stephen Hynes, Gavin Landgraf
Advertising and investment spillovers in the diffusion of residential energy efficiency renovations
Matthew Collins and John Curtis
Working at a different level? Curriculum differentiation in Irish lower secondary education
Emer Smyth
Identifying rent pressures in your neighbourhood: a new model of Irish regional rent indicators
Martina Lawless, Kieran McQuinn and John R. Walsh
Who pays for renewables? Increasing renewable subsidisation due to increased datacentre demand in Ireland
Muireann Á. Lynch and Mel T. Devine
Can tenants afford to care? Investigating the willingness-to-pay for improved energy efficiency of rental tenants and returns to investment for landlords Matthew Collins and John Curtis
Female participation increases and gender segregation Claire Keane, Helen Russell and Emer Smyth
Pike (Esox lucius) stock management in designated brown trout (Salmo trutta) fisheries: Anglers’ preferences
John Curtis
Financial incentives for residential energy efficiency investments in Ireland: Should the status quo be maintained?
Matthew Collins, Seraphim Dempsey and John Curtis
Does a satisfied student make a satisfied worker? Adele Whelan and Seamus McGuinness
The changing relationship between affordability and house prices: a cross- country examination
Kieran McQuinn 569
568
567
566
565
564
563
562
561