Mechanistic Studies of Reactions at the Single-molecule Level Using
Microfluidics with Applications in Molecular Diagnostics
Thesis by
Bing Sun
In Partial Fulfillment of the Requirements for the Degree of
Doctor of Philosophy
CALIFORNIA INSTITUTE OF TECHNOLOGY
Pasadena, California
2014
ACKNOWLEDGEMENT
First of all, I must thank my research advisor, Professor Rustem Ismagilov, who shaped the way I learn, think, and do things in science. Thank you for teaching me how to think critically and frame the problem correctly, for guiding me to perform research creatively and logically, for training me to describe science accurately and attractively. To me these capabilities are the most precious treasure I have acquired in graduate study. I am also grateful for him always being supportive as a mentor both in research and in my personal career.
I would like to thank my family, without the support of whom I would not have completed this phase of my life. To my dear parents, Wanfu and Bo, who have been sharing all the happiness and sadness together with me even when they were over 7,000 miles away. They taught me not only to stand firm and spare every effort to overcome difficulties before achieving the goal, but also to cherish the satisfaction of any small achievement. It was them who inspired my interest in science, especially in chemistry. To my grandparents, my uncles and aunts, and my lovely cousins, thank you for being an amazing family.
else in Ismagilov lab, for making it an exciting and creative place to work. I would like to thank especially Whitney Robles and Bridget Samuels who generously devoted time in editing my writing pieces, including this thesis.
ABSTRACT
Motivated by needs in molecular diagnostics and advances in microfabrication, researchers started to seek help from microfluidic technology, as it provides approaches to achieve high throughput, high sensitivity, and high resolution. One strategy applied in microfluidics to fulfill such requirements is to convert continuous analog signal into digitalized signal. The capacity to handle large amounts of small volume liquid enables the isolation of single entities into small compartments and the analysis of these single entities one by one in a “digitized” format. One most commonly used example for this conversion is digital PCR, which has been made commercially available. The idea of counting the number of reacted compartments (triggered by the presence of the target entity) out of the total number of compartments and using Poisson statistics to calculate the input amount of target is quite straightforward.
However, there are still problems to be solved and assumptions/conditions to be validated before the technology is widely employed. In this dissertation, the digital quantification strategy has been examined from two angles: efficiency and robustness. The former is a critical factor for ensuring the accuracy of absolute quantification methods, and the latter is the premise for such technology to be practically implemented in diagnosis beyond the laboratory. Although the discussion raises more challenges for digital assay development, it brings the problem to the attention of the scientific community for the first time. The analog-to-digital conversion concept does not only provide approaches for absolute quantification, but also offers a platform to perform mechanistic studies at the single molecule level. What the detail of the reaction scheme is and how each parameter influences the “fate” and “rate” of reactions at the single entity level could be understood using microfluidic platforms.
TABLE OF CONTENTS
ACKNOWLEDGEMENT ... iii
ABSTRACT ... v
LIST OF ILLUSTRATIONS AND TABLES ... ix
CHAPTER 1 ... 1
INTRODUCTION ... 1
1.1 Demand and challenge for point-of-care (POC) diagnostics in limited-resource settings ... 1
1.2 The concept of analog-to-digital conversion: two definitions ... 3
1.3 Digitization can be realized on microfluidic platforms, using SlipChip as an example ... 3
CHAPTER 2 ... 7
CONVERTING ANALOG SIGNAL TO DIGITAL BY INTRODUCING THRESHOLD ENABLES VISUAL READOUT FOR A CYSTATIN C QUANTIFICATION ASSAY ... 7
2.1 Converting analog-to-digital readout using pre-determined thresholds ... 7
2.2 Applying the concept of threshold in the quantification assay of cystatin C ... 8
2.3 Evaluation of the robustness of the threshold position to temperature variation ... 10
CHAPTER 3 ... 13
COMPARTMENTALIZATION GENERATES DIGITIZATION: USING DIGITAL PCR ON A MULTIVOLUME MICROFLUIDIC DEVICE TO QUANTIFY VIRAL LOAD IN A LARGE DYNAMIC RANGE ... 13
3.1 The need for viral load quantification and its challenges ... 13
3.2 Digital PCR quantifies nucleic acid by converting analog signal to digital ... 14
3.3 Using a combination of multiple volumes to achieve large dynamic range ... 16
3.4 Running multiplex assays while maintaining large dynamic range on a multivolume SlipChip ... 17
CHAPTER 4 ... 21
FROM THERMAL CYCLING TO ISOTHERMAL: CHALLENGES FOR EFFICIENCY ... 21
4.1 Eliminating the need for thermal cycling using isothermal amplification ... 21
4.2 Loop mediated isothermal amplification (LAMP) ... 21
4.3 A problem to be carefully evaluated for digital amplification: efficiency ... 24
4.4 Improving efficiency by separating sequential reactions from one another ... 25
4.4 Mismatches between certain primers and templates reduces efficiency ... 29
CHAPTER 5 ... 32
5.1 Digital format offers higher robustness than bulk kinetic measurements ... 32
5.2 Comparison of the robustness between digital quantitative assays and bulk kinetic assays to temperature variation ... 33
5.3 Comparison of the robustness to changes in assay time for the digital quantitative assay and bulk kinetic assay ... 35
5.4 The integration of digital quantification with cell phone imaging enables direct result readout and feedback ... 36
CHAPTER 6 ... 38
A SIMPLE METHODOLOGY FOR HCV GENOTYPING AND RELATED INSIGHTS INTO “FATE” AND “RATE” AT THE SINGLE-MOLECULE LEVEL ... 38
6.1 The need for simple and easy HCV genotyping assay in limited-resource settings and an overview of existing technologies ... 38
6.2 A novel way to use competition—the combination of RT-LAMP and restriction endonuclease to generate sequence-specific signal ... 39
6.3 Improving assay performance when switching to a digital format ... 41
6.4 The capability of digital to decouple “fate” from “rate” by generating 2D data ... 43
6.5 The connection between single molecule kinetics and bulk kinetics ... 45
6.6 Improving the assay coverage by employing another amplification chemistry ... 48
CHAPTER 7 ... 50
CONCLUDING OVERVIEW ... 50
APPENDIX A ... 52
Authorship contribution statement and experimental section for Chapter 2 ... 56
APPENDIX B ... 63
Authorship contribution statement and experimental section for Chapter 3 ... 63
APPENDIX C ... 70
Authorship contribution statement and experimental section for Chapter 4 ... 70
APPENDIX D ... 77
Authorship contribution statement and experimental section for Chapter 5 ... 77
APPENDIX E ... 84
Authorship contribution statement and experimental section for Chapter 6 ... 84
APPENDIX F ... 91
LIST OF ILLUSTRATIONS AND TABLES
Figure 1 Schematic overview of fluid handling on SlipChip ... 5 Figure 2 Illustration of analog-to-digital conversion based on thresholds ... 8 Figure 3 Schematic illustration and experimental results of the threshold-based cystatin C quantification assay ... 10
Figure 4 Robustness test results at different temperatures and reaction times for threshold chemistry ... 12
Figure 5 Schematic drawing and bright field image of SlipChip used in digital PCR assay and the fluorescence image of digital results ... 15
Figure 6 Schematic drawing and bright field image of multivolume SlipChip device and the fluorescence image of assay results ... 17
Figure 7 Bright field image of multiplex format multivolume SlipChip and the fluorescence image of assay results ... 19
Figure 8 Schematic representation of the mechanism of LAMP ... 23 Figure 9 Schematic drawings and bright field images describing the operation of SlipChip for two-step digital experiments ... 26
Figure 10 Quantification results of HIV viral RNA concentration (copies/mL) with digital RT-LAMP using different protocols ... 27
Figure 11 A comparison of the new two-step RT-LAMP mechanism and the published one-step RT-LAMP mechanism ... 29
Figure 12 Quantification results of patient HIV RNA samples with digital RT-LAMP and digital RT-PCR ... 30
Figure 13 Schematic drawing for the comparison of quantification robustness between digital format and bulk kinetic format ... 33
Figure 14 Evaluation of the robustness of real-time RT-LAMP and digital RT-LAMP to variation in temperature ... 34
Figure 15 Evaluation of the robustness of digital RT-LAMP to variations in assay time ... 36 Figure 16 Automatic data analysis workflow and its validation using microscope imaging and Metamorph analysis. ... 37
Figure 17 Sequence alignment of the consensus of four genotypes, shown together with the digestion sites of NheI, BsrBI, and BstNI. ... 40
Figure 19 Image of DNA gel electrophoresis results for digestion of LAMP product at RT-LAMP conditions. ... 42
Figure 20 Schematic overview of the definition of “fate” and “rate”. ... 44
Figure 21 Results of real-time, single-molecule digital RT-LAMP/restriction endonuclease experiments for HCV RNA ... 45
Figure 22 Theoretical histogram of time-to-positive distribution for single molecules (A) in the absence and presence of restriction endonuclease and B) at different input target concentration. 47
CHAPTER 1
INTRODUCTION
1.1 Demand and challenge for point-of-care (POC) diagnostics in limited-resource settings
Diagnostics, defined as the process of attempting to determine or identify a possible disease, is a necessary step before treatment can be started. It plays an important role in global healthcare, in the sense that it does not only provide information for doctors to administer appropriate and timely care to patients, but also provides crucial surveillance data for public health strategies. The quality of a diagnostic test determines the accuracy of the test result and directly influences treatment decisions. Lack of access to high quality diagnostic tests or to even low quality diagnostic tests remains a huge problem in modern society, especially for the developing world or limited-resource settings.
The heavy burden of ill health caused by infectious diseases in the developing world is well recognized, where it accounts for over half of all deaths in children1. Malaria, acute respiratory infections, enteric infections, tuberculosis and HIV kill more than 10 million people each year, 95% of whom live in developing countries1. This number would have been smaller if early and reliable diagnostics were offered to patients at the initial stage of disease development and prompt treatments were adopted. However, people in the developing world usually have limited access to diagnostic platforms in centralized laboratories due to constraints in physical location or financial conditions. Clinical symptoms and local prevalence of a certain disease could be used occasionally as a rationale for beginning treatment, but it does not apply when diseases have no symptoms or have similar symptoms to other diseases2. As a result, the demand for easy-to-use, low-cost, transportable diagnostic platforms is a growing yet unmet need.
“ASSURED test”, which stands for: Affordable by those at risk of infection, Sensitive (few false negatives), Specific (few false positives), User-friendly (simple to perform and requiring minimal training), Rapid (to enable treatment at the first visit), Robust (does not require refrigerated storage), Equipment-free, and Delivered to those who need it3. These criteria have captured the features of a good POC diagnostic test, by emphasizing both the availability and flexibility of such a test, as well as its accuracy. As is often the case, an assay with low complexity and cost, such as a lateral flow strip pregnancy test, does not offer as much and as accurate information as a sophisticated test, such as an assay involving quantitative polymerase chain reaction (qPCR). However, the complexity and cost of sophisticated tests is usually high, preventing them from being used as POC tests. How to reduce the complexity and cost without sacrificing the accuracy of the test is the first issue to consider before developing a new POC diagnostic test.
If categorized based on the target, POC diagnostic tests include protein assays, nucleic acid assays, human cell assays, metabolite and small molecule assays, and drug and food safety tests4. Examples include the prostate-specific antigen (PSA) test, C-creative protein (CRP) test, troponin I test for protein targets4-5; tests for human immunodeficiency virus (HIV), influenza, Methicillin-resistant Staphylococcus aureus (MRSA), and tuberculosis (TB) for nucleic acid targets6; and tests for cancer, inflammatory response and hematological parameters for whole cell assays7. Although some of the tests above have satisfied some criteria of an ASSURED test, most of them are still labor intensive or not cost-effective, especially quantitative assays.
POC platform and cumbersome to operate by untrained users. One way to eliminate the need of such an instrument is to “translate” analog information into end-point digital information.
1.2 The concept of analog-to-digital conversion: two definitions
The definition of “digital” can be two-fold, as explained in a review by our group8: “the tendency to switch between discrete states in response to specific triggers”, which is often described by “a sharp sigmoidal change between two states over a narrow range of input” (e.g., “off” or “on”); and the isolation of single entity from others, which enables the analysis of this target independently, unlike in a “bulk” format, where the overall output is influenced by interactions between molecules or reactions.
As such, the concept of “analog-to-digital” conversion also has two definitions: converting a system with a continuous signal intensity change to a system with only two distinct states, and converting a system with all targets present in the same environment to a system with each target separated from others and confined within its own environment. As distinguishing two discrete states has much lower requirements for resolution than resolving continuous intensity, the conversion from analog-to-digital for the first definition could facilitate the simplification of readout systems, which will be demonstrated in the next chapter with an enzyme-linked immunosorbent assay (ELISA) system. For the second definition, the amount of input target is directly reflected in the digitized pattern at the endpoint, eliminating the need for real-time monitoring of bulk reaction progress. The remainder of this dissertation focuses on the use of this concept in the quantification of nucleic acids and the identification of nucleic acid sequences.
1.3 Digitization can be realized on microfluidic platforms, using SlipChip as an example
controlled by valves10, magnetic beads11 and other delicate structures to capture single targets12. The high resolution and the ability to increase local concentration of generated product or secretion grants microfluidic devices significant advantages over other platforms.
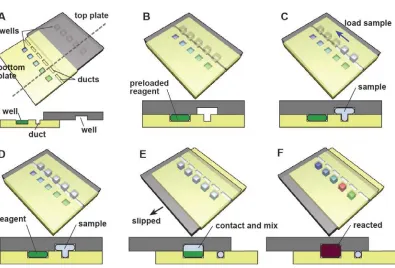
Figure 1 Schematic overview of fluid handling on SlipChip. (A) Off-set position of SlipChip, composed of a top plate and bottom plate, which are both etched with wells and ducts. (B) Assembled SlipChip at the “loading” position, where wells and ducts are connected. (C-D) The sample is loaded from inlet through the connected wells and ducts to the outlet. (E) Slipping-induced liquid stream to be broken into separate droplets and merged with preloaded reagent. (F) Reactions are triggered and different results are generated. Reproduced from reference 13 with permission of Royal Society of Chemistry.
CHAPTER 2
CONVERTING ANALOG SIGNAL TO DIGITAL BY INTRODUCING THRESHOLD ENABLES VISUAL READOUT FOR A CYSTATIN C QUANTIFICATION ASSAY
2.1 Converting analog-to-digital readout using pre-determined thresholds
As discussed in the previous chapter, the amount of information one can extract from a test is usually correlated to the complexity of the test. Qualitative tests such as pregnancy tests require only endpoint yes/no readout and are relatively robust to changes in environmental conditions, but they do not give information regarding the quantity of the target. Quantitative tests usually require instruments to resolve continuous signal intensity at an endpoint, such as a fluorometer or Ultraviolet–visible (UV/Vis) spectrometer, or require kinetic measurements such as ELISA and qPCR. For protein target quantification, the most widely used methodology is still to measure the change in output (color, voltage, precipitation) over time. Simple and quantitative assays have been developed17, but only with unsatisfactory resolution of an order of magnitude or higher.
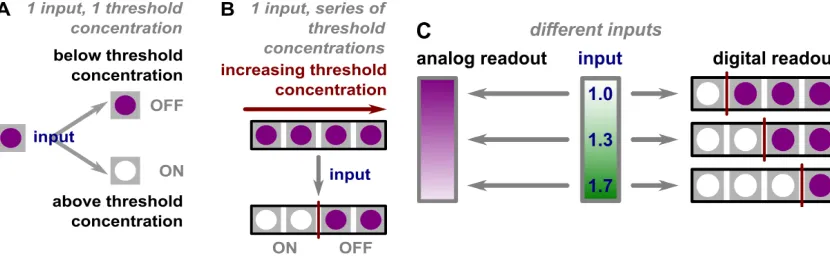
Figure 2 Illustration of analog-to-digital conversion based on thresholds. (A) ON (clear)/OFF (purple) of a single reaction depending on the relevant abundant of target to inhibitor. (B) A series of ON/OFF bits created by increasing threshold concentrations. (C) An illustration of analog readout versus digital readout. An analog readout gives a gradient change in intensity while a digital readout comprises a series of bits. Reprinted with permission from reference 18. Copyright 2013 American Chemical Society.
2.2 Applying the concept of threshold in the quantification assay of cystatin C
Glomerular filtration rate (GFR) describes the flow rate of filtered fluid through the kidney and is an indication of the state of kidney. Creatinine is the most widely used biomarker and its clearance rate is a useful measure for approximating the GFR. However, the level of creatinine varies with muscle mass and protein intake, and is not accurate at detecting mild renal impairment. A more accurate renal function indicator is the level of cystatin C, a low molecular weight protein removed from the bloodstream by glomerular filtration in the kidney. Its level is less dependent on age, gender, race and muscle mass compared with creatinine. It has been shown that cystatin C alone is superior to creatinine as a marker of kidney function in a meta-analysis19, and adding the measurement of cystatin C to that of creatinine improves assay accuracy20. Therefore, here cystatin C is chosen as the model system to study. For cystatin C measurements, small changes as low as a 1.5 fold increase in concentration need to be detected21.
concentration than the enzyme concentration, all enzymes are inhibited and the reaction stays negative. For threshold positions with lower inhibitor concentration than the enzyme concentration, uninhibited enzyme will turn the reaction to positive. The concentration of available active enzyme increases dramatically near the threshold position with comparable inhibitor and enzyme concentration and thus changes the enzymatic reaction from negative to positive. The enzyme Acetylcholinesterase (AChE) can hydrolyze acetylthiocholine to thiocholine, which then turns the purple I3
Figure 3 Schematic illustration and experimental results of the threshold-based cystatin C quantification assay. (A) A schematic drawing of the threshold chemistry and detection reactions. When the concentration of the enzyme AChE (star shape) exceeds that of the inhibitor (hemispherical shape), the enzyme hydrolyzes acetylthiocholine to give thiocholine. (B) A drawing of the complex used in the magnetic bead-based immunoassay for cystatin C, where cystatin C is conjugated with capture antibody on the magnetic bead and detection antibody linked to AChE via the biotin-avidin structure. (C) A drawing of the overall SlipChip design and assay procedures. One of the 12 columns is shown (11 times), illustrating the 8 steps of the assay controlled by the movement of the top (black) plate. The movement of magnetic beads is shown with red dashed arrows. (D) Photographs of results from standard solutions and clinical serum samples over a wide dynamic range, with each row corresponding to one assay (one SlipChip device). The very bottom row is a photograph of the result of the 3.29 mg/L patient sample taken by an iPhone 4 camera. Columns 3–4, 5–6, 7–8, 9–10, and 11–12 were set up as duplicates such that each pair contained the same inhibitor concentration. Scale bar: 2 mm. Reprinted with permission from reference 18. Copyright 2013 American Chemical Society.
Figure 4 Robustness test results at different temperatures and reaction times for threshold chemistry. (A) False-color maps showing the results of threshold chemistry over a 1.3x dilutions of inhibitor concentration (13, 16, 21, 27, 36, and 46 nM) across a 12-degree range of temperatures (22 °C, 25 °C, 28 °C, 31 °C, and 34 °C). Three repeats are shown in different rows. (B) False-color maps showing the results of threshold chemistry over a 1.3x dilutions of inhibitor concentration (1.3, 1.6, 2.1, 2.7, 3.6, and 4.6 nM) across a 12-degree range of temperatures (22 °C, 25 °C, 28 °C, 31 °C, and 34 °C). Three repeats are shown in different rows. Higher absorbance stands for higher enzymatic activity. Reprinted with permission from reference 18. Copyright 2013 American Chemical Society.
CHAPTER 3
COMPARTMENTALIZATION GENERATES DIGITIZATION: USING DIGITAL
PCR ON A MULTIVOLUME MICROFLUIDIC DEVICE TO QUANTIFY VIRAL
LOAD IN A LARGE DYNAMIC RANGE
3.1 The need for viral load quantification and its challenges
3.2 Digital PCR quantifies nucleic acid by converting analog signal to digital
Most nucleic acid-based quantitative tests are performed in central laboratories with real-time PCR. However, this method is cost-prohibitive under limited-resource settings and usually requires multiple instruments, highly skilled technicians, and isolated rooms. Digital PCR on simple microfluidic devices presents an alternative quantification method in non-laboratory settings. In digital PCR, single nucleic acid molecules are separated into compartments and amplified independently. An absolute count of the target molecule is obtained at the endpoint, eliminating the need for real-time monitoring.
Figure 5 Schematic drawing and bright field image of SlipChip used in digital PCR assay and the fluorescence image of digital results. (A) Schematic overview of the design and mechanism of SlipChip for digital PCR. Black solid line depicts the top piece (a) and blue dotted line depicts the bottom piece (b). The two pieces are assembled and the aligned such that the elongated wells in the top and bottom plates overlapped to form a continuous fluidic path (c). The aqueous reagent (red) is injected into SlipChip and flows through the connected elongated wells (d). The two pieces are slipped relative to each other to the position where the fluidic path breaks up and isolated droplets form (e). (B) Digital PCR on the SlipChip with different concentrations of S. aureus gDNA. a-f) Digital PCR on the Slipchip with a serial dilution of target DNA template ranging from 100 pg/µL to 0 fg/µL. Reproduced from Reference 16 with permission of The Royal Society of Chemistry.
A
3.3 Using a combination of multiple volumes to achieve large dynamic range
Typical digital PCR platforms including the SlipChip design discussed above use wells of the same volume. The upper limit of quantification is determined mainly by the volume of each well and the lower limit of detection is determined by the total volume analyzed on the device. Therefore, in order to achieve a large dynamic range, a large number of wells need to be used. How to achieve the largest dynamic range with the least material and space possible remained a challenge. Our solution was to combine wells of different volumes on the same device. The smallest wells enable quantification of the target at high concentrations while the large volume wells contribute to the quantification of the target at low concentrations. This multi-volume approach can achieve the same dynamic range as single-volume approaches without the need for an excessive number of wells23. Careful consideration in the mathematical treatment when combining results from multiple volumes has been given23 and the analysis was successfully applied in the quantification of HIV and HCV RNA28.
Figure 6 Schematic drawing and bright field image of multivolume SlipChip device and the fluorescence image of assay results (A) The bright field image (a, e-g) and schematics (b-d) of the rotational multivolume SlipChip (well volumes: 1nL, 5nL, 25nL, 125nL). The dead-end filling process was shown step-by-step: (b,e) SlipChip at the loading position; (c,f) orange food-dye was loaded along the connected wells; (d, g) after rotational slipping, droplets of four different volumes were formed simultaneously. (B) A serial dilution of the synthetic RNA on rotational multivolume SlipChip from 0 to 2.2×10⁶ molecules/mL in the RT-PCR mix. Reprinted with permission from reference 28. Copyright 2010 American Chemical Society.
3.4 Running multiplex assays while maintaining large dynamic range on a multivolume SlipChip
Figure 7 Bright field image of multiplex format multivolume SlipChip and the fluorescence image of assay results. (A) A photograph of a multiplex SlipChip device for 5 different samples (shown in different colors). Inset shows a zoomed-in area at the edge between two samples. (B) Representative experiment performing RT-PCR of HIV viral RNA at an expected concentration of 51 molecules/mL to test the lower detection limit of the device. This experiment was repeated six times to quantify the viral RNA concentration. (C) Fluorescence image of a multiplexed digital RT-PCR detection panel with 5 sections: I-V) measurement of control RNA in HCV sample, HCV viral RNA; negative control for HIV; HIV viral RNA; negative control for HCV. Inset shows an amplified area from HCV viral load test. Reprinted with permission from reference 28. Copyright 2010 American Chemical Society.
The multiplexing capability enables easy incorporation of necessary control experiments in the same assay and simultaneous monitoring of multiple targets, such as co-infection diseases and genotyping. The multivolume multiplex device also allows flexibility of using the same device to perform multiple assays of lower quality or single assays with higher quality depending on the application. Such a platform could be valuable in various applications besides viral load
A
quantification, such as detection of rare cells or rare alleles and prenatal diagnostics due to its high sensitivity. The rotational format is suitable to be applied in resource-limited settings because of the ease of operation.
CHAPTER 4
FROM THERMAL CYCLING TO ISOTHERMAL: CHALLENGES FOR EFFICIENCY
4.1 Eliminating the need for thermal cycling using isothermal amplification
Although digital PCR has been studied and incorporated in various molecular diagnostic assays16, 25-27
, the requirement of thermocycling limits its application in non-laboratory settings. Isothermal nucleic amplification technologies, which use a constant temperature during amplification, reduce the cost and complexity of the instrument, and therefore are more suitable for limited-resource settings. A water bath or very simple chemical heater could be used as the heating source30. Many isothermal amplification methods have been invented, including Nucleic Acid Sequence Based Amplification (NASBA) 31, Signal Mediated Amplification of RNA Technology (SMART) 32, Helicase Dependent Amplification (HDA) 33, Loop Mediated Isothermal Amplification (LAMP)34, Recombinase Polymerase Amplification (RPA) 35, Rolling Circle Replication (RCA) 36, Strand Displacement Amplification (SDA) 37, Exponential Amplification Reaction (EXPAR)38, Nicking Enzyme Amplification Reaction (NEAR) 39, and DNA circuits40. The underlying principles for each amplification chemistry differ, but the key issue for isothermal amplification chemistry is how to generate single-stranded DNA (ssDNA) or ssRNA that allows further annealing of the primer and elongation initiated by the primer to form new strands. This can be achieved by many means, such as with enzyme-assisted double strand opening, strand displacement, and RNA transcription. However, to be applied in a POC test, the reaction should have some other features, including low rates of false positives and false negatives, low requirements for storage conditions, and functionality without complicated instruments for signal readout.
4.2 Loop mediated isothermal amplification (LAMP)
4.3 A problem to be carefully evaluated for digital amplification: efficiency
Here we use RT-LAMP for HIV RNA quantification as a model system to answer the question of whether digital RT-LAMP is an attractive alternative to real-time RT-PCR for quantitative diagnosis in limited-resource settings42. Although digital LAMP has been demonstrated previously with dsDNA target43, digital RT-LAMP has never been reported before. The reverse transcription step is necessary when targeting a variety of infectious disease, but could potentially add complexity and introduce issues. We found that performing digital RT-LAMP in a single step on SlipChip is indeed problematic for quantifying HIV viral RNA: the quantification result using digital RT-LAMP was only 2.0% of that achieved using digital RT-PCR with the same template concentration. In this experiment, we compared quantification results of HIV viral RNA at four dilutions using two different digital chemistries—digital RT-PCR and digital RT-LAMP. Digital RT-PCR with primers targeting the LTR region of HIV was used as the standard because it has been validated previously28. For RT-LAMP, we used a commercial kit and a set of primers targeting the p24 gene modified based on previous publication44. We observed dilution curves with good linearity for both digital chemistries listed above; however the absolute values were dramatically different: the same concentration of RNA gave quantification values that differed by ~50 fold, with digital RT-LAMP giving lower digital counts. We also performed digital RT-PCR with B3/F3 primers taken from the LAMP primer set for comparison and found that even with the same amplification chemistry, the quantified value still differed by 2 fold, with B3/F3 primers giving lower digital counts.
such as digital RT-LAMP and digital RT-PCR with B3/F3 primers, will not give accurate results and will be inadequate for quantifying lower concentrations of analytes. This is a problem, especially in the case of HIV viral load, where changes most often in the range of 50 to 5,000 copies of RNA per mL need to be quantified to make clinical decisions.
4.4 Improving efficiency by separating sequential reactions from one another
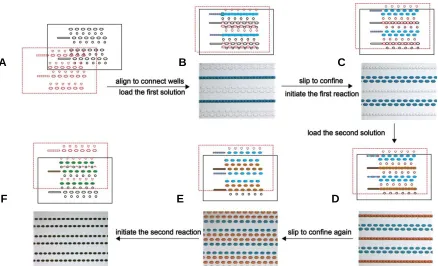
Figure 9 Schematic drawings and bright field images describing the operation of SlipChip for two-step digital experiments. A) Top piece (black) and bottom piece (red) facing each other before assembly. B) The two pieces were aligned to connect ducts and wells. Solution 1 (blue) was introduced along the connected channel. C) Slipping caused the fluid stream to break and isolated droplets were generated and confined in each well. The first step of reaction could be triggered at this stage. D) A second solution (orange) was loaded from another inlet along another set of connected wells and ducts. E) An additional slip generated isolated droplets. F) The two solutions were mixed on the device and the second step of the reaction was triggered simultaneously for all molecules. Reprinted with permission from reference 42. Copyright 2013 American Chemical Society.
With the two-step SlipChip device, we evaluated the influence of several factors in the reverse transcription step, including the orders of primers annealing and the property of different enzymes. We found that when the following changes were made, the efficiency was improved by 10 fold (Figure 10A): 1) only having BIP primer in the first RT step to exclude the interference of other primers; 2) replace AMV reverse transcriptase with Superscript III reverse transcriptase; 3) adding thermostable RNase H in the second step.
B
A C
[image:36.612.117.555.69.335.2]Figure 10 Quantification results of HIV viral RNA concentration (copies/mL) with digital RT-LAMP using different protocols. (A) Quantification results of HIV viral RNA (copies/mL) in a serial dilution experiment on SlipChip using one-step digital LAMP and two-step digital RT-LAMP (n=4). Error bars represent standard deviation. (B) i-vii: one-step digital RT-RT-LAMP; two-step digital RT-LAMP, all primers in RT two-step, AMV RT; two-two-step, BIP in RT two-step, AMV RT; two-step, BIP in RT step, Superscript III; two-step, BIP in RT step, AMV RT, with RNase H; two-step, BIP in RT step, Superscript III, with RNase H; and two-step, BIP in RT step, Superscript III, with RNase H, 0.5x calcein (n=2). Reprinted with permission from reference 42. Copyright 2013 American Chemical Society.
We first hypothesized that if instead of BIP primer, LOOP_B or B3 primer hybridize first to the RNA target and initiate reverse transcription, they would hinder the formation of looped structures on the B side. To test this hypothesis, we tested the efficiency when only BIP primer was present in the first step versus the efficiency when all primers were present, and found a 2 fold higher efficiency for the former. We then evaluated the performance of two different reverse transcriptases to see if the property of the enzyme played a role here. It was found that replacing the AMV reverse transcriptase with Superscript III, which has been reported to have a higher yield, led to no efficiency change. However, when RNase H was added to the second solution, the efficiency improved to 25% (Figure 10B). This could be attributed to the lack of RNase H activity and strand displacement activity in Superscript III—although it synthesized more cDNA, the release of cDNA was prevented.
To exclude the influence of the reverse transcription step, we performed digital LAMP assay with a synthetic 225 nucleotide ssDNA of the same sequence as the HIV RNA as template. The hypothesis behind this was that if the formation of desired cDNA was no longer the bottleneck,
[image:37.612.121.516.74.216.2]Figure 11 A comparison of the new two-step RT-LAMP mechanism and the published one-step RT-LAMP mechanism. In the initial step, the two-step mechanism uses only BIP primer, while the one-step protocol uses all primers together. After the formation of the DNA:RNA hybrid, the two-step mechanism uses RNase H instead of B3 primer-initiated strand displacement to release the cDNA. The two mechanisms converge after the formation of first-strand cDNA that is looped on one side. Figure truncated; details of cycling amplification including the loop primers’ annealing not shown. Inset shows designated primers—B2 and B2c, B3 and B3c, F1 and F1c are complementary sequences, respectively. Reprinted with permission from reference 42. Copyright 2013 American Chemical Society.
The developed two-step digital RT-LAMP protocol was tested against four patient samples to evaluate the influence of sequence variation to the efficiency of digital RT-LAMP. As shown in Figure 12, the digital RT-LAMP efficiency were 43% ± 9%, 139% ± 33%, 37% ± 20%, and 0.9% ± 0.2% compared to digital RT-PCR with LTR primers for patient sample #1-4. Sequencing results showed that there were 3, 2, 5 and 5 point mutations in the priming regions of sample #1-4, respectively. Therefore, we concluded that the efficiency of digital RT-LAMP is sensitive to mutations in the priming region of the RNA sequence. The efficiency was dramatically increased (the rightmost column compared to the column that is second from the right) from 0.9% ± 0.2% to 22% ± 1 % when mutations in the critical priming position (such as 3’ or BIP primer) were corrected. The high specificity of the LAMP reaction often results in relatively low tolerance to mutations and therefore it would be valuable for the assay to maintain both high specificity and good tolerance to mutations. To achieve this goal, more than one set of primers could be included in a single assay to ensure a higher probability of accurate readings, although this idea needs to be tested experimentally.
Figure 12 Quantification results of patient HIV RNA samples with digital RT-LAMP and digital RT-PCR. Rightmost column represents the quantification results for sample #4 after primers correction for mutations. Error bars represent standard deviation (n=3). Reprinted with permission from reference 42. Copyright 2013 American Chemical Society.
from the calcein detection system that should be readable by a cell phone. We explored the possibility of using digital RT-LAMP in the quantification of HIV viral load and proposed and tested a two-step protocol for improving the efficiency of this assay. We want to bring to researchers’ attention that digital amplification technologies should not always be assumed to provide absolute quantification until validated against a standard.
CHAPTER 5
FROM THERMAL CYCLING TO ISOTHERMAL: CHALLENGES FOR ROBUSTNESS
5.1 Digital format offers higher robustness than bulk kinetic measurements
Robustness, defined as the consistency of measurement results in the presence of perturbation, is a key factor to consider when designing a POC test. In laboratory settings, robustness is less of a problem because of the availability of dedicated equipment to control experimental conditions precisely. However, such control of reaction conditions often cannot be easily achieved in limited-resource settings, where POC tests are most frequently used. For nucleic acid quantification, nonlinear chemical amplification such as qPCR is usually employed. However, the robustness of such a reaction scheme is not yet fully understood. When quantification is based on the kinetics of an assay, robustness becomes an especially relevant issue, because once the rate of reaction changes, the results of the assay will be influenced directly. While a 3 fold change in HIV viral load could result in a different clinical decision, a change in temperature of a few degrees could potentially shift the results by more than that, as shown below.
Figure 13 Schematic drawing for the comparison of quantification robustness between digital format and bulk kinetic formats. (A) Quantification of the concentration of the target molecule under ideal conditions: the difference in concentration of the target molecule is reflected by the positive counts in the digital format and the reaction progress in the kinetic measurement. (B) Quantification under non-ideal conditions: the variation in reaction rate does not change the counts in digital format, but influences the reaction progress in the kinetic measurement. Reprinted with permission from reference 41a. Copyright 2013 American Chemical Society.
5.2 Comparison of the robustness between digital quantitative assays and bulk kinetic assays to temperature variation
To evaluate and compare the robustness of digital and kinetic measurements, we used RT-LAMP with an HIV RNA template as a model system. As a rapid, sensitive, and specific isothermal amplification chemistry, RT-LAMP is a good candidate for a POC test, and it has been previously demonstrated on SlipChip microfluidic device for the quantification of HIV viral RNA42.
We first tested whether quantitative measurements using real-time RT-LAMP assay are robust to temperature fluctuations. Using the two-step protocol developed previously42 we performed real-time RT-LAMP on an Eco real-real-time PCR machine. A two-fold change in HIV RNA concentration (1 x 10⁵ copies/mL and 2 x 10⁵ copies/mL) was successfully distinguished at each
A
temperature (at 57 °C p = 0.007, at 60 °C p = 0.01, at 63 °C p = 0.04). However, the change in reaction time caused by temperature shifts for each concentration was greater than the change caused by concentration difference (Figure 14A); therefore the two concentrations became indistinguishable if data for different temperatures were grouped together (p=0.25).
Figure 14 Evaluation of the robustness of real-time RT-LAMP and digital RT-LAMP to variation in temperature. Two concentrations were quantified with A) real-time RT-LAMP and B) digital RT-LAMP assays across a six degree temperature range (n=3). Reprinted with permission from reference 41a. Copyright 2013 American Chemical Society.
The robustness of the digital format of the same RT-LAMP assay was also tested across the same temperature range with the same two concentrations of HIV RNA. The concentration of RNA was determined using Poisson statistics based on the number of positive wells after amplification. Unlike the real-time bulk RT-LAMP assay, the digital RT-LAMP assay could not only distinguish between the two concentrations at each temperature; it could also differentiate the two concentrations despite temperature fluctuations (p=6.7×10⁻⁷). We then concluded that the digital RT-LAMP assay for the quantification of HIV RNA is more robust to temperature fluctuation than the real-time RT-LAMP assay.
The equilibria of DNA-enzyme, RNA-enzyme, DNA:DNA hybridization, the rate of enzyme attachment and nucleic acid annealing were all temperature-dependent. But again, because the digital format quantification was influenced only by the probability of initiation, it should be more robust to these changes compared with the bulk kinetic assay.
5.3 Comparison of the robustness to changes in assay time for the digital quantitative assay and bulk kinetic assay
Figure 15 Evaluation of the robustness of digital RT-LAMP to variations in assay time. Two concentrations were quantified with digital RT-LAMP assays and the counts were recorded in a real-time format. Counts at 40, 50 and 60 minutes were plotted (n=3). Reprinted with permission from reference 41a. Copyright 2013 American Chemical Society.
5.4 The integration of digital quantification with cell phone imaging enables direct result readout and feedback
Figure 16 Automatic data analysis workflow and its validation using microscope imaging and Metamorph analysis. A) The image acquisition and analysis workflow with a cell phone and remote server. a)-d): Image was captured by a Nokia phone and transferred via the “cloud” to a remote centralized computer, where software recognized the device and converted the counts into concentration or did not recognize the device and asked the user to retake image. B) Validation of cell phone imaging and analysis with customized Labview program against microscope imaging and analysis with commercial software. Reprinted with permission from reference 41a. Copyright 2013 American Chemical Society.
CHAPTER 6
A SIMPLE METHODOLOGY FOR HCV GENOTYPING AND RELATED INSIGHTS INTO “FATE” AND “RATE” AT THE SINGLE-MOLECULE LEVEL
6.1 The need for simple and easy HCV genotyping assay in limited-resource settings and an overview of existing technologies
HCV is a major public health concern and a leading cause of chronic liver disease and cirrhosis. An estimated population of 180 million are infected with HCV worldwide, and more than 350,000 people die every year from HCV-related liver diseases45. There is currently no vaccine for hepatitis C; however, it can be cured using antiviral medicines. Different genotypes respond differently to the same treatment; therefore, determining genotypes or even subtypes before treatment is necessary to adjust the dose and duration of the therapy, and predict the likely outcome. 7 genotypes of HCV are categorized, based on sequence similarity. Genotypes differ from one another by 31-33% at the nucleotide level. The diversity of sequence is not uniform in all regions of the HCV genome—some regions, such as 5’UTR, are quite conserved while other regions, such as E2, are hypervariable. Genotyping is necessary not only for the current standard therapy with PEG-interferon and ribavirin46, but also for the new small-molecule antiviral drugs such as Sofosbuvir (Gilead)47.
Hybridization-based assays, such as Siemens VERSANT HCV Genotype 2.0 assay (LiPA), are the most widely used HCV genotyping method. While they provides more subtype information than real-time PCR Taqman assay, the requirement for stringent control of conditions, a non-negligible degree of error due to secondary structures of the product, and different tolerance to single-nucleotide polymorphisms decrease their robustness. As pointed out, none of the methods discussed above are easily adoptable in limited-resource settings with a simple setup.
6.2 A novel way to use competition—the combination of RT-LAMP and restriction endonuclease to generate sequence-specific signal
Herein we introduced a new method for HCV genotyping based on the combination of isothermal amplification and sequence-specific inhibition. RT-LAMP was selected as the amplification chemistry because of its high tolerance to biological samples and compatibility with simple imaging devices41a. Restriction enzymes were chosen as the inhibitor considering their high specificity to DNA sequences under isothermal conditions. The underlying principle is that the inhibition takes place during amplification and the result of amplification itself serves as the readout.
be designed with fewer reactions than genotypes (e.g., three restriction endonucleases to differentiate four genotypes here).
Figure 17 Sequence alignment of the consensus of four genotypes, shown together with the digestion sites of NheI, BsrBI, and BstNI. Dots stand for nucleotides that are the same between genotypes and the SNPs are shown with corresponding letters. LOOP_F (LF), F1c, B1c and LOOP_B (LB) are the priming regions. GT: genotype.
Figure 18 Predicted and experimental HCV genotyping pattern. (A) Prediction matrix for different combination of genotypes and restriction endonucleases. Red indicates predicted inhibition, black stands for normal amplification, and white stands for inhibition. (B) and (C) Graphs showing a comparison of HCV genotyping results using (B) real-time bulk assay (ttp: time-to-positive) and (C) end-point digital assay (n=3). (D) Photographs (inverted intensity) of end-point digital experimental genotyping results. The first column in both sections represents the positive control in the absence of restriction endonuclease and the following three columns indicate experiments with different restriction endonucleases. Each row represents a genotype of HCV RNA. Reproduced from the accepted version of reference 49. Copyright © 2014 WILEY-VCH Verlag GmbH & Co. KGaA
6.3 Improving assay performance when switching to a digital format
change significantly improved assay sensitivity. The activity and specificity of restriction endonuclease under LAMP conditions was further confirmed by DNA gel electrophoresis analysis of the digestion product. All four genotypes of HCV RNA were amplified with RT-LAMP before subjected to digestion with NheI-HF, BsrBI, and BstNI at RT-RT-LAMP conditions (63 °C in LAMP buffer). The restriction pattern (Figure 19) matched the one predicted by informatics analysis.
Figure 19 Image of DNA gel electrophoresis results for digestion of LAMP product at RT-LAMP conditions. Lanes labeled with L are 100 bp DNA ladders. Lanes 1-4 are positive control, NheI digestion product, BsrBI digestion product, and BstNI digestion product for genotype 1, respectively. Lanes 5-8 are positive control and 3 RE digestion products for genotype 2. Lanes 9-12 are for genotype 3 and Lanes 13-16 for genotype 4. The specificity of RE to different genotypes are the same as predicted: for genotype 1 all 3 REs digested the product; for genotype 2 only NheI digested the product; for genotype 3 only BsrBI digested the product, and for genotype 4 both NheI and BsrBI digested the product. Reproduced from the accepted version of reference 49. Copyright © 2014 WILEY-VCH Verlag GmbH & Co. KGaA.
methodology is that it is well-established and the instrument already exists in many research labs. We, however, prefer the end-point digital format for limited-resource settings: it does not require complex instrumentation for performing kinetic measurements; it is expected to be robust to fluctuation in conditions; and it can be read-out with a cell phone, as stated in the published paper49. The viral load can be directly read from the positive control as well, giving more information for making clinical decisions. However, we do want to point out that the absolute measurement is not a necessity, because only the “extent” to which the digital counts decrease needs to be measured. The effectiveness of the inhibition chemistry determines the resolution of the digital measurement, with stronger inhibition resulting in lower requirements for resolution.
6.4 The capability of digital to decouple “fate” from “rate” by generating 2D data
Figure 20 Schematic overview of the definition of “fate” and “rate”. (A) In general, “fate” determines whether a molecule can proceed to the final stage of a reaction and “rate” determines how quickly the accumulation of products amplified from one “survived” molecule is. (B) For the competition between RT-LAMP and restriction digestion, “fate” determines whether the first dsDNA gets digested or proceeds to the cycling amplification and “rate” determines how quickly the amplicons accumulate. Reproduced from the accepted version of reference 49. Copyright © 2014 WILEY-VCH Verlag GmbH & Co. KGaA
[image:54.612.114.541.66.262.2]As a comparison, we performed the same competition experiments in the bulk real-time format using an RNA concentration equivalent to that of a single molecule in a well. Without BsrBI, the time-to-positive in this bulk experiment was close to that of the first positive molecule in the digital format (approximately 2 min slower) (Figure 21A). Upon addition of BsrBI, the bulk reaction showed increased variance and slowed down to the same extent as that for the first molecule in the digital format (Figure 21C). These data suggest that once exponential amplification of one molecule initiates, this process dominates the reaction mixture and is not affected by the amplification of the molecules that amplify later. The real-time digital format describes not only the fate, but also the rate of each molecule; thus, it provides more information than bulk real-time, which only reflects the rate of the first few amplified molecules, and end-point digital, which only reflects the fate.
Figure 21 Results of real-time, single-molecule digital RT-LAMP/restriction endonuclease experiments for HCV RNA. (A), (B) Graphs showing 1280 fluorescence traces for the RT-LAMP amplification process of all the wells on a SlipChip device (solid light blue) and averaged fluorescence curve in bulk (dashed dark blue) in the absence of restriction endonuclease (A) and the traces for digital (solid light red) and for bulk (dashed dark red) in the presence of restriction endonuclease BsrBI (B). Horizontal solid lines indicate the threshold levels to consider a well positive. Vertical solid lines show the mean of the time-to-positive distribution. The scales in (A) and (B) are the same. (C) Graph showing the histogram of time-to-positive distribution for wells exceeding the threshold in (A), blue, and (B), red. The two bars below the x-axis show time-to-positive for real-time bulk experiments, the widths of which stand for standard deviation for the bulk assay (n=5). Reproduced from the accepted version of reference 49. Copyright © 2014 WILEY-VCH Verlag GmbH & Co. KGaA
The next question we asked is how to establish correlation between single molecule kinetics and bulk kinetics based on these findings. As we have discussed previously, bulk kinetics is only determined by the rate of first few amplified molecules. For the sake of simplicity, here we consider the bulk rate as only related to the rate of the first amplified molecule. The effect of various events (adding inhibitors, changing input target concentrations, changing temperatures, etc.) can all be traced to changes in the rate of the first amplified molecule.
In the case of adding restriction endonuclease, the entire distribution is shifted to the right (Figure 22A), which could be captured as the shift of the mean of the distribution from m1 to m2. As a result of this rate change, the first amplified molecule should have a later time-to-positive. Meanwhile, the fate of amplification is changed as well; hence each molecule has a smaller chance of being amplified, presented as the decrease of total counts (area under the peak). As a result, the probability of having molecules amplified at early time points is smaller. The change of time-to-positive from t1 to t2 for the first amplified molecule is a joint effect of both rate change and fate change, and therefore the difference between t1 and t2 (fate and rate effect) should be larger than that between m1 and m2 (pure rate effect). However, if the reaction scheme of amplification changes significantly, which changes the width of distribution, other considerations need to be taken into account to determine the time-to-positive for the first amplified molecule.
input molecules will not further shift the time-to-positive for the first molecule because it has reached the highest possible rate (determined by reaction condition). Further increases in the number of molecules will increase the frequency at this minimum time-to-positive (c2 to c3 in Figure 22B) and cause the bulk time-to-positive to decrease because of higher starting concentration.
by that first molecule; therefore the bulk kinetics are determined by multiple molecules starting to amplify at early time points. The difference between bulk positive and digital time-to-positive for the first molecule is the amount of time required for a certain amount of molecules to start amplification.
More questions raised by the results presented here await to be answered, as stated in the published paper49: “What is the right theoretical framework within which to analyze both rate and fate in single-molecule competition reactions? What are the molecular details of the mechanisms responsible for fate and rate determination in such systems? Can robustness of output of these systems be predicted a priori? What are the best amplification and inhibition chemistries with which to implement such competition reactions for genotyping and other genetic analyses?”
6.6 Improving the assay coverage by employing another amplification chemistry
polymerase in the presence of restriction endonuclease limits the amount of restriction endonuclease in the system, which could be the reason for incomplete inhibition in the bulk format. In the NASBA system, no obvious ab initio synthesis has been observed; therefore the amount of restriction endonuclease could be increased for better inhibition. A complete stop of the amplification reaction in the bulk format avoids the requirement for real-time monitoring, enabling direct end-point readout for bulk format.
Table 1 Predicted and experimental NASBA results for combinations of genotypes and restriction endonuclease
NheI BsrBI ApoI BsrGI BseYI BstXI NruI
Predicted results
GT 1 ‒ ‒ + + + + ‒
GT 2
‒ + + + ‒ ‒ +
‒ + + + + + +
+ + + + ‒ ‒ +
+ + + + + + +
GT 3 + ‒ ‒ + ‒ +/‒* +/‒
GT 4
‒ ‒ + ‒ + + +/‒
‒ ‒ ‒ + + + +/‒
‒ ‒ ‒ ‒ + + +/‒
Experimental results
GT 1 ‒ ‒ + +
n.t.
GT 2 n.t.** + + +
GT 3 + ‒ ‒ +
GT 4 ‒ ‒ n.t. n.t.
* +/‒: NASBA reaction could be positive or negative. Information extracted from this combination does not contribute to genotyping.
** n.t.: not tested
CHAPTER 7
CONCLUDING OVERVIEW
In the work presented here, microfluidics has been used as an important tool to study reactions at the single-molecule level. It does not only provide an alternative approach for quantification via compartmentalization, but also has the capability to decouple different stages and facets of one reaction, which facilitates the study of reaction mechanisms. This is usually difficult for or beyond the capability of other technologies.
Microfluidics provides possibilities for performing molecular diagnosis in limited-resource settings. The confinement of single molecules converts analog signals to digital signals. Such conversion allows the readout to be carried out only at the endpoint of the reaction, rather than real-time monitoring of the entire reaction progress16. Furthermore, by confining molecules into different volumes in the same assay and incorporating mathematical considerations, the dynamic range can be enlarged to satisfy the requirements of viral load quantification32. In addition, isothermal amplification chemistry could be employed to eliminate the requirement of thermal cycling35. All the advances discussed above enable SlipChip microfluidics devices to be used in limited-resource settings for the detection and quantification in diagnostic assays.
understanding of whether the presence of any perturbation changes the “fate” or “rate” of a reaction.
The understanding of reaction mechanisms at the single-entity level enabled by microfluidics aids the design and development of new assays to solve real-world problems, which has been demonstrated with applications in HIV and HCV viral load quantification and HCV genotyping. It can also potentially address problems not currently solvable by existing technologies: for example, the co-incidence detection of multiple biomarkers, studying the heterogeneity of cells, bacteria, organisms and molecules, and so forth.
References
1. Peeling, R. W.; Smith, P. G.; Bossuyt, P. M. M., A guide for diagnostic evaluations. Nat. Rev.Microbiol. 2010,8 (12 Suppl), S2-6.
2. Yager, P.; Domingo, G. J.; Gerdes, J., Point-of-care diagnostics for global health. Annu. Rev. Biomed. Eng. 2008,10, 107-144.
3. Mabey, D.; Peeling, R. W.; Ustianowski, A.; Perkins, M. D., Diagnostics for the developing world. Nat. Rev. Microbiol. 2004,2 (3), 231-240.
4. Gubala, V.; Harris, L. F.; Ricco, A. J.; Tan, M. X.; Williams, D. E., Point of Care Diagnostics: Status and Future. Anal. Chem. 2012,84 (2), 487-515.
5. Karim, O.; Rao, A.; Emberton, M.; Cochrane, D.; Partridge, M.; Edwards, P.; Walker, I.; Davidson, I., Point-of-care PSA testing: An evaluation of PSAwatch. Prostate Cancer Prostatic Dis. 2007,10 (3), 270-273.
6. www.cepheid.com, www.idahotech.com, www.twistdx.co.uk
7. (a) Toner, M.; Irimia, D., Blood-on-a-chip. Annu. Rev. Biomed. Eng. 2005,7, 77-103; (b) Chin, C. D.; Linder, V.; Sia, S. K., Lab-on-a-chip devices for global health: Past studies and future opportunities. Lab Chip 2007,7 (1), 41-57.
8. Ismagilov, R. F., Witters,D., Sun, B., Begolo, S., Rodríguez-Manzano, J., Robles, W., Digital Biology and Chemistry. Lab Chip 2014, accepted.
9. Edd, J. F.; Di Carlo, D.; Humphry, K. J.; Koster, S.; Irimia, D.; Weitz, D. A.; Toner, M., Controlled encapsulation of single-cells into monodisperse picolitre drops. Lab Chip 2008,8 (8), 1262-1264.
10. Hong, J. W.; Studer, V.; Hang, G.; Anderson, W. F.; Quake, S. R., A nanoliter-scale nucleic acid processor with parallel architecture. Nat. Biotechnol. 2004,22 (4), 435-439.
11. Rissin, D. M.; Kan, C. W.; Campbell, T. G.; Howes, S. C.; Fournier, D. R.; Song, L.; Piech, T.; Patel, P. P.; Chang, L.; Rivnak, A. J.; Ferrell, E. P.; Randall, J. D.; Provuncher, G. K.; Walt, D. R.; Duffy, D. C., Single-molecule enzyme-linked immunosorbent assay detects serum proteins at subfemtomolar concentrations. Nat. Biotechnol. 2010,28 (6), 595-599.
12. Wheeler, A. R.; Throndset, W. R.; Whelan, R. J.; Leach, A. M.; Zare, R. N.; Liao, Y. H.; Farrell, K.; Manger, I. D.; Daridon, A., Microfluidic device for single-cell analysis. Anal. Chem.
2003,75 (14), 3581-3586.
14. Li, L.; Du, W.; Ismagilov, R. F., Multiparameter Screening on SlipChip Used for Nanoliter Protein Crystallization Combining Free Interface Diffusion and Microbatch Methods. J. Am. Chem. Soc. 2010,132 (1), 112-119.
15. Liu, W.; Chen, D.; Du, W.; Nichols, K. P.; Ismagilov, R. F., Slip Chip for Immunoassays in Nanoliter Volumes. Anal. Chem. 2010,82 (8), 3276-3282.
16. Shen, F.; Du, W.; Kreutz, J. E.; Fok, A.; Ismagilov, R. F., Digital PCR on a SlipChip. Lab Chip 2010,10 (20), 2666-2672.
17. (a) Cheng, C.-M.; Martinez, A. W.; Gong, J.; Mace, C. R.; Phillips, S. T.; Carrilho, E.; Mirica, K. A.; Whitesides, G. M., Paper-Based ELISA. Angew. Chem., Int. Ed. 2010, 49 (28), 4771-4774; (b) Fang, X.; Liu, Y.; Kong, J.; Jiang, X., Loop-Mediated Isothermal Amplification Integrated on Microfluidic Chips for Point-of-Care Quantitative Detection of Pathogens. Anal. Chem. 2010,82 (7), 3002-3006.
18. Huynh, T.; Sun, B.; Li, L.; Nichols, K. P.; Koyner, J. L.; Ismagilov, R. F., Chemical Analog-to-Digital Signal Conversion Based on Robust Threshold Chemistry and Its Evaluation in the Context of Microfluidics-Based Quantitative Assays. J. Am. Chem. Soc. 2013, 135 (39), 14775-14783.
19. Dharnidharka, V. R.; Kwon, C.; Stevens, G., Serum cystatin C is superior to serum creatinine as a marker of kidney function: a meta-analysis. Am. J. Kidney. Dis. 2002,40 (2), 221-6.
20. Shlipak, M. G.; Matsushita, K.; Ärnlöv, J.; Inker, L. A.; Katz, R.; Polkinghorne, K. R.; Rothenbacher, D.; Sarnak, M. J.; Astor, B. C.; Coresh, J.; Levey, A. S.; Gansevoort, R. T., Cystatin C versus Creatinine in Determining Risk Based on Kidney Function. N. Engl. J. Med.
2013,369 (10), 932-943.
21. Spahillari, A.; Parikh, C. R.; Sint, K.; Koyner, J. L.; Patel, U. D.; Edelstein, C. L.; Passik, C. S.; Thiessen-Philbrook, H.; Swaminathan, M.; Shlipak, M. G., Serum Cystatin C– Versus Creatinine-Based Definitions of Acute Kidney Injury Following Cardiac Surgery: A Prospective Cohort Study. Am. J. Kidney. Dis. 2012,60 (6), 922-929.
22. Ferguson, M. C., Current therapies for chronic hepatitis C. Pharmacotherapy 2011, 31 (1), 92-111.
23. Kreutz, J. E.; Munson, T.; Huynh, T.; Shen, F.; Du, W.; Ismagilov, R. F., Theoretical Design and Analysis of Multivolume Digital Assays with Wide Dynamic Range Validated Experimentally with Microfluidic Digital PCR. Anal. Chem. 2011,83 (21), 8158-8168.
25. Beer, N. R.; Hindson, B. J.; Wheeler, E. K.; Hall, S. B.; Rose, K. A.; Kennedy, I. M.; Colston, B. W., On-chip, real-time, single-copy polymerase chain reaction in picoliter droplets. Anal. Chem. 2007,79 (22), 8471-5.
26. Analytical Chemistry (Washington, D., United States)Sundberg, Scott O.; Wittwer, C. T.; Gao, C.; Gale, B. K., Spinning Disk Platform for Microfluidic Digital Polymerase Chain Reaction. Anal. Chem. 2010,82 (4), 1546-1550.
27. http://www.lifetechnologies.com/us/en/home/life-science/pcr/real-time-pcr/real-time-openarray.html
28. Shen, F.; Sun, B.; Kreutz, J. E.; Davydova, E. K.; Du, W.; Reddy, P. L.; Joseph, L. J.; Ismagilov, R. F., Multiplexed Quantification of Nucleic Acids with Large Dynamic Range Using Multivolume Digital RT-PCR on a Rotational SlipChip Tested with HIV and Hepatitis C Viral Load. J. Am. Chem. Soc. 2011,133 (44), 17705-17712.
29. Pawlotsky, J. M., Use and interpretation of virological tests for hepatitis C. Hepatology
2002,36 (5), S65-S73.
30. Curtis, K. A.; Rudolph, D. L.; Nejad, I.; Singleton, J.; Beddoe, A.; Weigl, B.; LaBarre, P.; Owen, S. M., Isothermal Amplification Using a Chemical Heating Device for Point-of-Care Detection of HIV-1. PLoS One 2012,7 (2), e31432.
31. Compton, J., NUCLEIC-ACID SEQUENCE-BASED AMPLIFICATION. Nature 1991, 350 (6313), 91-92.
32. Wharam, S. D.; Marsh, P.; Lloyd, J. S.; Ray, T. D.; Mock, G. A.; Assenberg, R.; McPhee, J. E.; Brown, P.; Weston, A.; Cardy, D. L. N., Specific detection of DNA and RNA targets using a novel isothermal nucleic acid amplification assay based on the formation of a three-way junction structure. Nucleic Acids Res. 2001,29 (11), e54.
33. Vincent, M.; Xu, Y.; Kong, H. M., Helicase-dependent isothermal DNA amplification. EMBO Rep. 2004,5 (8), 795-800.
34. Notomi, T.; Okayama, H.; Masubuchi, H.; Yonekawa, T.; Watanabe, K.; Amino, N.; Hase, T., Loop-mediated isothermal amplification of DNA. Nucleic Acids Res. 2000,28 (12), e63. 35. Piepenburg, O.; Williams, C. H.; Stemple, D. L.; Armes, N. A., DNA detection using recombination proteins. PLoS Biol. 2006,4 (7), 1115-1121.
36. Fire, A.; Xu, S. Q., Rolling replication of short DNA circles. Proc. Natl. Acad. Sci. U. S. A. 1995,92 (10), 4641-4645.
38. Van Ness, J.; Van Ness, L. K.; Galas, D. J., Isothermal reactions for the amplification of oligonucleotides. Proc. Natl. Acad. Sci. U. S. A. 2003,100 (8), 4504-4509.
39. Ménová, P.; Raindlová, V.; Hocek, M., Scope and Limitations of the Nicking Enzyme Amplification Reaction for the Synthesis of Base-Modified Oligonucleotides and Primers for PCR. Bioconjugate Chem. 2013, 24 (6), 1081-1093..
40. Seelig, G.; Soloveichik, D.; Zhang, D. Y.; Winfree, E., Enzyme-free nucleic acid logic circuits. Science 2006,314 (5805), 1585-1588.
41. (a) Selck, D. A.; Karymov, M. A.; Sun, B.; Ismagilov, R. F., Increased Robustness of Single-Molecule Counting with Microfluidics, Digital Isothermal Amplification, and a Mobile Phone versus Real-Time Kinetic Measurements. Anal. Chem. 2013, 85 (22), 11129-11136; (b) Goto, M.; Honda, E.; Ogura, A.; Nomoto, A.; Hanaki, K.-I., Colorimetric detection of loop-mediated isothermal amplification reaction by using hydroxy naphthol blue. Biotechniques 2009, 46 (3), 167-172.
42. Sun, B.; Shen, F.; McCalla, S. E.; Kreutz, J. E.; Karymov, M. A.; Ismagilov, R. F., Mechanistic Evaluation of the Pros and Cons of Digital RT-LAMP for HIV-1 Viral Load Quantification on a Microfluidic Device and Improved Efficiency via a Two-Step Digital Protocol. Anal. Chem. 2013,85 (3), 1540-1546.
43. Gansen, A.; Herrick, A. M.; Dimov, I. K.; Lee, L. P.; Chiu, D. T., Digital LAMP in a sample self-digitization (SD) chip. Lab Chip 2012,12 (12), 2247-2254.
44. Curtis, K. A.; Rudolph, D. L.; Owen, S. M., Rapid detection of HIV-1 by reverse-transcription, loop-mediated isothermal amplification (RT-LAMP). J. Virol. Methods 2008,151 (2), 264-270.
45. Ghany, M. G.; Strader, D. B.; Thomas, D. L.; Seeff, L. B., Diagnosis, Management, and Treatment of Hepatitis C: An Update. Hepatology 2009,49 (4), 1335-1374.
46. Hnatyszyn, H. J., Chronic hepatitis C and genotyping: the clinical significance of determining HCV genotypes. Antivir. Ther. 2005,10 (1), 1-11.
47. Hsu, C.-S., Sofosbuvir for Previously Untreated Chronic Hepatitis C Infection. N. Engl. J. Med. 2013,369 (7), 678-678.
APPENDIX A
Authorship contribution statement and experimental section for Chapter 2
In the following publication18
Huynh, T.; Sun, B.; Li, L.; Nichols, K. P.; Koyner, J. L.; Ismagilov, R. F., Chemical Analog-to-Digital Signal Conversion Based on Robust Threshold Chemistry and Its Evaluation in the Context of Microfluidics-Based Quantitative Assays. J. Am. Chem. Soc. 2013, 135 (39), 14775-14783.
T.H. and R.F.I. designed the SlipChip experiments.
T.H. was the lead researcher for all figures (Figure 2 and Figure 3 in this dissertation) except for Figure 3 (Figure 4 in this dissertation).
B.S. performed the experiments for Figure 3 (Figure 4 in this dissertation) and helped with FEP coating of the device.
L.L. helped on chip design with the washing channel
K.P.N helped with device surface coating.
J.L.K provided patient samples.
Experimental section (as described in the publication above)
Chemicals and materials
Phosphate buffer (PB) was a solution of sodium phosphate 0.1 M,