1
Development and simulation of sensor-based irrigation control strategies for 1
cotton using the VARIwise simulation framework 2
3
Alison C McCarthy1*, Nigel H Hancock2 and Steven R Raine3 4
5
* corresponding author 6
7
National Centre of Engineering in Agriculture 8
Faculty of Engineering and Surveying 9
University of Southern Queensland 10
West Street 11
Toowoomba, Queensland 4350 12
Australia 13
14 1
Telephone: 61 7 4631 2189 15
Email: [email protected] 16
Facsimile: 61 7 4631 1870 17
18 2
Telephone: 61 7 4631 2552 19
Email: [email protected] 20
Facsimile: 61 7 4631 1870 21
22 3
Telephone: 61 7 4631 1691 23
Email: [email protected] 24
2 26
Abstract 27
Feedback control systems offer opportunities to accommodate spatial and temporal 28
differences in crop water requirement and to improve the automated irrigation of field 29
crops via real-time data from in-field plant, soil-water and evaporation sensing. This 30
paper describes two sensor-based strategies applied to irrigation control, ‘Iterative 31
Learning Control’ (ILC) and custom-designed ‘Iterative Hill Climbing Control’ 32
(IHCC), implemented in the control simulation and evaluation framework 33
‘VARIwise’. Simulation of an irrigated cotton crop using soils and merged 1999-34
2004 weather data of SE Queensland, Australia, and represented by the performance 35
of the well-validated cotton growth and production model OZCOT, permitted the 36
relative performance of differing sensor data types and availability to be evaluated 37
(both as alternatives and in combination) in meeting the requirement to optimise 38
either crop yield or water use efficiency. These simulations indicated that ILC would 39
perform better at maintaining soil-water deficit, whilst IHCC would be better at 40
maximising crop yield when plant and soil sensors were utilised in combination. This 41
work demonstrates that the optimal choice of field sensor(s) and control strategy will 42
be a function of the irrigation objective and the spatial and temporal availability and 43
type of field measurements. 44
45
Research highlights 46
• Two site-specific sensor-based irrigation strategies were simulated in VARIwise 47
• Iterative Learning Control (ILC) produced highest yield with soil-water data input 48
• Iterative Hill Climbing Control (IHCC) performed best with soil-and-plant data 49
3
• Both sensor-based strategies were superior to the industry-standard strategy 51
52
Keywords 53
Variable-rate irrigation, centre pivot, lateral move, scheduling, automation, OZCOT 54
55
1. INTRODUCTION 56
Irrigation application and crop water use efficiencies can be improved by scheduling 57
the irrigation of crops using physical and agronomic principles (Evans 2006). The 58
irrigation management strategy determined using these principles may be 59
automatically implemented using a control system. Irrigation control strategies can 60
use historical or real-time quantitative measurements of the crop, weather and soil, 61
either singly or in combination, to automatically adjust the irrigation application. 62
63
Irrigation is traditionally applied uniformly over an entire field, although not all plants 64
in the field may require the same amount of water at any given time. In these cases, 65
differential irrigation application to meet the plant requirements at different positions 66
in the field may improve operational performance. However, as the plant response 67
and environmental conditions fluctuate throughout the season, control strategies 68
which accommodate temporal and spatial variability in the field and which locally 69
modify the control actions (irrigation amounts) need to be ‘adaptive’ (Smith et al. 70
2009; McCarthy et al. 2010). Site-specific irrigation is enabled for centre pivot and 71
lateral move irrigation machines through commercially available variable-rate 72
hardware (e.g. Design Feats, Zimmatic, Valley). These systems adjust the irrigation 73
application within the field by varying the speed of the machine and/or pulsing 74
4
head or Low-Energy Precision Application (LEPA) sock – differential application 76
may be achieved at the <1 m² scale. 77
78
The performance of an irrigation control system will be limited by: (i) the attributes 79
that are measured in the field; (ii) the spatial resolution of the sensor data for both 80
static sensors (e.g. soil-water probes) and on-the-go sensors (e.g. infrared 81
thermometers measuring foliage temperature); and (iii) the temporal resolution of 82
these data inputs. However the performance delivered by the control system may also 83
be affected by unexpected environmental conditions (e.g. mid-irrigation and spatially-84
varied rainfall) or exceptional operational changes (e.g. crop damage or a capacity 85
constraint of the irrigation machine such that it cannot deliver the optimal irrigation 86
volumes in time). It may be expected that adaptive irrigation control systems have 87
differing robustness to these operating conditions, data availability and system 88
constraints (Warwick 1993). 89
90
In principle at least, adaptive control systems automatically and continuously re-adjust 91
the controller to obtain the desired performance of the system (Warwick 1993). Their 92
application to irrigation can potentially improve crop development and/or water use 93
efficiency. In addition, adaptive control strategies may be used to accommodate the 94
differing levels of data quality and availability normally found in irrigation practice, 95
i.e. utilise the various combinations of weather, soil and plant data available 96
(McCarthy et al. 2011a). Potentially optimal adaptive control strategies that 97
determine irrigation volume and timing may be identified by simulating alternate 98
adaptive control strategies in a simulation framework. 99
5
The objective of this paper is to determine the potential efficacy of ‘sensor-based’ 101
adaptive control (as introduced in section 3 below) for the practical irrigation of 102
cotton. A companion paper, McCarthy et al. (2013), reports the implementation and 103
performance of model-based adaptive control strategies: refer section 3 below. 104
105
2. CONTROL SIMULATION FRAMEWORK ‘VARIwise’ 106
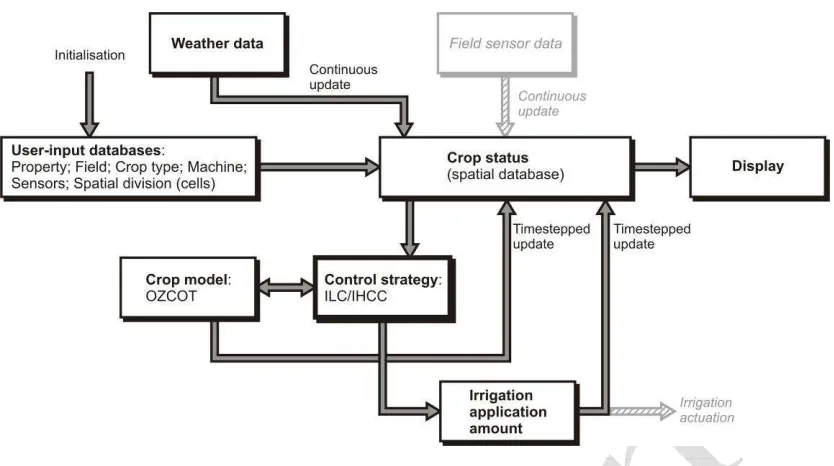
A simulation framework ‘VARIwise’ was created to develop, simulate, evaluate and 107
also implement (as a machine controller) uniform and site-specific irrigation control 108
strategies for centre pivot and lateral move irrigation machines. Full details are 109
presented in McCarthy et al. (2010): a simplified schematic is presented in Figure 1. 110
111
Insert Figure 1 here 112
113
Within VARIwise, the field is divided into cells of minimum area 1 m2 to 114
accommodate spatial variability. The software allows for: 115
• the inclusion of field-scale variations in input parameters (e.g. crop response, crop 116
age, target yield and management constraints); 117
• the input of data at a range of temporal scales; 118
• the ability to apply the various levels of control strategies for variable-rate 119
irrigation at different spatial scales; and 120
• requires a crop model integrated within VARIwise. In the simulation mode this 121
model provides feedback data which permit evaluation of any control strategy 122
implemented. 123
6
The well-established cotton growth model OZCOT (Wells and Hearn 1992) has been 125
utilised by VARIwise for the present study. The OZCOT model combines a 126
temperature-driven model of fruit dynamics with a soil-water balance model, and 127
original sub-models for: fruiting, leaf area generating, boll growth and elementary 128
nitrogen (Wells and Hearn 1992). The model was developed and validated for 129
different soil types from agronomic experiments over a period of 30 years covering a 130
range of Australian cotton growing regions (Hearn 1994). OZCOT’s capacity to 131
simulate yield, fruiting dynamics, nitrogen uptake and water use has been validated in 132
the Ord Valley, Western Australia, for summer grown cotton during the 1960s and 133
70s (Hearn 1994). The model responds to different climatic situations, crop 134
physiological characteristics, agronomic variables and management decisions, but 135
does not account for the effects of insect pests, diseases, weeds and soil nutrient 136
limitations other than nitrogen. The model does not simulate the effects of climate 137
and management on fibre quality. The OZCOT model requires the parameters listed 138
in Table 1 to be written into input files. After the OZCOT model has been executed, 139
an output file is produced that contains estimates of the soil-water, fruit load and 140
vegetation indices for each day of the predicted cotton season. 141
142
Insert Table 1 here 143
144
3. ADAPTIVE CONTROL STRATEGIES 145
Adaptive control strategies applicable to irrigation may be either: (i) ‘sensor-based’, 146
for which the (simulated) irrigation application is directly adjusted according to the 147
measurement response; or (ii) ‘model-based’, which use a calibrated soil and plant 148
7
requirements and their use of the crop model. The focus of this paper is the relative 150
performance of two candidate sensor-based irrigation control strategies: as noted 151
above, a companion paper, McCarthy et al. (2013), reports the implementation and 152
performance of model-based strategies. 153
154
By definition, sensor-based strategies can be implemented with a range of input 155
variables chosen to provide feedback for control. This paper reports a simulation 156
study to determine the appropriate input variable/s for each control strategy; and 157
comment on the relative utility of each strategy. 158
159
Following a review of candidate adaptive control strategies (McCarthy et al. 2011b), 160
the two sensor-based adaptive control strategies implemented in VARIwise are 161
‘Iterative Learning Control’ (ILC) and ‘Iterative Hill Climbing Control’ (IHCC). The 162
two strategies are described below, and their implementation set out in the section 163
following. In summary, these strategies refine the estimate of each successive 164
irrigation volume applied by: 165
[ILC] – iteratively adjusting the irrigation volume applied in each cell of the field 166
using the incremental response, i.e. the OZCOT-determined plant growth arising 167
from the change in particular field sensor information which has resulted from the 168
previous water application, in each cell; or 169
[IHCC] – similarly adjusting the irrigation volumes, but based on multiple sensor 170
increment information, using a range of irrigation volumes applied within a group 171
of homogenous cells. 172
173
8
Iterative Learning Control (ILC) can be used to control repetitive processes, e.g. robot 175
arm manipulators, repetitive rotary systems, and factory batch processes, where the 176
process model is imperfectly known (Ahn et al. 2007). An irrigation system may be 177
interpreted as a repetitive process because the irrigation machine iteratively passes 178
over the field throughout the crop season; and, given the complexity of variable plant 179
growth, is certainly imperfectly described from the control perspective. Hence, in 180
principle, classical ILC can be used to improve the system performance by 181
eliminating the effects of any unknown but repeating disturbance (Korovessi and 182
Linninger 2006). Applied to irrigation, an unknown feature of the crop response 183
model that reoccurs as a consequence of irrigation may be regarded as a ‘repeating 184
disturbance’. 185
186
ILC requires that the process controlled by the strategy is reset to the same initial 187
conditions after each iteration (Korovessi and Linninger 2006). Again, applied to 188
irrigation, each iteration of ILC is an irrigation event, and the conditions may be 189
approximately reset by scheduling the irrigations after a set amount of crop water use. 190
191
The variables soil-water, leaf area index, square count or boll count may be used as 192
feedback to measure the system performance for a cotton irrigation control system 193
(‘squares’ are flower buds; and ‘bolls’ are the seed pods which contain the cotton 194
fibre of the cotton plant). For example, for soil-water-based ILC a controller may 195
target a particular soil-water deficit throughout the season (and the data may be used 196
to calibrate the model). However, to be valid for feedback control, these 197
measurements must be taken only after a suitable delay following irrigation to ensure 198
9 200
Moore and Chen (2006) demonstrated an ILC strategy for a centre pivot irrigation 201
machine to determine site-specific irrigation application volumes using soil-water as 202
the feedback variable. The strategy was evaluated in simulations using a soil model 203
with one dimensional flow. This soil model assumed constant crop water use 204
irrespective of the crop stage, crop conditions and the daily and sub-daily weather 205
dynamics. Hence, the model was reset to the same initial conditions after a fixed time 206
delay and irrigation events were scheduled at regular time intervals. 207
208
3.2 Iterative Hill Climbing Control 209
A drawback of the ILC strategy is the potentially inefficient system identification, and 210
particularly so when applied to irrigation which has a ‘learning increment’ of typically 211
several days. This is a result of only one irrigation volume being evaluated in each 212
cell during each irrigation event. As an alternative, adaptive spatially-varied 213
identification may be more rapidly achieved by utilising site-specific combinations of 214
plant, soil and weather data in different sub-areas of the field, i.e. using aggregates of 215
cells having similar properties. Likewise, adaptive system identification may be 216
incorporated into an irrigation control system to account for the slow speed of crop 217
dynamics and the low frequency of irrigation events. To meet these requirements and 218
circumvent these limitations, an alternative, multi-dimensional approach was 219
developed, as follows. 220
221
The technique is designated ‘Iterative Hill Climbing Control’ (IHCC), in which ‘hill 222
10
in the direction of steepest gradient (Russell and Norvig 1995). IHCC provides faster 224
optimisation than ILC alone because it permits the evaluation of both: 225
• a range of inputs to the system at each irrigation event (i.e. multi-dimensional 226
ILC); and 227
• a range of irrigation volumes on different cells in the field (within the particular 228
sub-area) at each irrigation event. 229
230
As noted, IHCC involves grouping cells with similar properties in the field and 231
applying different irrigation volumes to designated ‘test cells’ within each group of 232
cells. The responses of the test cells are compared to determine which irrigation 233
volume resulted in the response closest to the desired response. This enables the 234
control system to identify appropriate input options within a single irrigation event 235
without using a process model. 236
237
4. IMPLEMENTATION OF SENSOR-BASED CONTROL STRATEGIES IN 238
VARIwise 239
The ILC and IHCC strategies were implemented in VARIwise to calculate the optimal 240
irrigation application volumes for each cell. For the ILC strategy, the irrigation 241
volumes are determined from previous irrigation applications and measured 242
responses. For the IHCC strategy, the volumes to apply are determined by evaluating 243
the response to a range of irrigation volumes previously applied to test cells within 244
representative homogenous areas of the field. Homogenous areas within fields are 245
referred to as a management ‘zone’ in this paper and zone boundaries may be 246
determined using soil properties, crop or variety differences, topography or 247
11 249
The implementation of the control strategies within VARIwise involves six steps 250
described in the following sections. Of necessity, the procedures differ for the ILC 251
and IHCC strategies. In particular, the procedure for the calculation of irrigation 252
volumes is fundamentally different (sections 4.6 and 4.7, respectively). 253
254
4.1 Select control areas 255
The ILC and IHCC strategies require different spatial resolutions for irrigation 256
application. ILC can be used to determine irrigation applications to each individual 257
cell; however, for IHCC the field must be divided into a number of zones. 258
259
The identification of zones for the IHCC strategy can be undertaken automatically by 260
VARIwise using a measured field property (e.g. soil property). In this case, the 261
property data assigned to each cell in the field is sorted in ascending order and then 262
grouped into the user-specified number of evenly-sized zones. A small number of 263
cells (i.e. a group of ‘test cells’) are then selected in each zone to evaluate different 264
irrigation applications. The application of the various irrigation volumes to the test 265
cells results in differential soil-water and crop responses. Hence, test cell responses 266
are only indicative of the response in each zone for one irrigation event and the IHCC 267
strategy requires the selection of new test cells in each zone for each irrigation. In 268
VARIwise, this is achieved by a simple increment of the test cell number along with a 269
requirement that the replacement cell still lies within the same zone and has not 270
previously been used as a test cell. 271
272
12
The number of days until the first irrigation in each cell or zone is calculated by 274
dividing the plant available water capacity (PAWC) of the soil by the daily crop water 275
use or daily crop evapotranspiration (ETc). This procedure is described in McCarthy
276
et al. (2010). 277
278
4.3 Calculate first irrigation volume 279
For ILC and IHCC non-test cells, the first irrigation application volume is calculated 280
by aggregating the daily ETc since the crop was sown. The daily ETc is calculated as
281
evapotranspiration obtained from the weather data, i.e. via reference (potential) 282
evapotranspiration ETo, and the appropriate crop coefficient, Kc, as published for each
283
crop and growth stage, following the standard methodology of FAO 56, Allen et al. 284
(1998). 285
286
For IHCC test cells, the irrigation volume applied to each test cell is similarly 287
determined using the ETo since the crop was sown, but with a range of crop
288
coefficients imposed. These crop coefficients are offset from the zone crop 289
coefficient (which is the crop coefficient used to calculate the irrigation volumes 290
applied to the non-test cells). The crop coefficient offsets used are specified by the 291
user as a percentage of the zone crop coefficient; for example, using a zone crop 292
coefficient of Kc = 0.35, five test cells and an offset of 40%, the crop coefficients
293
would be 0.07, 0.21, 0.35, 0.49 and 0.63 for each test cell, respectively (i.e. multiples 294
of 40% on either side of the median crop coefficient, 0.35). 295
296
13
In the simulation environment the model output data are obtained for the cells and 298
days specified by the user. This enables the performance of the control strategy to be 299
evaluated with input data at different spatial and temporal resolutions. In a field 300
implementation, the currently-available datasets are kriged (i.e. spatially interpolated) 301
across the field to ascribe a value to each cell in the field. This is because sensor data 302
may be unavailable due to sensor failures or the installation of sensors being 303
impractical (large numbers of infield sensors are often obstructive to growers). 304
305
4.5 Determine day of next irrigation 306
The irrigation events are scheduled when the crop has reached a user-specified 307
cumulative crop water use since the previous irrigation event. The method of 308
calculating the crop water use depends on the datasets available, thus: 309
• If soil data input is used in the control strategy and update data are available, the 310
crop water use is determined using the change in soil-water since the previous 311
irrigation. 312
• If soil and weather data inputs are used in the control strategy but update soil data 313
are not available and update weather data are available, the cumulative crop water 314
use is determined as the sum of the daily crop evapotranspiration (calculated using 315
the weather data). 316
• If soil data input is used but update data are not available, plus weather data are 317
not available or not used, then the cumulative crop water use is calculated using 318
historically averaged weather data. 319
14
Since the crop water use may not be uniform across the field due to spatial variability, 321
the irrigations are initiated when an arbitrary proportional of the cells in the field have 322
reached the user-specified cumulative crop water use (e.g. 15%). 323
324
4.6 Calculate irrigation volumes – ILC 325
For ILC the irrigation volume applied to each cell in the field is calculated using a 326
common ILC algorithm (Ahn et al. 2007) which calculates the required system input 327
(the irrigation volume to be applied) uk+1 at the forthcoming iteration, i.e. the (k+1)-th
328
irrigation, according to: 329
330
uk+1 = uk + γ(yk(∆) – yd(∆)) (1)
331 332
where: 333
uk = the system input (irrigation volume) on the previous iteration
(k-th irrigation)
γ = the learning gain (a scalar factor)
yk(∆) = the measured system output (i.e. sensor data value, kriged as
necessary) after delay ∆; and
yd(∆) = the desired system output (i.e. desired sensor data value) after
delay ∆
in which the delay in measurement after each irrigation ∆ permits the crop to respond 334
to that irrigation (typically one day for the sensing of soil-water change; longer for the 335
sensing of a plant growth variable). In all cases the response delay ∆ must be less that 336
15
compromise between slow learning (low γ) and instability in the predicted uk+1 values
338
(high γ). 339
340
The ILC algorithm assumes that the refined input is adjusted in the same direction as 341
the difference between the measured and desired value for a positive learning gain and 342
that the refined input is adjusted in the opposite direction to the difference between 343
the measured and desired value for a negative learning gain. For example, when the 344
desired value is less than the measured value (and the difference is negative) and the 345
learning gain is positive, then the irrigation volume applied is less than the previous 346
irrigation volume. Hence, this algorithm may only be used for variables which either 347
always increase when the irrigation volume applied increases (e.g. soil-water) or 348
always decrease when the irrigation volume applied decreases (e.g. soil-water deficit). 349
An applicable plant variable may be leaf area index since vegetative growth typically 350
increases with increased water application and hence would require a positive learning 351
gain. A negative learning gain is used where soil-water is the controlled variable. In 352
this case, the soil-water variable is calculated by subtracting the desired deficit from 353
the full point (field capacity) of the soil. However, conversely for cotton, the square 354
and boll counts are not applicable for ILC as cotton reproductive growth is maximised 355
when the plant is under mild water stress (Gibb et al. 2004). 356
357
For each irrigation event and cell, the ILC algorithm of equation (1) calculates the 358
volume to apply at the next irrigation event using measured field data and the desired 359
value based on a single measured variable y. However, because more than one soil or 360
16
implemented to accommodate for multiple variables. In this case, optimisation may 362
be achieved by either one, or a combination, of the following (Liu et al. 2001): 363
364
i. assigning a weighting to each optimisation objective (variable yi) and
365
constructing a weighted sum of all the objectives, and/or 366
ii. optimising each objective separately to explore trade-offs 367
368
where the separate optimisation objectives are driven by difference between the 369
measured and desired variable values, yi,k and yi,d respectively.
370 371
The multi-objective optimisation option (i) requires subjective selection of the 372
weights for each objective; however the separate-objective option (ii) requires an 373
additional decision-making procedure to determine which objective optimisation 374
results in the desired performance for both objectives. The present VARIwise 375
implementation for sensor-based irrigation optimisation aims to evaluate the effect of 376
using multiple data inputs and the multi-objective optimisation option (i) was 377
presumed sufficient with each objective equally weighed. Hence, the multi-objective 378
ILC algorithm is: 379
380
uk+1 = uk + γ
∑
= n
i 1
(wi × (yi,k(∆) – yi,d(∆))) (2)
381
382
where n variables are used in the control strategy and wi is the weighting of the i-th
383
variable for the control strategy (and all weightings sum to unity). 384
385
17
A performance index (PI) is calculated for each test cell in each zone. In VARIwise, 387
the data used to determine the PI is specified by the user, and for a cotton crop 388
appropriate parameters are leaf area index (LAI) and ‘square count’ (‘squares’ are 389
flower buds on a cotton plant). The type of data specified affects how the PI is 390
calculated. To optimise cotton yield, the PI can be calculated as the ratio of the 391
current boll or square count to the maximum count of the test cells using: 392 393 ) ( ) ( t value Maximum t value Current
PI = (3)
394
For cotton, the LAI data should not simply be maximised as this would result in 395
excessive vegetative growth rather than reproductive growth. Hence, the PI for LAI 396
can be calculated and compared to the reported LAI for an optimal crop. For data that 397
correspond to an optimal time series data set, the performance index is: 398 399 ) ( ) ( ) ( t value Target t value t Curren t value Target
PI = − (4)
400
where t represents the day of the data collection. 401
402
Multiple data variables may be incorporated into the PI by applying weights to the 403
performance index of each data type and summing the weighted indices. For 404
example, if leaf area index and square count are used with respective weights of 0.2 405
and 0.8, the total PI would be: 406
407
PI = 0.2 × PLAI + 0.8 × Psquare/boll count (5)
18
The PI for each test cell can be evaluated to determine the crop coefficient to be used 410
for the ‘non-test’ cells in the next irrigation. The crop coefficient used for the next 411
irrigation corresponds to the maximum PI: this would be obtained by finding the 412
maximum point of a quadratic equation fitted through points plotted on a PI versus 413
crop coefficient graph. 414
415
Multiple data variables may be incorporated into the PI by applying weights (ki) to the
416
performance index of each data type (PIi) and summing the weighted indices (where
417
there are n data inputs). Hence, the general form for the PI calculation with multiple 418
data variables and weights is: 419
420
PI =
∑
= ni 1
ki PIi where
∑
= n
i 1
ki = 1 (6)
421
422
If the maximum point of the quadratic lies outside this range, then the crop coefficient 423
for the test cell with the highest PI is selected as the optimal crop coefficient. If all 424
the test cells have the same PI then the crop coefficient is estimated from Table 12 of 425
Allen et al. (1998). 426
427
After the crop has consumed a user-defined cumulative crop water use, the non-test 428
cells are then irrigated with an amount calculated using the aggregated ETo and the
429
optimal crop coefficient. The volumes applied to the new test cells are calculated 430
using the user-defined offset percentage applied to the optimal crop coefficient 431
identified for the previous irrigation. 432
433
19
For centre pivot and lateral move machines, the machine capacity and application 435
volumes affect the time taken to traverse the field, and hence the timing of irrigation 436
applications to each cell. To minimise the impact of travel time, the irrigation 437
application to individual cells is limited to an arbitrary maximum volume (e.g. 25 438
mm) and the amount of water applied to individual cells is adjusted by the travel time 439
and the daily crop water use. 440
441
5. CASE STUDY – EVALUATION OF SENSOR-BASED CONTROL 442
STRATEGIES WITH COTTON 443
This section reports a case study using VARIwise to compare the performance of the 444
ILC and IHCC strategies when different field sensor data (e.g. soil, plant and weather) 445
were available, both singly or in combination. These strategies were also compared 446
with the yield and water use performance produced for the equivalent crop irrigated 447
according to an industry-standard irrigation management strategy. 448
449
5.1 Simulated crop, growing conditions and crop model 450
The case study involved simulations of a whole season cotton crop grown on the 451
Darling Downs, Australia with parameters as outlined in Table 1. The sowing data, 452
soil properties and weather pattern was characteristic of cotton growing regions in 453
Australia. The soil and plant parameters of the cotton model OZCOT were kept 454
within the boundary values defined by Wells and Hearn (1992). 455
456
The spatial variability in soil parameters in each cell and the zones applied for the 457
IHCC strategy are shown in Figure 2. In the simulated field, the plant available water 458
20
strategies could deal with the different soil types that often exist within fields. The 460
spatial variability in PAWC across irrigated broadacre fields in Australia can be 30 to 461
500% (Wong et al. 2006; Rab et al. 2009) because of differences in soil texture and 462
root distribution. 463
464
Insert Figure 2 here 465
466
Averaged weather input was used when sensed weather data was not an input. This 467
provided the model with the minimum set of weather information that could be 468
generated which would enable the model to operate. The averaged weather dataset 469
was generated using SILO (QNRM 2009) climate datasets for the cropping period in 470
the previous five years and calculating the daily average maximum and minimum 471
temperature, solar radiation and rainfall such that each day in the season had the same 472
weather conditions. 473
474
A daily weather profile was obtained for the GPS location -28.18°N 151.26°E from an 475
Australian Bureau of Meteorology SILO dataset (QNRM 2009) for 2004/2005. The 476
weather profile is relatively hot and wet, late in the crop season. The weather profile 477
(Figure 3) was used as the weather data input for simulations that include weather in 478
the input data combination, whilst the same weather profile (Figure 3) was averaged 479
daily and used as the weather data input for simulations without weather in the input 480
data combination. 481
482
Insert Figure 3 here 483
21
5.2 Determination of the industry-standard (baseline) irrigation schedule 485
An industry-standard irrigation management strategy was implemented as a baseline 486
for the performance of the adaptive control strategies. This strategy applied a uniform 487
irrigation treatment across the field where irrigation events were initiated when the 488
soil-water deficit reached a set amount in one point in the field. The soil-water deficit 489
was taken in the cell with the lowest plant available water capacity, as this is the most 490
limiting soil (Figure 2(a)). In this simulation, 25 mm was applied to the whole field 491
when the soil-water deficit had reached 30 mm in the cell with sandy soil. 492
493
5.3 Adaptive control implementation 494
The robustness of the irrigation control strategy to sensed data availability was 495
evaluated by simulating the strategies using different combinations of data input 496
(McCarthy et al. 2011a). This indicated the control inputs that are most appropriate to 497
each control strategy. The simulations used the same underlying crop model but 498
different combinations of input variables for control. For example, the simulation 499
evaluating the importance of sensed soil data to the ILC strategy involves adjusting 500
the irrigation volume according to the error between the desired soil-water and the 501
measured soil-water after each irrigation event. 502
503
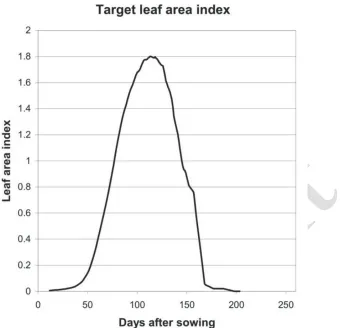
An optimal time series dataset is required for each input variable to compare with the 504
measured output and calculate the next irrigation volume uk+1. The leaf area index
505
(LAI) for an optimal cotton crop is shown in Figure 4. The dataset was obtained from 506
OZCOT for a high yielding simulation and the curve was smoothed using exponential 507
22
irrigated field was automatically divided into 1266 cells of area 100 m² (with cell 509
dimensions of 10 m wide and 10 m long). 510
511
Insert Figure 4 here 512
513
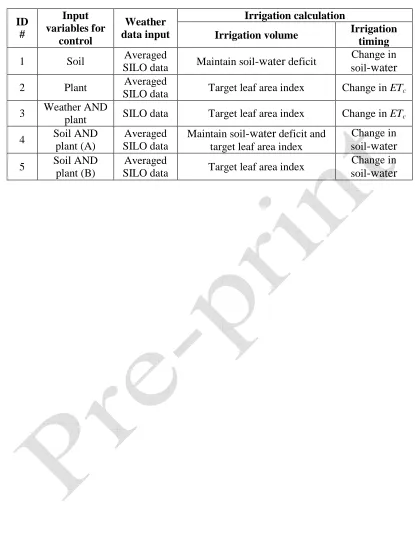
5.3.1 Methodology – ILC 514
The ILC strategy was simulated using the five applicable input data combinations 515
(Table 2). For the simulations with two input data variables, the weightings on each 516
variable were chosen to be 0.5. Irrigations were initiated when 15% of the cells had 517
reached a 40 mm soil-water deficit. The simulations using soil data input adjusted the 518
irrigation volume to achieve a deficit of 10% of the plant available water capacity in 519
each cell following each irrigation event. The data for feedback in the control strategy 520
were obtained from the OZCOT model on different days depending on the data type: 521
the soil dataset was obtained one day after the previous irrigation event, whilst the 522
plant dataset was obtained one day prior to next scheduled irrigation event. 523
524
Insert Table 2 here 525
526
Simulations for ILC were conducted in VARIwise using the agronomic factors in 527
Table 1 and the underlying soil variability in Figure 2(a). The desired LAI time series 528
set of Figure 4 was used. This cell size was selected to enable timely execution of the 529
simulations and accommodate substantial in-field spatial variability of soil properties. 530
The following values were used for the ILC parameters defined in Section 4.6: 531
• the learning gain (γ) was unity; 532
23
• the time delay (∆) between the irrigation event and the parameter measurement 534
depended on the data input. 535
536
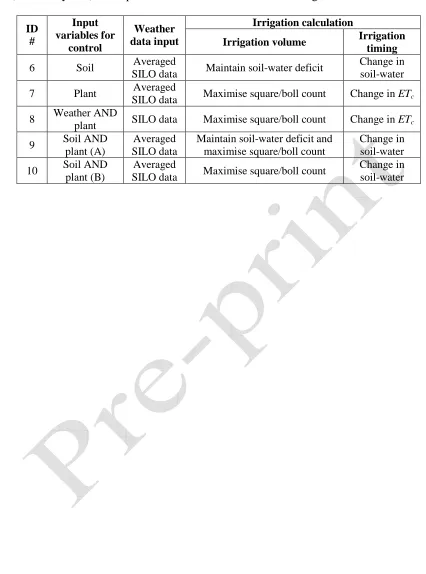
5.3.2 Methodology – IHCC 537
Using weather, soil and plant input data, there are six possible combinations of data 538
input for IHCC (Table 3). As with ILC, weather-only input is not applicable for 539
control as the weather data does not provide a measure of the crop response. For the 540
simulations with two input variables, the weighting on each variable was set to be 0.5. 541
The simulations using plant data to determine the irrigation application used square 542
count as the input variable for control. This is because squares form earlier in the 543
crop season than bolls (and can be controlled earlier in the crop season). Square count 544
was used instead of leaf area index to maximise the reproductive growth of the cotton 545
plant (which should maximise the final yield) rather than manage the vegetative 546
growth. The strategies with soil data input aimed to maintain a soil-water deficit 547
equal to 10% of the plant available water capacity in each cell following each 548
irrigation event. 549
550
Insert Table 3 here 551
552
For IHCC strategies there must be sufficient cells in the field for the test cells to be 553
replaced after each irrigation event in the crop season. For example, a field with three 554
zones and five test cells requires 15 test cells for each irrigation event. Because these 555
test cells must be replaced with new test cells after every irrigation event, a minimum 556
24
was automatically divided into three zones (Figure 2(b)) and five test cells were used 558
in each zone. 559
560
The underlying soil variability of Figure 2(a) was implemented. The feedback data 561
were obtained from the OZCOT model one day after the previous irrigation event for 562
soil responses and one day before the next scheduled irrigation event for plant 563
responses. 564
565
5.4 Performance of control strategies 566
567
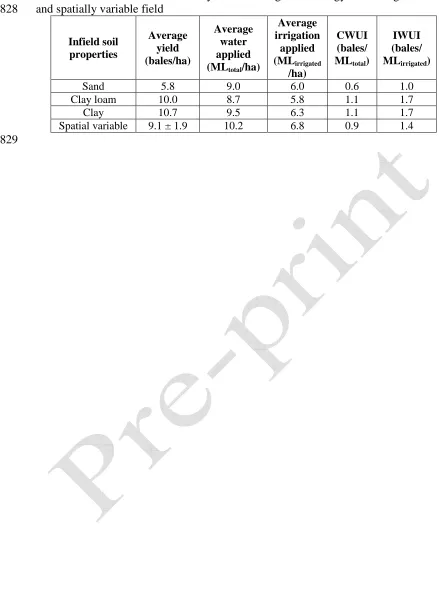
5.4.1 Performance using an industry-standard irrigation management strategy 568
An industry-standard irrigation schedule was implemented with field properties as per 569
Table 1 and involved applying 25 mm between 14 October 2004 and 14 March 2005 570
when the soil-water deficit in a sandy cell reached 30 mm. The final yield was 9.1 ± 571
1.9 bales/ha with CWUI of 0.9 bales/MLtotal (total water in ML) and IWUI of 1.4 572
bales/MLirrigated (irrigation applied in ML) (Figure 5). IWUI is the ratio of the crop 573
yield (e.g. bales of cotton) to the irrigation water applied (ML), whilst CWUI is the 574
ratio of crop yield (e.g. bales) to the total water used by the crop (ML) (BPA 1999). 575
The total volume of water applied to the crop (including rainfall) was 10.2 ML/ha, 576
whilst the irrigation applied to the crop was 6.8 ML/ha. Variations reported in the 577
average yield values are standard deviations of yield across the field (Figures 5 and 6). 578
The applied water and yields produced by the simulations are consistent with local 579
typical experience. 580
581
25 583
5.4.2 Performance using ILC 584
Figure 6 sets out the simulated outputs of the ILC strategies using the data input 585
combinations described in Table 3. The simulated irrigation applied, soil-water and 586
leaf area index in the sand, clay loam and clay cells are compared for the strategies 587
with plant-only input (simulation #1) and soil-only input (simulation #2) (Figure 7(a) 588
and 7(b)). The ILC strategy produced the highest yield and water use efficiency with 589
soil-water input (simulation #1). 590
591
Insert Figure 6 here 592
Insert Figure 7 here 593
594
ILC produced lower yields with leaf area index input (simulations #2, #3 and #5) than 595
with soil-water input (Figure 6). The irrigation volumes applied were higher 596
throughout the crop season for ILC targeting leaf area index than soil-water deficit 597
(Figure 7). This indicates that the leaf area index is not proportionally related to 598
irrigation application and that the leaf area index input is not effective to determine 599
the crop water requirements for this crop. The leaf area index measurement also may 600
not have detected whether the plant was actively transpiring or stressed. The 601
irrigation volumes applied using leaf area index also exceeded the soil-water deficit 602
(Figure 8(b)); hence, ILC with leaf area index input could not adapt to the difference 603
in soil-water for different soils. The leaf area index was also generally lower for ILC 604
targeting leaf area index than ILC maintaining soil-water deficit (Figure 9). This 605
suggests that leaf area index is a less effective indicator of irrigation requirement than 606
26
(simulation #4) also reduced the simulated yield and water use efficiency (compared 608
with simulation #1). 609
610
There were differences between the simulated and desired soil-water deficit for the 611
strategy targeting soil-water deficit (#simulation 1, Figure 8(a)). These were likely 612
caused by the plant physiological response varying to each irrigation event during the 613
crop season, while the ILC relies on process repetition to refine the irrigation volume 614
and assumes that the crop conditions essentially ‘reset’ before the next irrigation 615
event. 616
617
Insert Figure 8 here 618
Insert Figure 9 here 619
620
5.4.3 Performance using IHCC 621
The simulations described in Table 3 produced the yields and water use efficiencies in 622
Figure 10. IHCC produced reasonable yields and water use efficiencies for all data 623
input combinations. The highest yield was simulated using the soil-and-plant input 624
(simulation #9), whilst the lowest yields were simulated using plant-only input 625
(simulation #7) and weather-and-plant input (simulation #8). The IHCC strategy that 626
maximised square/boll count (simulation #9) resulted in a higher maximum square 627
count than the strategy that attempted to maintain a fixed soil-water deficit 628
(simulation #6) (Figure 9). The simulations using plant input in combinations with 629
weather or soil data (simulations #8-10) produced higher yields than those only using 630
only soil data input (simulations #6). This suggests that square count indicated the 631
27
targeted a soil-water deficit and maximised square/boll count (simulation #9) 633
performed better than simulations that maximised square/boll count (simulation #10). 634
This is because the first squares form approximately 60 days after sowing, and the 635
strategy requires soil-water indicate crop water requirement during this early stage. 636
637
Insert Figure 10 here 638
Insert Figure 11 here 639
640
IHCC with soil-and-plant input (simulation #9) applied less irrigation water than that 641
with plant-only (simulation #7). This is because the fruit load input does not 642
accurately identify the irrigation timing or volume of water to be applied and tends to 643
over-irrigate during wet periods of the crop season (eg. 63 to 86 days after sowing, 644
Figure 11). Including the soil data improves the accuracy of the application volume 645
determination and hence, the efficiency of water application was higher using soil 646
data in combination with the plant data. 647
648
The spatial variability observed in the simulated yield (Figure 10) was higher when a 649
single sensor input (simulations #6 and #7) was used compared to a multi-sensor 650
combinations. Spatial variability in yield was caused by both differences in the soil 651
properties and the ‘test’ irrigation volumes being applied to various cells across the 652
field. The irrigation volumes applied to the clay loam and clay cells were generally 653
larger than those applied to the sand cells (Figure 11). The higher soil-water storage 654
capacity on these soils was found to produce larger crops which then resulted in larger 655
irrigation deficits at irrigation. It was also noted that the soil-water deficit at irrigation 656
28
10 mm and 19 mm, respectively) using weather-and-soil input (Figure 11(a)) than 658
using weather-and-plant input (Figure 11(b)). 659
660
Deviations from the desired soil-water deficit were also caused by the test cells not 661
being representative of all the cells in the zone, causing the ‘best’ response of the test 662
cells to be inaccurate and the irrigation application of the whole zone to be 663
inappropriate. It follows that the square count may not be maximised in each cell of 664
the field because of the differences in properties of the test cells and non-test cells. 665
Deviations may also have been caused by test cells being inappropriately chosen at 666
the border between zones where the zone division is jagged and therefore less certain. 667
Hence, the location of the test cells is important for the irrigation optimisation. 668
669
6. DISCUSSION 670
The Iterative Learning Control strategy generally produced higher crop water use 671
efficiency performance indices than the Iterative Hill Climbing Control strategy. The 672
highest crop and irrigation water use efficiencies were achieved using ILC with soil-673
water data (simulation #1), whilst the highest irrigation water use efficiency using 674
IHCC was achieved when soil-and-plant data (simulation #9) was used. Similar 675
yields were obtained for the IHCC strategy with soil-and-plant input (simulation #9, 676
12.4 ± 1.6 bales/ha) and the ILC strategy with soil-only input (simulation #1, 12.2 ± 677
1.5 bales/ha). 678
679
ILC adjusted the irrigation volume to achieve the desired soil-water deficit following 680
the irrigation event for the different soil types in the field. The IHCC strategy was 681
29
8). With soil-only input, IHCC produced an average yield and crop water use 683
efficiency (simulation #6, 11.2 ± 1.8 bales/ha and 1.0 bales/MLtotal, respectively) 684
lower than those of the ILC strategy with soil-input (simulation #1). 685
686
The IHCC strategy can optimise parameters (e.g. through maximising square/boll 687
counts) and targeting temporally-variable soil/crop responses, whilst the ILC strategy 688
can only target temporally-variable soil/crop responses (e.g. soil-water deficit). 689
Hence, leaf area index was selected for ILC and fruit load was selected for IHCC. 690
ILC performed poorly with plant data (i.e. leaf area index) input. This suggests that 691
IHCC may be more appropriate for weather-and-plant data input, whilst ILC may be 692
preferable with soil-input only. However, the case study indicates that leaf area index 693
input was not appropriate for ILC because of its lack of sensitivity to irrigation 694
volume application. For the ILC strategy, there was no benefit in using multiple 695
combinations of soil, plant or weather data. 696
697
The irrigation refinement was most effective during dry periods of the season as 698
rainfall was a (non-repeating) disturbance in the control system. However, ILC 699
adapted rapidly to the new system state in dry periods following the rainfall. 700
701
7. CONCLUSION 702
Two sensor-based irrigation control strategies, ‘Iterative Learning Control’ (ILC) and 703
custom-designed ‘Iterative Hill Climbing Control’ (IHCC) were simulated in the 704
software VARIwise for a cotton crop ‘grown’ with the soils and merged 2004-2009 705
weather data of south-east Queensland, Australia, and represented by the performance 706
30
used the crop water use to determine irrigation timing and soil and/or crop response to 708
determine irrigation application volume. The simulations indicated that there was no 709
significant difference between the highest yield achieved by the ILC strategy using 710
soil-water data and the IHCC strategy using soil and plant sensor data. Both strategies 711
produced higher simulated yields and water use efficiencies than an industry-standard 712
irrigation management strategy. 713
714
The optimal sensor combination and control strategy that should be used in the field 715
will depend on the crop and water availability. Where sensor data availability is non-716
limiting then the simulated IHCC strategy using plant and soil sensors produced 717
higher yield than the ILC strategy. However, where sensor data availability is limited 718
then the results indicate that an ILC strategy would be preferable to optimise irrigated 719
water use efficiency. Valid field validation remains a challenge (unless there are 720
multiple fields and irrigation machines) but further work will involve field evaluations 721
to compare the simulated and measured control strategy performance. 722
723
Acknowledgements 724
The authors are grateful to the Australian Research Council and the Cotton Research 725
and Development Corporation for funding a postgraduate studentship for the senior 726
author. 727
728
References 729
Ahn, H.-S., Moore, K. L. and Chen, Y. (2007) Iterative learning control: robustness 730
and monotonic convergence for interval systems. Communications and Control 731
31 733
Allen, R., Perera, L., Raes, D. and Smith, M. (1998), Crop evapotranspiration: 734
guidelines for computing crop water requirements, Technical report, FAO Irrigation 735
and Drainage Paper 56. 736
737
BPA (1999) Determining a framework, terms and definitions for water use efficiency 738
in irrigation, Barrett Purcell and Associates, Land and Water Resources Research and 739
Development Corporation, Canberra, Australia. 740
741
Evans, R. (2006) Irrigation technologies. Sidney, Montana. Viewed 19 June 2007, 742
http://www.sidney.ars.usda.gov/. 743
744
Gibb, D., Neilsen, J. and Constable, G. (2004) Cotton growth responses to water 745
stress. In: ‘WaterPAK - a guide for irrigation management in cotton’, Australian 746
Cotton Cooperative Research Centre and Cotton Research and Development 747
Corporation, Narrabri, Australia, chapter 3.1, pp. 117-126. 748
749
Hearn, A.B. (1994) OZCOT: A simulation model for cotton crop management. 750
Agricultural Systems 44:257-299. 751
752
Korovessi, E. and Linninger, A. (2006) Batch processes. Taylor and Francis Group, 753
Florida. 754
755
Liu, G., Yang, J.-B. and Whidborne, J. (2001) Multiobjective optimisation and 756
32 758
McCarthy, A.C., Hancock, N.H. and Raine, S.R. (2010) VARIwise: a general-purpose 759
adaptive control simulation framework for spatially and temporally varied irrigation at 760
sub-field scale. Computers and Electronics in Agriculture 70(1):117-128. 761
762
McCarthy A.C., Hancock, N.H. and Raine, S.R. (2011a) Real-time data requirements 763
for model-based adaptive control of irrigation scheduling in cotton. Australian 764
Journal of Multi-disciplinary Engineering 8:2 pp189-206. 765
766
McCarthy A.C., Hancock, N.H. and Raine, S.R. (2011b) Advanced process control of 767
irrigation: the current state and an analysis to aid future development. Irrigation 768
Science. doi: 10.1007/s00271-011-0313-1. 769
770
McCarthy A.C., Hancock, N.H. and Raine, S.R. (2013) Simulation of irrigation 771
control strategies for cotton using Model Predictive Control within the VARIwise 772
simulation framework. Submitted to Computers and Electronics in Agriculture 773
774
Moore, K. and Chen, Y. (2006) Iterative learning control approach to a diffusion 775
control problem in an irrigation application. In: ‘IEEE International Conference on 776
Mechatronics and Automation’, LuoYang, China, pp. 1329-1334. 777
778
QNRM (2009) Queensland Natural Resources and Mines enhanced meteorological 779
datasets. Viewed 4 March 2008, http://www.longpaddock.qld.gov.au/silo/. 780
33
Rab, M.A., Fisher, P.D., Armstrong, R.D., Abuzar, M., Robinson, N.J. and Chandra, 782
S. (2009) Advances in precision agriculture in south-eastern Australia. IV. Spatial 783
variability in plant-available water capacity and its relationship with yield in site-784
specific zones, Crop and Pasture Science 60:885-900. 785
786
Richards, Q.D., Bange, M.P. and Johnston, S.B. (2008) HydroLOGIC: an irrigation 787
management system for Australian cotton, Agricultural Systems 98(1):40-49. 788
789
Rochester, I. (2006) Efficient use of nitrogen fertilisers. The Australian Cottongrower 790
27(7):48-50. 791
792
Rochester, I., Ceeney, S., Maas, S., Gordon, R., Hanna, L. and Hill, J. (2009) 793
Monitoring nitrogen use efficiency in cotton crops. The Australian Cottongrower 794
30(2):42-43. 795
796
Russell, S. and Norvig, P. (1995) Artificial intelligence: a modern approach. Prentice 797
Hall, New Jersey. 798
799
Smith, R., Raine, S., McCarthy, A. and Hancock, N. (2009) Managing spatial and 800
temporal variability in irrigated agriculture through adaptive control. Australian 801
Journal of Multi-disciplinary Engineering 7(1):79-90. 802
803
Warwick, K. (1993) Adaptive control. In: S. Tzafestas, ed., ‘Applied control’, 804
Electrical and Computer Engineering, Marcel Dukker Inc, New York, chapter 9, pp. 805
34 807
Wells, A. and Hearn, A. (1992) OZCOT: a cotton crop simulation model for 808
management. Mathematics and Computers in Simulation 33:433-438. 809
810
Wong, M., Oliver, Y., Robertson, M. and Wittwer, K. (2006) Technologies to 811
estimate plant available soil-water storage capacities at high spatial resolution, In: 812
35 Figures and Tables
814 815
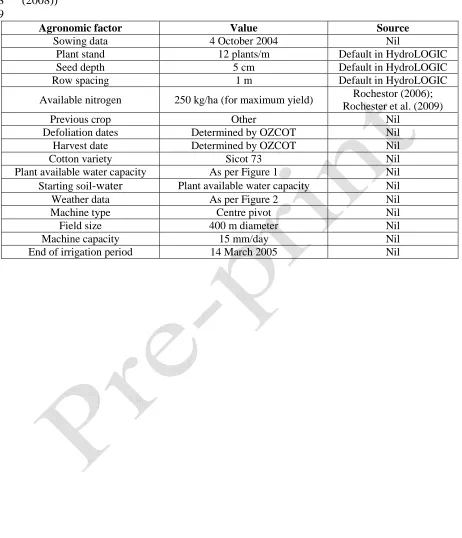
Table 1: Agronomic factors used in cotton model OZCOT for control strategy 816
simulations (where HydroLOGIC is a user interface for OZCOT, Richards et al. 817
(2008)) 818
819
Agronomic factor Value Source
Sowing data 4 October 2004 Nil
Plant stand 12 plants/m Default in HydroLOGIC
Seed depth 5 cm Default in HydroLOGIC
Row spacing 1 m Default in HydroLOGIC
Available nitrogen 250 kg/ha (for maximum yield) Rochestor (2006); Rochester et al. (2009)
Previous crop Other Nil
Defoliation dates Determined by OZCOT Nil
Harvest date Determined by OZCOT Nil
Cotton variety Sicot 73 Nil
Plant available water capacity As per Figure 1 Nil
Starting soil-water Plant available water capacity Nil
Weather data As per Figure 2 Nil
Machine type Centre pivot Nil
Field size 400 m diameter Nil
Machine capacity 15 mm/day Nil
[image:35.595.68.530.134.672.2]36
Table 2: Simulations conducted to compare interactions between control strategies 820
(labelled by ID#) and input variables for Iterative Learning Control. 821
822
Irrigation calculation ID
#
Input variables for
control
Weather
data input Irrigation volume Irrigation
timing
1 Soil Averaged
SILO data Maintain soil-water deficit
Change in soil-water
2 Plant Averaged
SILO data Target leaf area index Change in ETc 3 Weather AND
plant SILO data Target leaf area index Change in ETc 4 Soil AND
plant (A)
Averaged SILO data
Maintain soil-water deficit and target leaf area index
Change in soil-water 5 Soil AND
plant (B)
Averaged
SILO data Target leaf area index
[image:36.595.88.503.105.665.2]37
Table 3: Simulations conducted to compare interactions between control strategies 823
(labelled by ID#) and input variables for Iterative Hill Climbing Control. N 824
825
Irrigation calculation ID
#
Input variables for
control
Weather
data input Irrigation volume Irrigation
timing
6 Soil Averaged
SILO data Maintain soil-water deficit
Change in soil-water
7 Plant Averaged
SILO data Maximise square/boll count Change in ETc 8 Weather AND
plant SILO data Maximise square/boll count Change in ETc 9 Soil AND
plant (A)
Averaged SILO data
Maintain soil-water deficit and maximise square/boll count
Change in soil-water 10 Soil AND
plant (B)
Averaged
SILO data Maximise square/boll count
[image:37.595.79.505.98.672.2]38
Table 4: Performance of the industry-standard irrigation strategy for homogeneous 827
and spatially variable field 828
Infield soil properties
Average yield (bales/ha)
Average water applied (MLtotal/ha)
Average irrigation
applied (MLirrigated
/ha)
CWUI (bales/ MLtotal)
IWUI (bales/ MLirrigated)
Sand 5.8 9.0 6.0 0.6 1.0
Clay loam 10.0 8.7 5.8 1.1 1.7
Clay 10.7 9.5 6.3 1.1 1.7
Spatial variable 9.1 ± 1.9 10.2 6.8 0.9 1.4
39
Table 5: Performance of the ILC strategies with different data input combinations for 830
homogenous and spatially variable fields 831 Control strategy ID # Infield soil properties Average yield (bales/ha) Average water applied (MLtotal/ha)
Average irrigation applied (MLirrigated /ha) CWUI (bales/ MLtotal)
IWUI (bales/ MLirrigated)
Sand 10.0 9.0 5.8 1.1 1.7
Clay loam 12.7 8.8 5.7 1.4 2.2
Clay 12.9 8.5 5.5 1.5 2.3
1
Spatially variable
12.2 ± 1.5
11.3 7.3 1.1 1.7
Sand 7.4 15.0 9.7 0.6 0.8
Clay loam 7.5 15.9 10.3 0.5 0.7
Clay 8.5 15.8 10.2 0.7 0.8
2
Spatially variable
8.3 ± 1.6
16.5 10.3 0.5 0.8
Sand 8.5 12.2 7.9 0.7 1.1
Clay loam 8.2 14.4 9.3 0.6 0.9
Clay 9.1 14.1 9.1 0.6 1.0
3
Spatially variable
8.9 ± 1.9
12.6 8.0 0.7 1.1
Sand 9.7 8.8 5.7 1.1 1.7
Clay loam 11.4 10.6 6.9 1.1 1.7
Clay 12.7 11.3 7.3 1.1 1.7
4
Spatially variable
10.2 ± 1.4
11.1 7.7 0.9 1.3
Sand 9.5 9.3 6.0 1.0 1.6
Clay loam 10.9 11.1 7.2 1.0 1.5
Clay 11.9 11.6 7.5 1.0 1.6
5
Spatially variable
9.9 ± 2.0
12.8 7.9 0.8 1.3
40
Table 6: Performance of the IHCC strategy with different data input combinations for 833
homogenous and spatially variable fields 834 Control strategy ID # Infield soil properties Average yield (bales/ha) Average water applied (MLtotal/ha)
Average irrigation applied (MLirrigated /ha) CWUI (bales/ MLtotal)
IWUI (bales/ MLirrigated)
Sand 9.9 8.8 5.7 1.1 1.7
Clay loam 12.3 9.0 5.8 1.4 2.1
Clay 12.6 9.3 6.0 1.4 2.1
6
Spatially variable
11.2 ± 1.9
11.1 7.9 1.0 1.4
Sand 9.0 7.6 4.9 1.2 1.8
Clay loam 10.9 7.9 5.1 1.4 2.1
Clay 11.1 8.5 5.5 1.3 2.0
7
Spatially variable
10.9 ± 2.5
11.9 7.7 0.9 1.4
Sand 9.2 7.4 4.8 1.2 1.9
Clay loam 11.2 7.6 4.9 1.5 2.3
Clay 11.4 11.6 5.1 1.0 2.2
8
Spatially variable
11.0 ± 1.8
11.2 7.5 1.0 1.5
Sand 10.0 8.8 5.7 1.1 7.5
Clay loam 12.4 9.1 5.9 1.4 2.1
Clay 12.7 9.4 6.1 1.4 2.1
9
Spatially variable
12.4 ± 1.6
12.6 8.1 1.0 1.5
Sand 10.1 8.8 5.7 1.4 1.8
Clay loam 12.4 9.1 5.9 1.4 2.1
Clay 12.7 9.6 6.2 1.3 2.0
10
Spatially variable
11.4 ± 1.8
41 835
[image:41.595.90.507.66.299.2]836
Figure 1: The simulation framework VARIwise configured to evaluate (in simulation 837
mode) the sensor-based adaptive control strategies. The items shown in grey/hatched 838
are not implemented but would be present in a field evaluation.) This diagram is 839
adapted from the full VARIwise flowchart presented as Figure 2 of McCarthy et al. 840
42 842
(a) 843
844
(c) 845
846
Figure 2: Soil variability for: (a) industry-standard, ILC and IHCC strategy 847
simulation; and (b) the cells assigned to each zone using the soil variability data of 848
43 850
Figure 3: Weather profile used in industry-standard irrigation management and 851
[image:43.595.131.483.83.395.2]44 853
Figure 4: Target leaf area index used for iterative learning control strategy for cotton 854
45 856
5
Yield (bales/ha)
15
857
Figure 5: Yield map for industry-standard irrigation management strategy for 858
[image:45.595.134.491.82.280.2]46 860
(a) Simulation #1
Soil only
(b) Simulation #2
Plant only
(c) Simulation #3
Weather AND plant (d) Simulation #4
Soil AND plant (A)
(e) Simulation #5
Soil AND plant (B)
5
Yield (bales/ha)
15
861
Figure 6: Yield maps and average yield and irrigation outputs of iterative learning 862
control (ILC) strategy with variable-rate irrigation machine and legend for yield maps 863
[image:46.595.56.519.78.389.2]47 865
(a) 866
867
48
Figure 7: Irrigation volumes applied to sand, clay loam and clay cells for ILC 869
strategies that target: (a) soil-water deficit (simulation #1); and (b) leaf area index 870
[image:48.595.95.485.224.642.2]49
872
(a) (b)
873
874
(c) (d)
[image:49.595.85.499.74.496.2]875 876
Figure 8: Simulated daily soil-water deficit in sand, clay loam and clay cells for ILC 877
strategies that target: (a) soil-water deficit (simulation #1); and (b) leaf area index 878
(simulation #2); and IHCC strategies that: (c) target soil-water deficit and maximise 879
50 881
(a) (b)
882
883
(c) (d)
[image:50.595.69.490.75.495.2]884 885
Figure 9: Simulated daily leaf area index in sand, clay loam and clay cells for ILC 886
strategies that target: (a) soil-water deficit (simulation #1); and (b) leaf area index 887
(simulation #2); and square count for IHCC strategies that: (c) target soil-water deficit 888