UDC Subject Classification: 159.9
ATTENTIONAL BIAS: A METHODOLOGICAL REVIEW
Peter Chew
BPsych (Hons I), Ph.D. Candidate. James Cook University Singapore, Statistics Anxiety and Psychometrics
Abstract
The high prevalence rate and associated costs of anxiety disorders have resulted in increasing research attention on the role of attentional bias in anxiety. Although seven literature reviews and meta-analyses are devoted to attentional bias, none of them consider the methodological aspects of the studies. This article reviews the literature to provide a methodological user guide for researchers. First, we describe common reaction time (RT) tasks and review the evidence for attentional bias. Second, we evaluate the methods of studying attentional bias and make recommendations to address the following limitations: the (a) seemingly poor psychometric properties of RT tasks, (b) inappropriate practice of dichotomizing continuous variables, (c) improper handling of RT distributions, and (d) use of the mean as a summary statistic.
Keywords: attentional bias, methodological review, emotional Stroop task, dot probe task
Anxiety disorders are among the most common types of psychological disorder. Across the spectrum of anxiety disorders, results pooled from 46 studies published between 1980 and 2004 suggest one-year and lifetime prevalence rates of 10.6% and 16.6%, respectively (Somers, Goldner, Waraich, & Hsu, 2006). Anxiety disorders are associated with significant societal and financial costs. For example, anxiety disorders are related to lower educational attainment and marital instability (Lépine, 2002). Furthermore, costs of anxiety disorders in the USA were estimated to be USD46.6 billion in 1990 (DuPont et al., 1996). A review of studies in Europe showed that the overall direct (e.g., healthcare) and indirect (e.g., absence from work) cost per patient diagnosed with anxiety disorders ranged from EUR546 to EUR1628 (Andlin-Sobocki & Wittchen, 2005). Given these costs, studies have been conducted to identify the mechanisms of anxiety disorders and develop interventions for them.
Since 1990, increasing research attention has been directed to the role of attentional biases in anxiety. Indeed, at least eight literature reviews including two meta-analyses have been devoted to the topic (see Table 1). To minimize overlaps in content, the purpose of this paper is to provide a methodological review of the attentional bias literature with the goal of providing a user guide for researchers. This paper has two sections. The first section provides an overview of relevant cognitive theories, a description of reaction time (RT) tasks employed in studies of attentional bias, and reviews the evidence for attentional bias among clinical and non-clinical populations. The second section evaluates the methods of studying and analyzing attentional bias by addressing several methodological limitations.
Attentional Bias
Attentional bias toward threat is defined as the “differential attentional allocation towards threatening stimuli relative to neutral stimuli” (Cisler & Koster, 2010, p. 203). Despite the existence of several cognitive theories (Eysenck, Derakshan, Santos, & Calvo, 2007; Öhman, 1993) and models (Bar-Haim, Lamy, Pergamin, Bakermans-Kranenburg, & Van IJzendoorn, 2007; Mathews & Mackintosh, 1998; Mogg & Bradley, 1998; Wells & Matthews, 1994; Willams, Watts, MacLeod, & Mathews, 1988) explaining attention, studies on attentional bias have been primarily motivated by Beck’s schema theory (Beck & Clark, 1988, 1997; Beck, 1976) and Bower’s network theory (1981, 1987).
Summary of Literature Reviews and Meta-Analyses on Attentional Bias
Studies Description
(Bar-Haim et al., 2007) A meta-analysis of 172 studies on attentional bias.
(Cisler et al., 2007) An evaluation of the four assessment tasks commonly used in attentional bias research.
(Cisler & Koster, 2010) Mechanisms of attentional bias and a description of proposed theoretical models.
(Mobini & Grant, 2007) Clinical implications of attentional bias in anxiety disorders. (Phaf & Kan, 2007) A meta-analysis of 70 studies that used the emotional Stroop
task.
(Puliafico & Kendall, 2006) Attentional bias among children and adolescents.
(Van Bockstaele et al., 2014) A review of the causal evidence of attentional bias on anxiety (Williams et al., 1996) The use of the emotional Stroop task to investigate attentional
bias in psychopathology.
According to Beck and Clark (1988), “schemas are functional structures of relatively enduring representations of prior knowledge and experience” (p. 24). These cognitive structures guide information processing; individuals tend to elaborate or ignore stimuli that are consistent or inconsistent with existing schemas, respectively. Schema theory suggests that individuals with trait anxiety have an “anxious” schema. This schema guides the attention of these individuals to process anxiety-related stimuli in the environment (i.e., an attentional bias).
Bower (1981, 1987) makes a similar prediction, albeit for individuals with state anxiety. Bower hypothesizes that emotions are stored as nodes in a network and they are connected to other nodes containing emotionally-congruent information. Individuals experiencing an emotional state will activate the relevant emotion nodes. In turn, the emotion nodes will prime the associated nodes for subsequent processing. In other words, emotions “will enhance the salience of mood-congruent material for selective attention and learning” (Bower, 1981, p. 142). Hence, anxious individuals will show an attentional bias for anxiety-related stimuli in their environment.
RT Tasks
Researchers have used a number of RT tasks to study attentional bias. These tasks include the spatial cueing task (e.g., Fox, Russo, Bowles, & Dutton, 2001; Fox, Russo, & Dutton, 2002), the visual search task (e.g., Dandeneau, Baldwin, Baccus, Sakellaropoulo, & Pruessner, 2007), the emotional Stroop task (Williams, Mathews, & MacLeod, 1996), and the dot probe task (MacLeod, Mathews, & Tata, 1986). Among these tasks, the emotional Stroop task and the dot probe task are the most popular and are the focus of this review.
Emotional Stroop task. The emotional Stroop task is an adaptation of a classic paradigm first introduced by Stroop (1935). In the Stroop task, participants name the color of the words (e.g., black) while disregarding the content of the words (e.g., red). The emotional Stroop task varies in that the content of the words represents threat (e.g., suffer) rather than color. Earlier studies used cards with words printed on them. For instance, Mathews and MacLeod (1985) used four cards, with each card containing 96 words representing different forms of threat (e.g., ‘disease’ – physical threat, ‘failure’ – social threat, etc.). Subsequently, with increasing access to technology, researchers used computers to administer the emotional Stroop task. In a typical single trial, participants see a fixation point (+) in the center of the screen for 500ms followed by a word that remains on the screen until a response is made. Participants respond by either speaking the color of the word into a microphone (e.g., Constans, McCloskey, Vasterling, Brailey, & Mathews, 2004) or by pressing a key that corresponds to the color of the word (e.g., Egloff & Hock, 2003).
interpretation has been disputed. Among 32 emotional Stroop task studies, the threatening words used were found to be significantly longer in length, lower in frequency of use, and have smaller orthographic neighbourhood size than neutral words. These lexical features all lead to slower word recognition and therefore might explain the interference effect (Larsen, Mercer, & Balota, 2006). Furthermore, an attentional bias interpretation does not explain why repressors (individuals high in social desirability but low in anxiety) showed a greater interference effect than individuals high in trait anxiety. Because repressors tend to avoid threatening stimuli, the interference effect might be explained by both attentional bias and cognitive avoidance (De Ruiter & Brosschot, 1994).
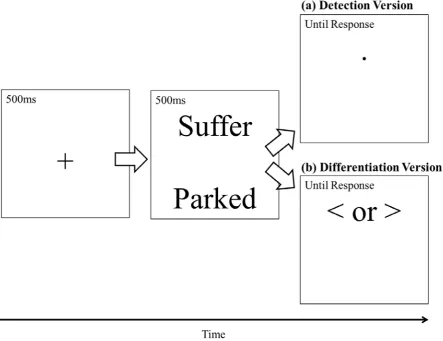
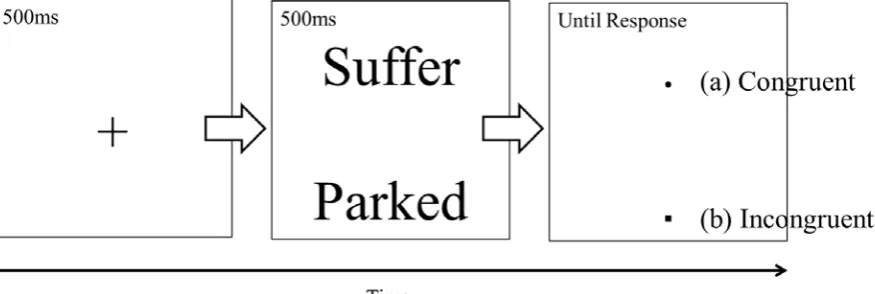
Dot probe task. The dot probe task (MacLeod et al., 1986) can only be administered using a computer. In a single trial, participants see a fixation point (+) in the center of the screen for 500ms followed by a pair of threatening and neutral stimuli randomly presented one above the other for 500ms. This is followed by a probe stimulus randomly presented in either the top or bottom location. The probe stimulus remains on the screen until a response is made (see Figure 1). The probe stimulus replaces the threatening stimuli in congruent trials and the neutral stimuli in
incongruent trials (see Figure 2).
The type of probe stimulus depends on which of two versions of the dot probe task is used. The detection version requires participants to respond to a dot (.) as a probe stimulus (e.g., Koster, Crombez, Verschuere, & De Houwer, 2004) whereas the differentiation version requires participants to discriminate between two related probe stimuli (e.g., ‘<’ vs. ‘>’) (e.g., MacLeod, Soong, Rutherford, & Campbell, 2007). Although the detection version produces a larger attentional bias effect than the differentiation version (Salemink, van den Hout, & Kindt, 2007), both versions of the task are used currently.
Figure 1. A single trial of the (a) detection version and the (b) differentiation version of the dot
[image:3.595.61.505.385.726.2]and Holker (2002).
Anxious individuals showed an attentional bias on the dot probe task in a variety of studies (see Bar-Haim et al., 2007 for a review). Because attention was directed to the threatening stimuli, these individuals responded faster on congruent trials than on incongruent trials. This effect is often interpreted as both vigilance for threat and a difficulty to disengage from threat (Koster et al., 2004; Koster, Crombez, Verschuere, Van Damme, & Wiersema, 2006).
The dot probe task has one major advantage over the emotional Stroop task. Due to the use of color-naming as a response, only words can be used as stimuli in the emotional Stroop task (however, see Strauss, Allen, Jorgensen, & Cramer, 2005 for a picture-word Stroop task). This is a limitation because single words might not fully represent the range of anxiety-provoking stimuli for anxious individuals (Bradley, Mogg, & Millar, 2000). Although words remain the prevailing stimuli, some studies have used faces (e.g., sad, angry, and happy faces) (Cooper & Langton, 2006; Gotlib, Krasnoperova, Yue, & Joormann, 2004) or pictures (e.g., photographs of corpses, weapons, etc.) (Elsesser, Sartory, & Tackenberg, 2004; Yiend & Mathews, 2001) as stimuli for the dot probe task.
Figure 2. A single trial of the dot probe task. The probe stimulus replaces (a) the threatening
stimuli (i.e., suffer) in congruent trials and (b) the neutral stimuli (i.e., parked) in incongruent trials. Stimuli adapted from MacLeod, Rutherford, Campbell, Ebsworthy, and Holker (2002).
Variants. There are two variants to the tasks. The first variant uses the backward masking procedure (e.g., replacing the stimuli after 50ms with ‘XXXXX’ for 450ms) to examine automatic versus strategic information processing. In general, attentional bias effects are found at both levels of information processing (Egloff & Hock, 2003; MacLeod & Rutherford, 1992; Mogg, Bradley, & Williams, 1995; Mogg, Bradley, Williams, & Mathews, 1993; Mogg & Bradley, 1999). The second variant includes various stimuli presentation times to explore early versus later stages of information processing (Cooper & Langton, 2006; Koster et al., 2006; Mogg, Bradley, Miles, & Dixon, 2004). For instance, although all participants showed an attentional bias at 100ms, only anxious participants showed an attentional bias at 500ms (Koster, Verschuere, Crombez, & Van Damme, 2005).
Evidence for Attentional Bias
Bar-Haim et al. (2007) included 172 published attentional bias studies (N = 2263 anxious, N
= 1768 nonanxious) conducted between 1986 and 2005 in a meta-analysis. The results revealed that attentional bias had a low-to-medium effect size (d = .45); the bias was consistently found across tasks and anxious populations (e.g., clinical and nonclinical), but not in nonanxious individuals.
[image:4.595.65.503.297.444.2]= 35). Participants completed the dot probe task online. Results showed that the clinical group was faster in responding to a probe stimulus which replaced a threatening word (e.g., suffer) than a neutral word (e.g., parked). Evidence of attentional bias has been documented among many types of anxiety disorders such as generalized anxiety disorder (Dalgleish et al., 2003), panic disorder (Buckley, Blanchard, & Hickling, 2002),and post-traumatic stress disorder (Constans et al., 2004). Attentional bias has also been found for specific phobias such as spider phobia (Olatunji, Sawchuk, Lee, Lohr, & Tolin, 2008) and social phobia (Mogg, Philippot, & Bradley, 2004), but less consistently for obsessive-compulsive disorder (Amir, Najmi, & Morrison, 2009; Harkness, Harris, Jones, & Vaccaro, 2009).
Attentional bias has also been examined in non-clinical populations. Such studies often allocate participants to one of two groups based on their anxiety scores and then compare levels of attentional bias. For instance, Egloff and Hock (2003) used a median split to divide 53 participants into low (n = 26) and high anxiety (n = 27) groups based on their scores on the trait scale of the State Trait Anxiety Inventory (Spielberger, Gorsuch, & Lushene, 1970). Participants completed the emotional Stroop task and the dot probe task. Participants with high anxiety were faster in responding to a probe stimulus that replaced a threatening word on the dot probe task, and slower in naming the colour of a threatening word on the emotional Stroop task. Evidence of attentional bias has also been documented in individuals with social anxiety (Carrigan, Drobes, & Randall, 2004), physical anxiety sensitivity, (Keogh, Dillon, Georgiou, & Hunt, 2001), dental anxiety (Johnsen et al., 2003; Jones, Stacey, & Martin, 2002), and fear of pain (Keogh, Ellery, Hunt, & Hannent, 2001) or fear of animals (Lipp & Derakshan, 2005). Although attentional bias has been consistently demonstrated in a large number of studies, certain methodological limitations should be considered. Methodological Limitations
Several methodological limitations have not been fully considered by attentional bias researchers. These limitations include the (a) seemingly poor psychometric properties of RT tasks, (b) inappropriate practice of dichotomizing continuous variables, (c) improper handling of RT distributions, and (d) use of the mean as a summary statistic. A slight digression into the methods of scoring RT tasks is necessary for a discussion of these limitations.
Methods of Scoring RT Tasks
There are two methods to score and analyse the data from the tasks. The RT scoring method uses RT as a within-subjects independent variable. In this instance, RT is averaged for each stimulus type (e.g., threatening vs. neutral). For example, a 4 (Stimulus type: OCD threat, panic threat, normal threat, neutral) x 2 (Group: panic disorder patients, control) x 2 (Condition: subliminal, supraliminal) MANOVA was used to examine attentional bias for disorder-specific information on the emotional Stroop task (Kampman, Keijsers, Verbraak, Näring, & Hoogduin, 2002).
The threat bias index (TBI) scoring method uses TBI scores as the dependent variable. TBI scores are calculated differently for the emotional Stroop and dot probe tasks. In the emotional Stroop task, TBI = mean RT for threatening stimuli minus mean RT for neutral stimuli. A positive TBI indicates interference in colour naming of threatening stimuli compared to neutral stimuli (Mogg et al., 2000). In the dot probe task, TBI = mean RT for incongruent trials minus mean RT
for congruent trials. A positive TBI indicates vigilance for threat whereas a negative TBI indicates
avoidance of threat (MacLeod et al., 2007). Using this method, the same study mentioned earlier could analyse their data using a 2 (Group: panic disorder patients, control) x 2 (Condition: subliminal, supraliminal) MANOVA on the TBI scores (Kampman et al., 2002). Although both methods produce the same results, the TBI scoring method aids interpretation due to the reduction of one independent variable. Nevertheless, it appears that the RT scoring method produces better psychometric properties for the tasks.
Psychometric Properties of RT Tasks
clinical and non-clinical populations (Bar-Haim et al., 2007; J. M. Williams et al., 1996), most studies have ignored the need for tasks to meet basic standards of reliability and validity. For example, Cisler et al. (2007) argued in a literature review that “results across the different tasks converge along a number of different lines that allow for conclusions to be drawn despite the questionable psychometric properties” (p. 226). However, given that the field of psychology has always placed a high emphasis on the psychometric properties of instruments and tasks, future research attention should be directed to this area. This review suggests two surprising possibilities: (a) the tasks might be reliable if the RT scoring method was used and (b) the tasks might be assessing two different constructs instead of different underlying processes of the same construct (i.e., attentional bias).
Reliability. The reliability assessment of the emotional Stroop task is influenced greatly by the scoring method used. In general, reported test-retest reliabilities for the RT scoring method are acceptable and they range from .73 to .94 (Eide, Kemp, Silberstein, Nathan, & Stough, 2002; Kindt, Bierman, & Brosschot, 1996; Siegrist, 1997; Strauss et al., 2005). Test-retest reliabilities reported for the TBI scoring method are unacceptable. Nonsignificant correlations were reported after a short interval in the same testing session (Siegrist, 1997) and after one week (Eide et al., 2002; Strauss et al., 2005), while a significant but small correlation (r = .25) was found after three months (Kindt et al., 1996). No other forms of reliabilities have been examined for the emotional Stroop task.
The dot probe task is unreliable using the TBI scoring method. The detection version of the task has reported split-half reliabilities that range from -.16 to .19, Cronbach’s alphas that range from .00 to .28, and one-week test-retest reliabilities that range from -.22 to .32 for both words and pictures (Schmukle, 2005). Similar results were reported for the differentiation version of the task using faces as stimuli (Staugaard, 2009). The current review did not locate any published research that has investigated reliability of the dot probe task using the RT scoring method.
Several failed attempts have been made to increase the reliability of the tasks. Loss of concentration has been cited as a reason for low reliability. Since anxious individuals might be resistant to such loss because the stimuli are emotionally relevant to them, reliabilities have been calculated separately for these individuals. Nevertheless, no significant improvement in reliability was found for anxious individuals in the emotional Stroop task (Kindt et al., 1996) or the dot probe task (Schmukle, 2005). Modifications have also been made to the dot probe task to increase its reliability. For instance, the task has been modified to present word pairs for only 100ms instead of 500ms (Schmukle, 2005) or to retain the pairs of faces even after presentation of the probe stimulus (Staugaard, 2009). Neither modification yielded acceptable levels of reliability.
The TBI scoring method is problematic for two reasons. First, the use of change scores that are derived from two highly correlated conditions (i.e., mean RT for threatening and neutral stimuli, respectively) may result in low test-retest correlations (Eide et al., 2002). Second, change scores combine measurement error from both conditions. This compounding of errors may result in lower correlation coefficients (Strauss et al., 2005). As mentioned, results from the emotional Stroop task showed acceptable levels of test-retest reliability for the RT scoring method, but not for the TBI scoring method. It seems likely that the dot probe task might share the same pattern of results as the emotional Stroop task. Therefore, future research should use the RT scoring method to examine the psychometric properties of the dot probe task.
The lack of convergent validity raises an important question. Specifically: Are the tasks assessing different underlying processes of the same construct (i.e., attentional bias) or are they assessing different constructs? Most researchers favour the first position. For example, authors of studies that found nonsignificant correlations argued that the tasks share different underlying processes (Mogg et al., 2000), the suggestion being that the emotional Stroop task assesses response inhibition whereas the dot probe task assesses attentional allocation (Cisler et al., 2007). Conversely, authors of studies reporting significant correlations argued that the tasks share some common underlying processes (Egloff & Hock, 2003), although it is unclear what these common processes are. Despite the favouring of the first position, the second position seems equally plausible given the nonsignificant, zero correlations between the tasks (e.g., Dalgleish et al., 2003). For instance, the emotional Stroop task might be a measure of cognitive avoidance whereas the dot probe task might be a measure of attentional bias (De Ruiter & Brosschot, 1994). Future research should attempt to identify both the common and unique processes underlying both tasks.
Dichotomization of Continuous Variables
The practice of dichotomizing continuous variables into categorical ones is not recommended. Attentional bias research among nonclinical populations tends to dichotomize the anxiety variable by either using the median split (e.g., Egloff & Hock, 2003) or using extreme scorers from a large sample (e.g., Keogh, Dillon, et al., 2001). Both methods result in a loss of information and power (MacCallum, Zhang, Preacher, & Rucker, 2002; Naggara et al., 2011), and inflates the Type I error rate (Austin & Brunner, 2004). Dichotomization also results in different cutoff values for different studies, making comparisons at least challenging if not impossible (Altman, 2006). For example, participants have been classified as ‘High Anxiety’ when they scored more than 44 (Mogg et al., 2000), 45 (Fox, 2002), or 46 (Fox, 1993) on the State Trait Anxiety Inventory (Spielberger et al., 1970). Participants have also been classified as ‘High Anxiety’ and ‘Low Anxiety’ when they scored in the upper and lower 10% (Koster et al., 2006) or 25% (Koster et al., 2005) on the State Trait Anxiety Inventory. A more serious limitation occurs when researchers use ‘optimal’ cutoff values. Given the well documented phenomenon of publication bias (Ferguson & Heene, 2012), researchers might be tempted to try more than one cutoff value and choose the value that would produce significant results (Royston, Altman, & Sauerbrei, 2006). It is noteworthy that no attentional bias studies to date have used ‘optimal’ cutoff values.
We make three recommendations for researchers who insist on dichotomizing continuous variables. First, to pursue a confirmatory research agenda in psychology (Wagenmakers, Wetzels, Borsboom, Maas, & Kievit, 2012), we recommend researchers determine and document the cut-off value before data analysis. For instance, the cut-off value could be based on previous research and documented in the ethics approval form. Subsequently, the form should be submitted together with the paper to journals and any deviations from the initial cut-off value should be justified. Second, if a large sample size is available, the continuous variable should be dichotomized using extreme scorers instead of the median split (Naggara et al., 2011). A study on working memory span tasks reported that using extreme scorers (e.g., the top and bottom 25% of the distribution as ‘high’ and ‘low’, respectively) resulted in a misclassification of 8% of the participants whereas the median split resulted in a misclassification of 25% of the participants (Conway et al., 2005). Lastly, normative means should be used if available. For example, 40 is the normative mean for high trait anxiety on the State-Trait Anxiety Inventory (Spielberger et al., 1970). Using 40 as a cut-off value is conceptually meaningful and permits comparisons across studies.
examine the relationship between anxiety and the difference between conditions (i.e., incongruent
minus congruent trials). A positive correlation provides evidence for attentional bias on the dot probe task. Specifically, higher values of anxiety are associated with higher values of incongruent
trials relative to congruent trials (i.e., faster in responding to congruent trials). Pearson product-moment correlation coefficient should be used to analyze the data when the TBI scoring method is used (e.g., Egloff & Hock, 2001). Similarly, a positive correlation provides evidence for attentional bias on the dot probe task, with higher anxiety associated with higher TBI scores. The use of the GLM or correlation allows the anxiety variable to remain continuous and serves as a better optimized analysis to the often-used ANOVA.
Handling RT Distributions
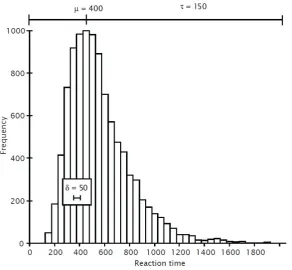
RT data are not normally distributed. The RT distribution tends to be positively skewed; the distribution rises sharply from the left and declines to a long tail on the right (see Figure 3). Furthermore, RT data tend to contain outliers. Outliers occur when participants anticipate the stimuli or are distracted from the task, resulting in extremely fast or slow RTs, respectively. Using ANOVA on mean RT without dealing with skewness or outliers reduces the power to detect real differences between conditions (Wilcox, 1998). Thus, these issues have to be dealt with before data analysis.
Many statistics textbooks recommend the use of non-parametric tests when assumptions of parametric tests are violated. For instance, the Spearman R can be used as a non-parametric equivalent of the Pearson product-moment correlation coefficient (Siegel & Castellan, 1988). However, such recommendations are not without limitations. From a statistical perspective, it has been demonstrated that the robustness of non-parametric tests are as limited as parametric tests when outliers are present (Zimmerman, 1995) or when assumptions of normality are violated (Zimmerman, 1998). From a practical perspective, parametric tests are well known and easily interpreted by most readers. It is not uncommon for journal editors to request authors to report parametric tests in their manuscripts, with the non-parametric equivalent omitted or relegated to a footnote. Given these limitations, we suggest other methods of dealing with RT distributions.
Figure 3. A simulated positively skewed distribution showing the characteristic shape of RT
[image:8.595.155.448.449.719.2]Listed in order of increasing power, there are four strategies to handle skewness or outliers: (a) accommodation, (b) outlier elimination (Beckman & Cook, 1983), (c) transformation (Ratcliff, 1993), and (d) whole distribution analysis (Balota & Yap, 2011). Accommodation uses median instead of the mean as a summary measure because the median is relatively uninfluenced by outliers (Ulrich & Miller, 1994). Outlier elimination uses cutoffs to remove outliers. Cutoffs are either based on an absolute value (e.g., RT more than 2000ms) or on the standard deviation (e.g., RT greater than two standard deviations above the mean). Transformation normalizes the distribution and reduces the impact of outliers. Two of the most popular methods involve applying logarithm to RT (i.e., ln RT) or transforming RT to speed (i.e., 1 / RT). Although the first method results in a more normal distribution, the second method maintains higher power. Lastly, whole distribution analysis takes into account skewness and analyzes mu (µ), sigma (δ), and tau (τ) of the distribution (see Figure 3). Nevertheless, whole distribution analysis is seldom used due to the requirement for many data points (i.e., RT trials) and the need for programming language to use distribution fitting software (Whelan, 2010).
Few empirical studies have been conducted to compare the effects of using different strategies on attentional bias RT data. Schmukle (2005) used three strategies [no changes to RT data, outlier elimination strategy, and transformation strategy (1 / RT)] to handle RT data in his investigation on the reliability of the dot probe task. The results were similar across all three strategies, suggesting that there were no benefits to using any of the strategies over the others. However, not all strategies were used and only the dot probe task was considered. Future research should consider more strategies, use both RT tasks, and use latency operating characteristic functions to evaluate the effectiveness of each strategy (e.g., see Greenwald, Nosek, & Banaji, 2003). Due to this lack of empirical evidence, the remaining review in this section is restricted to practical and theoretical considerations.
Currently, although some studies used the accommodation strategy (e.g., MacLeod & Rutherford, 1992) or the transformation strategy (e.g., Kampman et al., 2002), most studies used the outlier elimination strategy. This strategy has two limitations. First, the selection of absolute values and standard deviation appears to be arbitrary, and varies considerably despite the use of the same RT task. For instance, one study classified RTs less than 160ms and more than 480ms on the dot probe task as outliers (Bradley et al., 2000) whereas another classified RTs less than 100ms and more than 3000ms as outliers (Dalgleish, Moradi, Taghavi, Neshat-Doost, & Yule, 2001). Studies have also excluded RTs more than two (Mogg, Philippot, et al., 2004), two and a half (Fox et al., 2002), and three (Koster et al., 2005) standard deviations above the mean as outliers. Second, the strategy may reduce power (Whelan, 2010) and introduce biases into the sample mean and standard deviation (Ulrich & Miller, 1994). Hence, the outlier elimination strategy should not be used.
Given the limitations of alternative strategies, we recommend the transformation strategy for research. Transformed data are often difficult to interpret (Osborne, 2002). For example, transforming RT to speed reverses the typical interpretation, with higher scores indicative of faster response times instead of slower response times. Therefore, to maintain ease of interpretation, we recommend transforming the RT data using a logarithmic transformation to normalize the distribution and reduce the impact of outliers.
Using the Mean as Summary Statistic
was preliminary in nature and no statistics were published. However, results from another phenomenon in cognitive psychology might prove illuminating.
The word superiority effect demonstrates that individuals are more accurate in identifying a letter when it is embedded in a real word than when it is presented in isolation (Cattell, 1886; Reicher, 1969). The word superiority effect is a well-documented phenomenon (perhaps better documented than attentional bias) and is a staple topic in most cognitive psychology textbooks (e.g., Parkin, 2006). Nevertheless, despite finding evidence of the word superiority effect when the mean was used, close to 50% of the participants in a recent study (n > 500) did not show the effect when individual scores were inspected (Speelman & McGann, 2013).
These results have implications for anxiety interventions. Because attentional bias causes and maintains anxiety (Beck & Clark, 1988; Bower, 1981, 1987), a successful modification of the bias reduces anxiety. This intervention, commonly known as the Attentional Bias Modification program, is effective in reducing trait anxiety and a wide variety of anxiety disorders (see Browning, Holmes, & Harmer, 2010; Hakamata et al., 2010 for reviews). However, it is currently unclear if the intervention should be used for anxious individuals without attentional bias (Bar-Haim, 2010). Furthermore, the effectiveness of the intervention was evaluated using the mean (e.g., Amir, Beard, Burns, & Bomyea, 2009; Hazen, Vasey, & Schmidt, 2009) and a similar problem exists. When individual scores are considered, the interventions might only be effective for anxious individuals with attentional bias. Given these implications, additional analysis should be conducted to clarify the results.
Inspired by the quadrant used to illustrate Type I and II errors, we suggest using a similar quadrant to classify participants (see Table 2). The TBI scoring method can be used to determine if attentional bias is exhibited by a participant. For example, TBI scores can be recoded, with positive and negative scores being indicative of a presence and absence of attentional bias on the dot probe task, respectively. The quadrant clarifies results by identifying the percentage of anxious individuals with or without attentional bias. Subsequently, this could be a new independent variable that could inform intervention research. Nevertheless, this suggestion is only applicable for studies involving clinical participants, where levels of attentional bias are compared between a clinical group and a matched nonanxious control group. However, published studies involving non-clinical populations, where participants were already dichotomized based on their anxiety scores, could use the same quadrant to clarify results.
Table 2
Number of Participants (Percentages) in Each Attentional Bias Category
Attentional Bias Group
Clinically Anxious Nonanxious Control Present
Absent
Count (%)a Count (%)b
Count (%)b Count (%)a
Note. TBI scores are used to determine the presence or absence of attentional bias.
a
Correct classification b
Incorrect classification
Summary
tasks, (b) use GLM or correlation to analyze the data, (c) applying logarithm to RT (i.e., ln RT), and (d) conduct additional analysis to clarify results, respectively. Given the costs associated with anxiety disorders (Andlin-Sobocki & Wittchen, 2005) and the causal role of attentional bias in anxiety, there is a pressing need to improve the quality of attentional bias research. In turn, intervention studies could be built upon a stronger foundation of research to deal with the high prevalence rate of anxiety disorders (Somers et al., 2006).
References
1. Altman, D. G. (2006). The cost of dichotomising continuous variables. British Medical
Journal, 332(7549), 1080–1080. http://doi.org/10.1136/bmj.332.7549.1080
2. Amir, N., Beard, C., Burns, M., & Bomyea, J. (2009). Attention modification program in individuals with generalized anxiety disorder. Journal of Abnormal Psychology, 118(1), 28–33. http://doi.org/10.1037/a0012589
3. Amir, N., Najmi, S., & Morrison, A. S. (2009). Attenuation of attention bias in obsessive– compulsive disorder. Behaviour Research and Therapy, 47(2), 153–157. http://doi.org/10.1016/j.brat.2008.10.020
4. Andlin-Sobocki, P., & Wittchen, H.-U. (2005). Cost of anxiety disorders in Europe. European
Journal of Neurology, 12, 39–44. http://doi.org/10.1111/j.1468-1331.2005.01196.x
5. Austin, P. C., & Brunner, L. J. (2004). Inflation of the type I error rate when a continuous confounding variable is categorized in logistic regression analyses. Statistics in Medicine,
23(7), 1159–1178.
6. Balota, D. A., & Yap, M. J. (2011). Moving beyond the mean in studies of mental chronometry the power of response time distributional analyses. Current Directions in Psychological
Science, 20(3), 160–166. http://doi.org/10.1177/0963721411408885
7. Bar-Haim, Y. (2010). Research review: Attention bias modification (ABM): a novel treatment for anxiety disorders. Journal of Child Psychology and Psychiatry, 51(8), 859–870.
8. Bar-Haim, Y., Lamy, D., Pergamin, L., Bakermans-Kranenburg, M. J., & Van IJzendoorn, M. H. (2007). Threat-related attentional bias in anxious and nonanxious individuals: A meta-analytic study. Psychological Bulletin, 133(1), 1–24.
9. Beck, A. T. (1976). Cognitive therapy and the emotional disorders. New York, NY: International Universities Press.
10. Beck, A. T., & Clark, D. A. (1988). Anxiety and depression: An information processing perspective. Anxiety Research, 1(1), 23–36. http://doi.org/10.1080/10615808808248218
11. Beck, A. T., & Clark, D. A. (1997). An information processing model of anxiety: Automatic and strategic processes. Behaviour Research and Therapy, 35(1), 49–58. http://doi.org/10.1016/S0005-7967(96)00069-1
12. Beckman, R. J., & Cook, R. D. (1983). Outlier...s. Technometrics, 25(2), 119. http://doi.org/10.2307/1268541
13. Bower, G. H. (1981). Mood and memory. American Psychologist, 36(2), 129–148.
14. Bower, G. H. (1987). Commentary on mood and memory. Behaviour Research and Therapy,
25(6), 443–455.
15. Bradley, B. P., Mogg, K., & Millar, N. H. (2000). Covert and overt orienting of attention to emotional faces in anxiety. Cognition & Emotion, 14(6), 789–808. http://doi.org/10.1080/02699930050156636
16. Brosschot, J. F., de Ruiter, C., & Kindt, M. (1999). Processing bias in anxious subjects and repressors, measured by emotional Stroop interference and attentional allocation. Personality
and Individual Differences, 26(5), 777–793.
18. Buckley, T. C., Blanchard, E. B., & Hickling, E. J. (2002). Automatic and strategic processing of threat stimuli: A comparison between PTSD, panic disorder, and nonanxiety controls.
Cognitive Therapy and Research, 26(1), 97–115. http://doi.org/10.1023/A:1013897805918
19. Carrigan, M. H., Drobes, D. J., & Randall, C. L. (2004). Attentional bias and drinking to cope with social anxiety. Psychology of Addictive Behaviors, 18(4), 374–380. http://doi.org/http://dx.doi.org.elibrary.jcu.edu.au/10.1037/0893-164X.18.4.374
20. Cattell, J. M. (1886). The time it takes to see and name objects. Mind, 11(41), 63–65. http://doi.org/10.1093/mind/os-XI.41.63
21. Cisler, J. M., Bacon, A. K., & Williams, N. L. (2007). Phenomenological characteristics of attentional biases towards threat: A critical review. Cognitive Therapy and Research, 33(2), 221–234. http://doi.org/10.1007/s10608-007-9161-y
22. Cisler, J. M., & Koster, E. H. (2010). Mechanisms of attentional biases towards threat in anxiety disorders: An integrative review. Clinical Psychology Review, 30(2), 203–216.
23. Constans, J. I., McCloskey, M. S., Vasterling, J. J., Brailey, K., & Mathews, A. (2004). Suppression of attentional bias in PTSD. Journal of Abnormal Psychology, 113(2), 315–323. http://doi.org/http://dx.doi.org.elibrary.jcu.edu.au/10.1037/0021-843X.113.2.315
24. Conway, A. R. A., Kane, M. J., Bunting, M. F., Hambrick, D. Z., Wilhelm, O., & Engle, R. W. (2005). Working memory span tasks: A methodological review and user’s guide. Psychonomic
Bulletin & Review, 12(5), 769–786. http://doi.org/10.3758/BF03196772
25. Cooper, R. M., & Langton, S. R. H. (2006). Attentional bias to angry faces using the dot-probe task? It depends when you look for it. Behaviour Research and Therapy, 44(9), 1321–1329. 26. Dalgleish, T., Moradi, A. R., Taghavi, M. R., Neshat-Doost, H. T., & Yule, W. (2001). An
experimental investigation of hypervigilance for threat in children and adolescents with post-traumatic stress disorder. Psychological Medicine, 31(03), 541–547. http://doi.org/10.1017/S0033291701003567
27. Dalgleish, T., Taghavi, R., Neshat-Doost, H., Moradi, A., Canterbury, R., & Yule, W. (2003). Patterns of processing bias for emotional information across clinical disorders: A comparison of attention, memory, and prospective cognition in children and adolescents with depression, generalized anxiety, and posttraumatic stress disorder. Journal of Clinical Child & Adolescent
Psychology, 32(1), 10–21. http://doi.org/10.1207/S15374424JCCP3201_02
28. Dandeneau, S. D., Baldwin, M. W., Baccus, J. R., Sakellaropoulo, M., & Pruessner, J. C. (2007). Cutting stress off at the pass: Reducing vigilance and responsiveness to social threat by manipulating attention. Journal of Personality and Social Psychology, 93(4), 651.
29. De Ruiter, C., & Brosschot, J. F. (1994). The emotional Stroop interference effect in anxiety: Attentional bias or cognitive avoidance? Behaviour Research and Therapy, 32(3), 315–319. 30. DuPont, R. L., Rice, D. P., Miller, L. S., Shiraki, S. S., Rowland, C. R., & Harwood, H. J.
(1996). Economic costs of anxiety disorders. Anxiety, 2(4), 167–172. http://doi.org/10.1002/(SICI)1522-7154(1996)2:4<167::AID-ANXI2>3.0.CO;2-L
31. Egloff, B., & Hock, M. (2001). Interactive effects of state anxiety and trait anxiety on emotional Stroop interference. Personality and Individual Differences, 31(6), 875–882. http://doi.org/10.1016/S0191-8869(00)00188-4
32. Egloff, B., & Hock, M. (2003). Assessing attention allocation toward threat-related stimuli: A comparison of the emotional Stroop task and the attentional probe task. Personality and
Individual Differences, 35(2), 475–483. http://doi.org/10.1016/S0191-8869(02)00265-9
33. Eide, P., Kemp, A., Silberstein, R. B., Nathan, P. J., & Stough, C. (2002). Test-retest reliability of the emotional Stroop task: Examining the paradox of measurement change. The Journal of
Psychology: Interdisciplinary and Applied, 136(5), 514–520.
http://doi.org/10.1080/00223980209605547
patients with posttraumatic stress disorder. Journal of Abnormal Psychology, 113(2), 289–301. http://doi.org/http://dx.doi.org.elibrary.jcu.edu.au/10.1037/0021-843X.113.2.289
35. Eysenck, M. W., Derakshan, N., Santos, R., & Calvo, M. G. (2007). Anxiety and cognitive performance: Attentional control theory. Emotion, 7(2), 336–353.
36. Ferguson, C. J., & Heene, M. (2012). A vast graveyard of undead theories publication bias and psychological science’s aversion to the null. Perspectives on Psychological Science, 7(6), 555– 561. http://doi.org/10.1177/1745691612459059
37. Fox, E. (1993). Attentional bias in anxiety: Selective or not? Behaviour Research and Therapy,
31(5), 487–493.
38. Fox, E. (2002). Processing emotional facial expressions: The role of anxiety and awareness.
Cognitive, Affective, & Behavioral Neuroscience, 2(1), 52–63.
http://doi.org/10.3758/CABN.2.1.52
39. Fox, E., Russo, R., Bowles, R., & Dutton, K. (2001). Do threatening stimuli draw or hold visual attention in subclinical anxiety? Journal of Experimental Psychology, 130,(4,), 681–700.
40. Fox, E., Russo, R., & Dutton, K. (2002). Attentional bias for threat: Evidence for delayed disengagement from emotional faces. Cognition & Emotion, 16(3), 355–379. http://doi.org/10.1080/02699930143000527
41. Gotlib, I. H., Krasnoperova, E., Yue, D. N., & Joormann, J. (2004). Attentional biases for negative interpersonal stimuli in clinical depression. Journal of Abnormal Psychology, 113(1), 127–135. http://doi.org/http://dx.doi.org.elibrary.jcu.edu.au/10.1037/0021-843X.113.1.121 42. Greenwald, A. G., Nosek, B. A., & Banaji, M. R. (2003). Understanding and using the Implicit
Association Test: I. An improved scoring algorithm. Journal of Personality and Social
Psychology, 85(2), 197–216. http://doi.org/10.1037/0022-3514.85.2.197
43. Hakamata, Y., Lissek, S., Bar-Haim, Y., Britton, J. C., Fox, N. A., Leibenluft, E., … Pine, D. S. (2010). Attention bias modification treatment: A meta-analysis toward the establishment of novel treatment for anxiety. Biological Psychiatry, 68(11), 982–990.
44. Harkness, E. L., Harris, L. M., Jones, M. K., & Vaccaro, L. (2009). No evidence of attentional bias in obsessive compulsive checking on the dot probe paradigm. Behaviour Research and
Therapy, 47(5), 437–443. http://doi.org/10.1016/j.brat.2009.02.004
45. Hazen, R. A., Vasey, M. W., & Schmidt, N. B. (2009). Attentional retraining: A randomized clinical trial for pathological worry. Journal of Psychiatric Research, 43(6), 627–633. http://doi.org/10.1016/j.jpsychires.2008.07.004
46. Johnsen, B. H., Thayer, J. F., Laberg, J. C., Wormnes, B., Raadal, M., Skaret, E., … Berg, E. (2003). Attentional and physiological characteristics of patients with dental anxiety. Journal of
Anxiety Disorders, 17(1), 75–87. http://doi.org/10.1016/S0887-6185(02)00178-0
47. Jones, G. V., Stacey, H., & Martin, M. (2002). Exploring the intensity paradox in emotional stroop interference. Cognitive Therapy and Research, 26(6), 831–839. http://doi.org/10.1023/A:1021297602253
48. Kampman, M., Keijsers, G. P. J., Verbraak, M. J. P. M., Näring, G., & Hoogduin, C. A. L. (2002). The emotional Stroop: a comparison of panic disorder patients, obsessive–compulsive patients, and normal controls, in two experiments. Journal of Anxiety Disorders, 16(4), 425– 441. http://doi.org/10.1016/S0887-6185(02)00127-5
49. Keogh, E., Dillon, C., Georgiou, G., & Hunt, C. (2001). Selective attentional biases for physical threat in physical anxiety sensitivity. Journal of Anxiety Disorders, 15(4), 299–315. http://doi.org/10.1016/S0887-6185(01)00065-2
50. Keogh, E., Ellery, D., Hunt, C., & Hannent, I. (2001). Selective attentional bias for pain-related stimuli amongst pain fearful individuals. Pain, 91(1–2), 91–100. http://doi.org/10.1016/S0304-3959(00)00422-X
Stroop task. Personality and Individual Differences, 21(5), 653–661. http://doi.org/10.1016/0191-8869(96)00133-X
52. Koster, E. H. W., Crombez, G., Verschuere, B., & De Houwer, J. (2004). Selective attention to threat in the dot probe paradigm: Differentiating vigilance and difficulty to disengage.
Behaviour Research and Therapy, 42(10), 1183–1192.
53. Koster, E. H. W., Crombez, G., Verschuere, B., Van Damme, S., & Wiersema, J. R. (2006). Components of attentional bias to threat in high trait anxiety: Facilitated engagement, impaired disengagement, and attentional avoidance. Behaviour Research and Therapy, 44(12), 1757– 1771.
54. Koster, E. H. W., Verschuere, B., Crombez, G., & Van Damme, S. (2005). Time-course of attention for threatening pictures in high and low trait anxiety. Behaviour Research and
Therapy, 43(8), 1087–1098.
55. Larsen, R. J., Mercer, K. A., & Balota, D. A. (2006). Lexical characteristics of words used in
emotional Stroop experiments. Emotion, 6(1), 62–72.
http://doi.org/http://dx.doi.org.elibrary.jcu.edu.au/10.1037/1528-3542.6.1.62
56. Lépine, J.-P. (2002). The epidemiology of anxiety disorders: Prevalence and societal costs.
Journal of Clinical Psychiatry, 63(Suppl14), 4–8.
57. Lipp, O. V., & Derakshan, N. (2005). Attentional bias to pictures of fear-relevant animals in a dot probe task. Emotion, 5(3), 365–369. http://doi.org/10.1037/1528-3542.5.3.365
58. MacCallum, R. C., Zhang, S., Preacher, K. J., & Rucker, D. D. (2002). On the practice of dichotomization of quantitative variables. Psychological Methods, 7(1), 19.
59. MacLeod, C., Mathews, A., & Tata, P. (1986). Attentional bias in emotional disorders. Journal
of Abnormal Psychology, 95(1), 15–20.
60. MacLeod, C., & Rutherford, E. M. (1992). Anxiety and the selective processing of emotional information: Mediating roles of awareness, trait and state variables, and personal relevance of stimulus materials. Behaviour Research and Therapy, 30(5), 479–491.
61. MacLeod, C., Rutherford, E. M., Campbell, L., Ebsworthy, G., & Holker, L. (2002). Selective attention and emotional vulnerability: Assessing the causal basis of their association through the experimental manipulation of attentional bias. The Journal of Abnormal Psychology,
111(1), 107–123. http://doi.org/http://dx.doi.org.elibrary.jcu.edu.au/10.1037/0021-843X.111.1.107
62. MacLeod, C., Soong, L. Y., Rutherford, E. M., & Campbell, L. (2007). Internet-delivered assessment and manipulation of anxiety-linked attentional bias: Validation of a free-access attentional probe software package. Behavior Research Methods, 39(3), 533–538.
63. Mathews, A., & Mackintosh, B. (1998). A cognitive model of selective processing in anxiety.
Cognitive Therapy and Research, 22(6), 539–560.
64. Mathews, A., & MacLeod, C. (1985). Selective processing of threat cues in anxiety states.
Behaviour Research and Therapy, 23(5), 563–569.
http://doi.org/10.1016/0005-7967(85)90104-4
65. Mobini, S., & Grant, A. (2007). Clinical implications of attentional bias in anxiety disorders: An integrative literature review. Psychotherapy: Theory, Research, Practice, Training, 44(4), 450–462. http://doi.org/http://dx.doi.org.elibrary.jcu.edu.au/10.1037/0033-3204.44.4.450 66. Mogg, K., & Bradley, B. P. (1998). A cognitive-motivational analysis of anxiety. Behaviour
Research and Therapy, 36(9), 809–848.
67. Mogg, K., & Bradley, B. P. (1999). Orienting of attention to threatening facial expressions presented under conditions of restricted awareness. Cognition & Emotion, 13(6), 713–740. 68. Mogg, K., Bradley, B. P., Dixon, C., Fisher, S., Twelftree, H., & McWilliams, A. (2000). Trait
69. Mogg, K., Bradley, B. P., Miles, F., & Dixon, R. (2004). Time course of attentional bias for threat scenes: Testing the vigilance‐avoidance hypothesis. Cognition & Emotion, 18(5), 689– 700. http://doi.org/10.1080/02699930341000158
70. Mogg, K., Bradley, B. P., & Williams, R. (1995). Attentional bias in anxiety and depression: The role of awareness. British Journal of Clinical Psychology, 34(1), 17–36. http://doi.org/10.1111/j.2044-8260.1995.tb01434.x
71. Mogg, K., Bradley, B. P., Williams, R., & Mathews, A. (1993). Subliminal processing of emotional information in anxiety and depression. Journal of Abnormal Psychology, 102(2), 304–311. http://doi.org/http://dx.doi.org.elibrary.jcu.edu.au/10.1037/0021-843X.102.2.304 72. Mogg, K., Philippot, P., & Bradley, B. P. (2004). Selective attention to angry faces in clinical
social phobia. Journal of Abnormal Psychology, 113(1), 160.
73. Naggara, O., Raymond, J., Guilbert, F., Roy, D., Weill, A., & Altman, D. G. (2011). Analysis by categorizing or dichotomizing continuous variables is inadvisable: an example from the natural history of unruptured aneurysms. American Journal of Neuroradiology, 32(3), 437–440. http://doi.org/10.3174/ajnr.A2425
74. Öhman, A. (1993). Fear and anxiety as emotional phenomena: Clinical phenomenology, evolutionary perspectives, and information-processing mechanisms. In M. Lewis & J. M. Haviland (Eds.), Handbook of emotions (pp. 511–536). New York: Guilford Press.
75. Olatunji, B. O., Sawchuk, C. N., Lee, T. C., Lohr, J. M., & Tolin, D. F. (2008). Information processing biases in spider phobia: Application of the Stroop and “White Noise” Paradigm.
Journal of Behavior Therapy and Experimental Psychiatry, 39(2), 187–200.
http://doi.org/10.1016/j.jbtep.2007.03.002
76. Osborne, J. (2002). Notes on the use of data transformations. Practical Assessment, Research &
Evaluation, 8(6). Retrieved from http://pareonline.net/getvn.asp?v=8&n=6
77. Parkin, A. J. (2006). Essentials of cognitive psychology. Hove, East Sussex: Psychology Press. 78. Phaf, R. H., & Kan, K.-J. (2007). The automaticity of emotional Stroop: A meta-analysis.
Journal of Behavior Therapy and Experimental Psychiatry, 38(2), 184–199.
http://doi.org/10.1016/j.jbtep.2006.10.008
79. Puliafico, A. C., & Kendall, P. C. (2006). Threat-related attentional bias in anxious youth: A review. Clinical Child and Family Psychology Review, 9(3-4), 162–180. http://doi.org/10.1007/s10567-006-0009-x
80. Ratcliff, R. (1993). Methods for dealing with reaction time outliers. Psychological Bulletin,
114(3), 510–532. http://doi.org/http://dx.doi.org.elibrary.jcu.edu.au/10.1037/0033-2909.114.3.510
81. Reicher, G. M. (1969). Perceptual recognition as a function of meaningfulness of stimulus material. Journal of Experimental Psychology, 81(2), 275.
82. Royston, P., Altman, D. G., & Sauerbrei, W. (2006). Dichotomizing continuous predictors in multiple regression: A bad idea. Statistics in Medicine, 25(1), 127–141.
83. Salemink, E., van den Hout, M. A., & Kindt, M. (2007). Selective attention and threat: Quick orienting versus slow disengagement and two versions of the dot probe task. Behaviour
Research and Therapy, 45(3), 607–615. http://doi.org/10.1016/j.brat.2006.04.004
84. Schmukle, S. C. (2005). Unreliability of the dot probe task. European Journal of Personality,
19(7), 595–605. http://doi.org/10.1002/per.554
85. Siegel, S., & Castellan, N. J. (1988). Nonparametric statistics for the behavioral sciences. New York: McGraw-Hill.
86. Siegrist, M. (1997). Test-retest reliability of different versions of the Stroop test. The Journal of
Psychology, 131(3), 299–306. http://doi.org/10.1080/00223989709603516
87. Somers, J. M., Goldner, E. M., Waraich, P., & Hsu, L. (2006). Prevalence and incidence studies of anxiety disorders: A systematic review of the literature. Canadian Journal of Psychiatry,
88. Speelman, C. P., & McGann, M. (2013). How mean is the mean? Frontiers in Psychology,
4(451), 1–12. http://doi.org/10.3389/fpsyg.2013.00451
89. Spielberger, C. D., Gorsuch, R. L., & Lushene, R. E. (1970). Manual for the state-trait anxiety
inventory. Palo Alto, CA: Consulting Psychologists Press.
90. Staugaard, S. R. (2009). Reliability of two versions of the dot-probe task using photographic faces. Psychology Science Quarterly, 51(3), 339–350.
91. Strauss, G. P., Allen, D. N., Jorgensen, M. L., & Cramer, S. L. (2005). Test-retest reliability of standard and emotional Stroop tasks an investigation of color-word and picture-word versions.
Assessment, 12(3), 330–337. http://doi.org/10.1177/1073191105276375
92. Stroop, J. R. (1935). Studies of interference in serial verbal reactions. Journal of Experimental
Psychology, 18, 643–662.
93. Taylor, A. (2011). Using the GLM procedure in SPSS. Retrieved March 5, 2014, from psy.mq.edu.au/psystat/documents/GLMSPSS.pdf
94. Ulrich, R., & Miller, J. (1994). Effects of truncation on reaction time analysis. Journal of
Experimental Psychology: General, 123(1), 34–80.
http://doi.org/http://dx.doi.org.elibrary.jcu.edu.au/10.1037/0096-3445.123.1.34
95. Van Bockstaele, B., Verschuere, B., Tibboel, H., De Houwer, J., Crombez, G., & W, H. (2014). A review of current evidence for the causal impact of attentional bias on fear and anxiety.
Psychological Bulletin, 140(3), 682–721. http://doi.org/10.1037/a0034834
96. Wagenmakers, E.-J., Wetzels, R., Borsboom, D., Maas, H. L. J. van der, & Kievit, R. A. (2012). An agenda for purely confirmatory research. Perspectives on Psychological Science,
7(6), 632–638. http://doi.org/10.1177/1745691612463078
97. Wells, A., & Matthews, G. (1994). Attention and emotion: A Clinical Perspective. Hillsdale, NJ: Lawrence Erlbaum Associates.
98. Whelan, R. (2010). Effective analysis of reaction time data. The Psychological Record, 58(3), 475–482.
99. Wilcox, R. R. (1998). How many discoveries have been lost by ignoring modern statistical methods?AmericanPsychologist,53(3),300–314.
http://doi.org/http://dx.doi.org.elibrary.jcu.edu.au/10.1037/0003-066X.53.3.300
100. Willams, J. M., Watts, F. N., MacLeod, C., & Mathews, A. (1988). Cognitive psychology and
emotional disorders. Chichester: Wiley.
101. Williams, J. M., Mathews, A., & MacLeod, C. (1996). The emotional Stroop task and psychopathology. Psychological Bulletin, 120(1), 3–24.
102. Yiend, J., & Mathews, A. (2001). Anxiety and attention to threatening pictures. The Quarterly
Journal of Experimental Psychology, 54(3), 665–681.
103. Zimmerman, D. W. (1995). Increasing the power of nonparametric tests by detecting and downweighting outliers. The Journal of Experimental Education, 64(1), 71–78.
104. Zimmerman, D. W. (1998). Invalidation of parametric and nonparametric statistical tests by concurrent violation of two assumptions. The Journal of Experimental Education, 67(1), 55– 68.
Number of Tables: 2 Number of Figures: 3