Contents
Executive Summary ... 1
1 Introduction ... 5
1.1 Context ... 5
1.2 Project objectives ... 5
1.3 Project phases ... 6
1.4 Project stages and expected participation ... 6
1.4.1 Stage 1—Two day Professional Learning conference for school leaders ...6
1.4.2 Stage 2—Implementation with coaching support ...7
1.4.3 Stage 3 –One day workshop for school leaders...8
1.5 Structure of this report ... 8
2 Evaluating the Program ... 10
2.1 Data collection instruments ... 10
2.2 Data analysis ... 11
3 Satisfaction Ratings ... 12
3.1 Respondents ... 12
3.2 Two day conference satisfaction ... 13
3.2.1 Overall satisfaction by position ...15
3.2.2 Satisfaction rating differences ...16
3.2.3 Regional differences ...19
3.2.4 Agreement with comments...20
3.2.5 Three most effective aspects of the two day conference ...21
3.2.6 Three least effective aspects of the two day conference ...22
3.2.7 Question 5—Three strategies to utilise in your school to implement Junior Secondary practices ...24
3.3 One day workshop evaluation ... 26
3.3.1 Overall rating and comments for one day workshop ...27
3.3.2 Agreement with comments...29
3.3.3 Three most effective aspects of the one day workshop ...29
3.3.4 What suggestions do you have for improvement of the one day workshop ...31
3.3.5 What specific strategies from today might you utilise in your school ...33
3.4 Coaching program evaluation ... 34
3.4.1 Agreement with comments...35
3.5 Overall program ... 36
3.5.1 Agreement with comments...40
4 The effectiveness of professional learning survey ... 41
4.1 Method ... 41
4.2 Measuring the effectiveness of professional learning ... 41
4.3 Findings—two day conference... 42
4.3.1 Duration ...43
4.3.2 Content focus ...45
4.3.3 Active learning ...47
4.3.4 Collective participation ...49
4.3.5 Coherence ...50
4.4 Findings—one day workshop ... 52
4.4.1 Duration ...52
4.4.2 Content focus ...53
4.4.3 Active learning ...54
4.4.4 Collective participation ...54
4.4.5 Coherence ...55
4.5 Comparison of two day conference and one day workshops ... 55
5 Readiness for Year 7 and Junior Secondary ... 56
5.1 School Preparedness ... 56
5.2 Leaders’ perceptions of teacher efficacy ... 58
5.2.1 Teacher efficacy ...58
5.2.2 Leaders’ perceptions of teacher efficacy ...59
5.2.3 Changes in leaders’ perceptions of teacher efficacy ...60
5.3.1 Description of activity ...61
6 Implications and recommendations ... 66
6.1 Internal—Interim report ... 66
6.1.1 Recommendation 1 ...66
6.2 External—Interim report ... 67
6.2.1 Recommendation 1 ...67
6.2.2 Recommendation 2 ...67
6.3 Final report recommendations ... 67
6.3.1 Recommendation 1 ...67
6.3.2 Recommendation 2 ...67
6.3.3 Recommendation 3 ...67
6.3.4 Recommendation 4 ...67
Tables
Table 1.1 Project Phases ...6
Table 1.2 Project Stages...6
Table 1.3 Expected participants by region ...6
Table 3.1 Respondent position and response rates by region for the two day conference and one day workshop ...12
Table 3.2 Number of respondents for the Coaching program and Program overall evaluations ...13
Table 3.3 Two day conference satisfaction ratings, number of participants, means and standard deviations by region ...14
Table 3.4 Mean differences between regions’ two day conference satisfaction rating ...15
Table 3.5 Emergent themes, connectivities and the underlying concepts in comparing low and high satisfaction ratings ...16
Table 3.6 Participant agreement with the three items seeking feedback on the two day conference ...20
Table 3.7 Participant agreement with I have a greater understanding of Junior Secondary ...20
Table 3.8 Participant agreement with The content and delivery of the workshops met my needs ...21
Table 3.9 Participant agreement with The processes and activities used by the facilitators were effective ...21
Table 3.10 One day workshop evaluation ratings, number of respondents, means and standard deviations by region ...26
Table 3.11 Participant agreement with the comments related to the one day workshop ...29
Table 3.12 Coaching participation ...34
Table 3.13 Webinar topics , attendance and post viewing frequency ...34
Table 3.14 Coaching program evaluation ratings, number of respondents, means and standard deviations by region ...35
Table 3.15 Participant agreement with the comments related to the coaching program ...36
Table 3.16 Ratings of the overall program, number of respondents, means and standard deviations by region ...36
Table 3.17 Participant agreement with the comments related to the overall program ...40
Table 4.1 Means by region and overall assessing duration (two day conference) ...43
Table 4.2 Means by region and overall: assessing content focus (two day conference) ...45
Table 4.3 Means by region and overall: assessing active learning (two day conference) ...47
Table 4.4 Means by region and overall: assessing collective participation (two day conference) ...49
Table 4.5 Means by region and overall: assessing coherence (two day conference) ...51
Table 4.6 Means by region and overall assessing duration (one day workshop) ...53
Table 4.7 Means by region and overall assessing content focus (one day workshop) ...53
Table 4.8 Means by region and overall assessing active learning (one day workshop) ...54
Table 4.9 Means by region and overall assessing collective participation (one day workshop) ...54
Table 4.10 Means by region and overall assessing coherence (one day workshop) ...55
Table 4.11 Comparison of two day conference and one day workshops ...55
Table 5.1 Number of respondents, mean school preparedness rating and SD by region ...56
Table 5.2 Perceived Educational Change Model stage by region ...57
Table 5.3 Six subscales of the Norwegian Teacher Self-Efficacy Scale (two day conference and the one day workshop) ...59
Table 5.4 Leaders’ perceptions of teacher efficacy ...60
Table 5.5 Specific practice perceptions of school leaders in Metropolitan region...61
Table 5.6 Specific practice perceptions of school leaders in Far North Queensland region...62
Table 5.7 Specific practice perceptions of school leaders in North Queensland region ...62
Table 5.8 Specific practice perceptions of school leaders in Central Queensland region ...63
Table 5.9 Specific practice perceptions of school leaders in North Coast region ...63
Table 5.10 Specific practice perceptions of school leaders in Darling Downs South West Queensland region ...64
Figures
Figure 1.1 Overview of Junior Secondary Leading Change Development ...7
Figure 3.1 Two day conference satisfaction ratings by region ...14
Figure 3.2 Thematic analysis of two day conference participants with low (ratings 1–5) and high (ratings 6–10) overall satisfaction ...16
Figure 3.3 Thematic analysis from the low and high rating region groups ...19
Figure 3.4 Thematic analysis of the most effective elements of the two day conference ...22
Figure 3.5 Thematic analysis of responses to the least effective elements of the conference ...23
Figure 3.6 Thematic analysis of responses to what schools will focus on when they get back to school ...25
Figure 3.7 One day workshop ratings by region ...27
Figure 3.8 Thematic analysis of responses explaining the One day workshop ratings ...28
Figure 3.9 Thematic analysis of responses regarding the three most effective aspects of the one day workshop ...30
Figure 3.10 Thematic analysis of responses for improvement of the one day workshop ...32
Figure 3.11 Thematic analysis of responses: What specific strategies from the one day workshop might you use in your school?...33
Figure 3.12 Coaching program ratings by region ...35
Figure 3.13 Overall program ratings by region ...37
Figure 3.14 Thematic analysis of responses what three strategies will you employ when you return to school after engaging in the full program ...38
Figure 4.1 The core conceptual framework (Desimone, 2009, p. 185) ...41
Figure 4.2 Thematic analysis of the comments on Duration (two day conference) ...44
Figure 4.3 Thematic analysis of the comments on Content Focus (two day conference) ...46
Figure 4.4 Thematic analysis of the comments on Active Learning (two day conference) ...48
Figure 4.5 Thematic analysis of the comments on collective participation (two day conference) ...50
Figure 4.6 Thematic analysis of the comments around Coherence (two day conference)...51
Figure 5.1 Thematic analysis of responses explaining school preparedness rating ...57
Figure 5.2 Thematic analysis of responses explaining stage of the Educational Change Model ...58
Appendices
Appendix A Leading Change Development team ...70Appendix B Leading Change program stages ...73
Appendix C Overall satisfaction—2 day conference ...81
Appendix D Measuring the effectiveness of the Junior Secondary Leading Change Program ...82
Appendix E Leaders Perceptions of Teacher Efficacy—Quality Teaching in Junior Secondary ...85
Appendix F Quality Teaching—School leaders perceptions of embedded practices...88
Abbreviations and key terms
Term / abbreviation Definition
Active Learning The opportunity to engage in discussion, planning and practice
Coherence Connection between professional development activity and day-to-day classroom experiences Collective Participation The opportunity to undertake professional development with colleagues
Content Focus Necessary knowledge and skills for day-to-day classroom work
CQ Central Queensland region
DDSWQ Darling Downs South West Queensland region Duration Was the professional development of sufficient length
ECM Educational Change Model
FN Far North Queensland region
JS Junior Secondary
Leximancer Qualitative or text analysis software
M Mean
ME Metropolitan region
N Total number of participants two day 685, one day 421
n Number of participants who responded
NC North Coast region
NQ North Queensland region
PD Professional development
SD Standard deviation
SE South East region
SPSS Statistical analysis software
Teacher efficacy The ability and belief of teachers to be effective
Executive Summary
The Junior Secondary Leading Change Development Program was commissioned by the Department of Education, Training and Employment. It aimed to provide state high school leadership teams with a comprehensive program that built on their already strong capacity to lead effective change for the shift in 2015 of Year 7 into high school and the implementation of the Junior Secondary initiative. Seven hundred and ninety-five participants comprised of 3 person leadership teams including the school principal from 265 schools from across the state were expected to participate. The Department of Education, Training and Employment showed a commitment to being well-prepared and ready to welcome Year 7 students as well as ensuring continuity and growth in the area of Junior Secondary philosophy and development. The Leading Change Program was designed to deliver quality materials and facilitation based on:
• building on school leadership team capacity to lead change
• supporting leadership teams in introducing Junior Secondary in all high schools
• providing support to leadership teams in further developing Action Plans for this transition
• ensuring all high schools are ready for the commencement of Year 7 from January 2015 The program was delivered in three stages: 1) two day professional learning conferences for school leaders; 2) implementation with coaching support; 3) one day workshops for school leaders.
This final report provides: a summation of attendees and schools; collation and analysis of information from final workshops; issues raised throughout the program; recommendations for improvement; findings of the Interim Evaluation Report; level of readiness for enrolling Year 7 students to high school in 2015; and level of readiness for the introduction of Junior Secondary.
The two day conference was designed to enable leadership teams from across the state to participate in planned sessions based on the above aims. Two hundred and fifty-nine (259) schools were involved in the 7 conferences held in the 7 regions around the state. For the purpose of the conferences, the delivery team developed a comprehensive suite of resources that were made available to all schools via provision of a loaded USB device for each school and access to a purpose-built interactive website. Resources provided theoretical information and evidence related to adolescent learners, the Six Guiding Principles, the Educational Change Model, and quality teaching that could be shared and implemented within their schools and communities. Information, PowerPoint presentations and activities were developed for 28 topics. Leadership teams were informed that they were able to use or adapt these resources to best suit their contexts. During the two day conference, evaluation tools were administered to gather evidence regarding: each leadership teams’ perceptions of a) the efficacy of their teachers to teach in Junior Secondary; b) their school’s stage of reform based on the Educational Change Model; and c) the effectiveness of the conference program itself as a form of professional learning.
response for overall satisfaction was 8 out of 10, indicating participants were satisfied with the two day conference.
Participants were also asked about a number of key elements pertaining to the two day conference. These elements were: duration, content focus, active learning, collective participation, and coherence. Generally the positive responses focused on the benefit of having the time to work with colleagues on Action Plans for the Junior Secondary Initiative, the effective resources that focused on the adolescent learner, and the flexible structure allowing effective team work. The least effective aspects of the two day conference were reported as time away from schools (including large travel distances for some regions), uncertainty of task expectations, timing of the conference, and generalisability of some of the materials for school contexts.
In relation to the survey of the leadership teams’ perceptions of their teaching teams’ efficacy, the participants were asked to rate their teachers in terms of their readiness to teach Junior Secondary. Six dimensions were measured, namely: instruction, adapting education to individual students’ needs, motivating students, keeping discipline, cooperating with colleagues and parents, and coping with changes and challenges. Generally the leadership teams showed positive perceptions of their teaching teams in most areas, with cooperating with colleagues and parents being the highest and motivating students the lowest ranking scores.
The implementation phase supported by coaching followed the two day conferences. Each school
had the opportunity to participate in a coaching process though the original design was mandatory participation. All 259 schools were placed in 22 clusters that were negotiated with regional representatives. Each cluster included approximately 10 schools and was allocated two professional coaches. For 3–4 months the coaches were available for direct support and, in particular, to assist schools with their Junior Secondary Action Plans as well as providing feedback and advice on three structured milestones. These documents were designed as a focused reflection tool for schools to consider progress to date, revisit goals and responsibilities and seek feedback. Once schools uploaded their documents to the Leading Change Website, coaches would access the documents and provide written feedback which included comments, recommendations for future direction, or provided additional resources. In addition to the coaching process, four webinars were presented on topics that were most frequently requested by school leaders during the two day conferences. Of the 259 schools, 114 (44%) engaged in Milestone 1; 71 (25%) in Milestone 2; and 60 (23%) in Milestone 3. Regional engagement ranged widely, from 71% to 10% on various milestones. The overall satisfaction for the coaching from participants who completed the survey administered at the one day conference (88 responses) was an overall mean of 7.2 out of 10 and mode of 8 out of 10. This indicates that the most common response for overall satisfaction was 8 out of 10, indicating participants were satisfied with the coaching program.
The one day workshop delivered in 7 regions constituted the final phase of the Leading Change. The
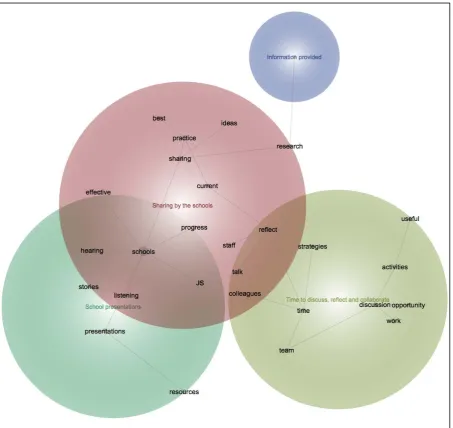
one day workshops were structured around the concept of Best Practice, with a focus on three key themes: Transition; Quality Teaching; and, Evidence-based Practice. Sessions throughout the day were structured around Best Practice for the theme followed by presentations from selected schools in each region to share effective practice on the theme. Following school presentations, school leadership teams engaged in activities that provided them with the structure and tools to reflect on different aspects of their school’s progress in each area and to consider other strategies that may further support or enhance their Junior Secondary program. Schools were given opportunities to network and to share their successes in their program implementation efforts.
day conference. Other positive feedback from the one day workshop referred to the activities and resources developed by the Leading Change Development team that provided direction and opportunities for school leaders to reflect on their progress and revisit their Action Plans to determine future directions. The participants found that these tools were an effective way to assess current practices and use as an audit tool to measure progress to date and set further goals for improvement practices. School leaders also reported the value in the strong links between the theory and practice reported by schools. The timing of the one day workshop was mentioned again as being too late in the Junior Secondary planning journey, however, despite the lateness of the program, many reported that the information was affirming and helpful in consolidating their Action plans for the implementation of their Junior Secondary programs.
With regard to readiness, one day workshop participants were asked to rate their school’s preparedness for Year 7 and Junior Secondary on a scale of 1 (completely unprepared) to 10 (completely prepared). Darling Downs South West Queensland region self-reported the lowest mean rating (M = 8.0, SD = 1.3) and North Coast region the highest mean rating (M = 8.7, SD = 0.8) with an overall mean of 8.3. An ANOVA analysis revealed no statistically significant difference in perceived school preparedness by region (Darling Downs SWQ, Metropolitan, South East, Far North Queensland, Central Queensland and North Coast), position (Principal, Deputy Principal, Head of Junior Secondary and other) or school type (P—9/10, P-12, 7-12, 8-12 and other).
Also related to readiness, participants were asked their opinion, with supporting evidence, of their school’s stage in the Educational Change Model. Two-hundred and forty-seven (247) schools provided a response with 54 (22%) at Initiation; 152 (61%) at Development; and 42 (17%) at the Consolidation stage. They also self-reported the level of preparedness of their teachers with regard to their efficacy to deliver Junior Secondary. A total of 245 and 145 responses were collected at the two day conference and one day workshops respectively. The items on the six subscales were scored ranging from a minimum score of 0 to a maximum score of 6. A higher score indicates the belief on the part of the leadership team that their staff are more capable in each subscale. At the beginning of the program (i.e., at the two day conference) overall, leadership teams across the state rated their teachers lowest (M = 3.4, SD = 0.9) on their ability to motivate students, and highest (M = 4.4,
SD = 0.83) on their ability to cooperate with colleagues and parents. At the end of the Program (i.e., at the one day workshop) the lowest overall mean had risen to 3.7 and was observed in the dimensions of motivating students, and adapting education to individual students’ needs. No statistically significant difference was detected between regions in any of the six scales.
Finally, during the one day workshop, school leaders participated in an activity that scaffolded reflection, analysis and evaluation of school activities against what is considered to be best practice to enable Quality Teaching. The activity was designed by aligning best practice, key elements and the Guiding Principles for Quality Teaching in Junior Secondary against Leadership practices, Teaching practices and Student learning behaviours. School leaders determined an agreed rating (1 None/minimal; 2 Solid progress; 3 Embedded; provide example) as to how embedded each of the identified features was in their school. Results for each school were then collated onto a wall chart which combined the feedback for each region. A number of trends emerged within and across regions that are worth noting:
l
eadership practices across all regions were reported to have made more solid progress or be more embedded than teaching practices and student learning behaviours; the specific practices that were perceived to be embedded most successfully at the time of the one day workshop for all regions were: sustained individual attention in a safe and healthy school environment; extended contact with a small number of teachers a consistent school cohort; andauthentic and reflective assessment with high expectations; and, the specific practices that were
perceived to be embedded least successfully at the time of the one day workshop for all regions were: higher order thinking strategies; integrated and disciplinary curricula that are negotiated, relevant and challenging; and parent and community involvement in student learning.
pertaining to the one day workshop with positive responses focused on the benefit of listening to other schools’ strategies for effective practice around Junior Secondary, an awareness and access to the theory underpinning the practices, and opportunities to work with colleagues and network with other schools. The least effective aspects of the one day conference were reported was to be time
including the timing of the workshop, and insufficient time to work on some of the activities.
Participants were also asked to rate their overall satisfaction of the whole Leading Change Program including: the two day conference; the coaching process; webinars; and the one day workshop. Overall, the 278 respondents were satisfied with the program with a mean rating of 6.9 out of 10 and mode of 7 out of 10. This indicates that the most common response for overall satisfaction was 7 out of 10. Respondents’ explanations of their rating overwhelmingly valued the content of the program including the balance between theory and practice as well as perceiving that the process provided valuable opportunities for reflection and constant monitoring and updating of Action Plans. However, respondents noted that the timing of the overall program was late in the process of reform and time away from schools to attend the two day conference and one day workshop was also too late to be arranged.
Final recommendations, developed from the data collected across all stages of the program, recommend that: (1) the model of delivery worked effectively and that the Leading Change Program design be considered to be an exemplar for future projects; (2) similar projects be delivered as soon as practicable, maximising benefits; (3) support be provided throughout all stages of reform and not only in the preliminary stages; and (4) ongoing study and analysis of initiatives should be implemented concurrently with reform implementation to ensure the effectiveness of reform initiatives and improvement in student outcomes.
1
Introduction
1.1
Context
The Flying Start initiative (ACER, 2011) mandated that all Year 7 students in both government and non-government schools move into high school from 2015. As part of this initiative, a series of professional development programs has been rolled out for both teachers who will be teaching in Junior Secondary, and for school leaders who are responsible for the successful implementation and effective sustainability of programs. The introduction of the Australian Professional Standards for Teachers (AITSL, 2011) and the subsequent release of The Australian Charter for the Professional Learning of Teachers and School Leaders (The Charter) (AITSL, 2012), Continuing Professional Development (CPD) has become an integral part of the professional lives of Australian teachers and school leaders. The Charter affirms that there is “clear evidence that purposeful professional learning for teachers and school leaders is one of the most effective strategies for improving student outcomes in our schools” (p. 6).
To ensure a smooth transition, the Queensland Government has planned a comprehensive and integrated package of measures to ensure that school leaders have the skills and resources necessary to implement and sustain the successful introduction of Junior Secondary. One significant measure is the delivery of the Junior Secondary Leading Change Program. This Program is a key element designed to support school leaders as they work through the reforms in Junior Secondary.
The Department of Education, Training and Employment commissioned a team from Griffith University and including external partners, the Leading Change Development team (see Appendix A), to deliver the Junior Secondary Leading Change Development Program.
1.2
Project objectives
The key objective of the Junior Secondary Leading Change Development Program was to provide state high school leadership teams with a program to build their capability to lead effective change processes in schools, specifically in preparation for the transition of Year 7 to Junior Secondary by the start of 2015.
The approach was designed to deliver a quality program which:
• built school leadership team capability to lead change in transitioning Year 7 to high school;
• built school leadership team capability to lead the introduction of Junior Secondary in all state high schools;
• provided support to school leadership teams with the schools’ development and implementation of Action Plans for transitioning Year 7 to high school and introducing Junior Secondary in all state high schools; and
1.3
Project phases
The Department of Education, Training and Employment provided a six phase project plan, as outlined in Table 1.1.
Table 1.1 Project Phases
Phase Phase description Timeframe goal
A Program design and development February—March 2014 B Delivery of two day conferences April—June 2014
C Interim evaluation of program July 2014
D Delivery of ongoing support strategies / services June—September 2014
E Final one day workshops September—October 2014
F Final program evaluation November 2014
This report constitutes Phase C of the project.
1.4
Project stages and expected participation
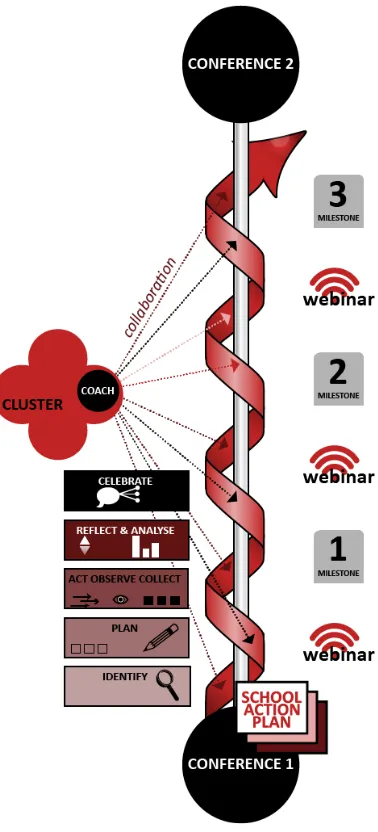
Within the six Phases of the Project, the Program had three operational stages for delivery of services (see Table 1.2). Details of these stages, including the two day conference program and the one day workshop program, are outlined in Appendix B. This process is represented visually in Figure 1.1.
Table 1.2 Project Stages
Stage Activity Timing, 2014
Stage 1 Two day Professional Learning conference for school leaders April—June Stage 2 Implementation with coaching support May—September Stage 3 One day workshop for school leaders September—October
The Program was designed for schools commencing this journey and preparing for Year 7 in 2015, as well as for purpose-designed schools and those that had been involved as pilot schools of the implementation. In this way the Program aimed to work with all schools to further progress the development of their Junior Secondary program, using the Educational Change Model as the key underpinning framework.
1.4.1
Stage 1—Two day Professional Learning conference for school leaders
According to the Project specifications, it was envisaged that in Stage 1 three (3) participants from each high school would participate in the Program, including the school principal, a leader in Junior Secondary e.g. a head of department, and one other person who may be a teacher. The expected total number of Participants was approximately 795 from 265 schools across seven regions (see Table 1.3). The approved delivery model was for one conference in each region.
Table 1.3 Expected participants by region
Region Major regional city Number of high schools Number of participants from each school
Central Queensland Rockhampton 41 123
Darling Downs South West Queensland Toowoomba 46 138
Far North Queensland Cairns 25 75
Metropolitan Brisbane 50 150
North Coast North Coast 43 129
North Queensland Townsville 23 69
Figure 1.1 Overview of Junior Secondary Leading Change Development
The delivery team developed a comprehensive suite of resources that were made available to all schools via provision of a loaded USB device for each school and access to a purpose-built interactive website. Resources provided theoretical information and evidence related to adolescent learners, the Six Guiding Principles, the Educational Change Model, and quality teaching that could be shared and implemented within their schools and communities. Information, PowerPoint presentations and activities were developed for 28 topics. Leadership teams were informed that they were able to use or adapt these resources to best suit their contexts. During the two day conference, evaluation tools were administered to gather evidence regarding: a) each leadership teams’ perceptions of the efficacy of their teachers to teach in Junior Secondary; b) their stage of reform based on the Educational Change Model; and c) the effectiveness of the conference program itself as a form of professional learning.
1.4.2
Stage 2—Implementation with coaching support
All 259 participating schools were placed in 22 clusters that were negotiated with regional representatives. Clusters comprised approximately 10 schools each and each were allocated two professional coaches. For 3–4 months the coaches were available for direct support and, in particular, to assist schools with their Junior Secondary Action Plan as well as provide feedback and advice on three structured milestones. These documents were designed as a focused reflection tool for schools to consider progress to date, revisit goals and responsibilities and to seek feedback. Once schools uploaded their documents to the Leading Change Website, coaches would access the documents and provide written feedback which included comments, recommendations for future direction, or additional resources.
In addition to the school based coaching, four webinars on the topics of most interest to participants were delivered during this time.
1.4.3
Stage 3 –One day workshop for school leaders
The one day workshop delivered in each of the 7 regions was originally designed as a sharing of the Action Learning undertaken by each school. In order to respond to the complexity and needs of the schools and regions, and recognising that not all schools opted to engage in the coaching with the associated Action Learning and Milestone completions, the one day workshop program was modified to focus on Best Practice in Junior Secondary, with the key priorities of: Quality teaching; transition; and evidence-based practice. While the expected number of participants was the same as in Stage 1, the number of attendees was 421. Sessions throughout the day were structured around Best Practice for the theme followed by presentations from selected schools in each region to share effective practice related to the theme. Following school presentations, school leadership teams engaged in activities that provided them with the structure and tools to reflect on different aspects of their school’s progress in each area and to consider other strategies that may further support or enhance their Junior Secondary program. Schools were given opportunities to network and to share their successes in their program implementation efforts.
During the one day workshop, evaluation tools used in the two day conference were utilised again to develop a longitudinal understanding of: a) each leadership teams’ perceptions of the efficacy of their teachers to teach in Junior Secondary; b) their stage of reform based on the Educational Change Model; and c) the effectiveness of the conference program itself as a form of professional learning.
1.5
Structure of this report
The Junior Secondary Leading Change Program was evaluated in terms of its effectiveness:
• as a form of professional development (both mode of delivery and content),
• in improving school leaders’ sense of efficacy, and
• in facilitating systemic change throughout Queensland high schools’ Junior Secondary programs.
An interim report was provided at the completion of Stage 1–Two day conference for school leaders, the findings of which are incorporated in this final report. As required by contract, this report provides: a summation of attendees and schools; collation and analysis of information from final workshops; issues raised throughout the program; recommendations for improvement; findings of the Interim Evaluation Report; level of readiness for enrolling Year 7 students to high school in 2015; and level of readiness for the introduction of Junior Secondary.
The remainder of this report is comprised of the following sections:
• Section 2 provides an overview of the instruments used to collect data;
• Section 4 provides an analysis of the professional learning survey for both the two day conference and the one day workshop. This is a theorised framework for determining the effectiveness of these events;
• Section 5 combines the various sources of evidence which provide self-reporting data about the readiness of schools for Year 7 in 2015 and the implementation of Junior Secondary across Years 7-9. Data sources include: stage of the Educational Change Model of each school; teacher efficacy for Junior Secondary of each school; embedded practice of Quality Teaching with respect to: leadership practice; teacher practices; and student learning behaviours;
• Section 6 provides a summary and recommendations; and
2
Evaluating the Program
This section of the report provides details of the instruments used to evaluate the effectiveness of the Program and the readiness for schools for Year 7 in 2015 and the implementation of Junior Secondary across Years 7-9.
2.1
Data collection instruments
The evaluation has been undertaken through data collection in two phases, as specified in the DETE contract—Phase C: Interim evaluation of Program, which follows completion of the two day Leading Change workshops; and Phase F: Final Program Evaluation, which follows completion of the Coaching Phase and one day Leading Change follow-up workshops.
Instruments used for data collection are as follows:
1. Overall Satisfaction Survey—Two Day Conference
(See Appendix C)
This instrument was administered to all participants at the conclusion of the two day conference. It comprised an overall satisfaction rating, with an opportunity to provide an explanation of the rating. This overall satisfaction score was followed by questions regarding least and most effective aspects of the two day event, along with comments about how the conference has benefitted the participants.
2. The Effectiveness of Professional Learning Survey
(See Appendix D)
This instrument is a standardised Professional Development Scale (Main & Pendergast, under review). It was administered twice during the project to collect data related to the effectiveness of the separate professional learning programs. It was first administered at the end of the two day conferences and then again at the one day workshops. This instrument is a Likert type scale (strongly agree, agree, neutral, disagree, strongly disagree) to measure participants’ responses. The scale consists of five dimensions with between 6 and 9 items, namely: duration, (6), collective participation (6), coherence (8), content focus (9), and active learning (9).
3. Teacher Efficacy Survey
(See Appendix E)
4. Quality Teaching—School leaders’ perceptions of embedded practices
(See Appendix F)
This instrument was administered at the one day workshop to participants in their school groups. Respondents were asked to assess their Quality Teaching in terms of leadership practices, teacher practices, and student capabilities on a range from none to fully implemented. A regional score was used to provide an overall insight.
5. Evaluation Junior Secondary Leading Change Program—One Day Workshop
(See Appendix G)
This instrument was administered to all participants at the conclusion of the one day workshop. Parts A, B and C evaluated the Coaching program, the one day workshop and the entire Leading Change Program respectively. Part C also had respondents evaluate their school’s preparedness and evaluate their school’s stage of the Educational Change Model (i.e., initiation, development or consolidation). Part C also included the Effectiveness of Professional Learning Survey.
2.2
Data analysis
In general, the demographic data collected were: respondent’s position (Principal, Deputy Principal, Head of Junior Secondary, other) and region (Metropolitan, Central Queensland, North Coast, Far North Queensland, North Queensland, Darling Downs South West Queensland, and South East Queensland). These categories provided useful means of further exploring the data allowing comparisons to be made between regions and position. The lack of identifying information enabled respondents to provide anonymous ratings and comments, thereby enhancing the validity of the responses.
For the standardised Norwegian Teacher Self-Efficacy Scale (Appendix E), school names were recorded so that a direct comparison could be made to determine changes from the one day workshop compared to the two day conference. The reporting however groups the responses to that no school is identified in the evaluation.
3
Satisfaction Ratings
This section presents the analyses of the overall satisfaction ratings for the:
• Two day conference
• One day workshop
• Coaching program, and the
• Program overall.
Each section begins with the quantitative analysis of the respondents’ ratings based on a scale from 1 (completely unsatisfied) to 10 (completely satisfied) to provide a big picture overview of respondents’ satisfaction for that component of the Program. This rating is then followed by the qualitative analysis of respondents’ comments giving a finer grained view explaining their rating.
3.1
Respondents
[image:20.595.72.532.427.706.2]A total of 465 (total participants N = 685, response rate = 68%) and 278 (total participants N = 421, response rate = 66%) responded to the evaluation instruments for the two day conference and one day workshop respectively. Table 3.1 shows the respondent demographics by position and region for each component of the Program. The demographic data collected were the respondent’s position (Principal, Deputy Principal, Head of Junior Secondary, other) and region (Metropolitan, Central Queensland, North Coast, Far North Queensland, North Queensland, Darling Downs South West Queensland, and South East Queensland).
Table 3.1 Respondent position and response rates by region for the two day conference and one day workshop
Event Region a
Position Totals
Principal Principal Deputy Head of Junior
Secondary Other
b Respondents Participants Response
Rate Tw o D ay c on fe re nc e
ME 34 27 18 17 96 134 72%
CQ 27 12 19 19 77 115 67%
NC 16 21 14 9 60 97 62%
FN 20 10 9 6 45 70 64%
NQ 20 12 12 8 52 60 87%
DDSWQ 29 10 15 27 81 121 67%
SE 18 15 14 7 54 88 61%
TOTAL 164 107 101 93 465 685 68%
O ne D ay wo rk sh op
ME 5 19 17 11 52 91 57%
CQ 10 14 7 20 51 55 93%
NC 2 10 9 9 30 65 46%
FN 13 5 10 6 34 40 85%
NQ 5 6 10 11 32 46 70%
DDSWQ 10 7 10 15 42 63 67%
SE 7 12 9 9 37 61 61%
TOTAL 52 73 72 81 278 421 66%
a ME—Metropolitan. CQ—Central Queensland. NC—North Coast. FN—Far North Queensland. NQ—North Queensland. DDSWQ—Darling
Table 3.2 below shows the number of respondents by position who indicated they had participated in the coaching program and/or rated the program overall. The total number of participants and the response rate are not shown for these two evaluations. Surveys in relation to the overall program, the two day conference and the one day workshop were conducted anonymously. As such, there was no way to match respondents’ surveys to prevent double counting the number of responses so, in order to more accurately reflect the data, only the number of schools that participated in any aspect of the program was recorded.
Table 3.2 Number of respondents for the Coaching program and Program overall evaluations
Event Region a
Position
Totals respondents Principal Principal Deputy Head of Junior
Secondary Other
b Co ac hi ng p ro gr am
ME 0 2 6 0 8
CQ 3 4 2 5 14
NC 0 2 2 1 5
FN 2 0 2 1 5
NQ 0 0 4 1 5
DDSWQ 4 4 3 4 15
SE 2 1 2 1 6
TOTAL 11 13 21 13 58
Pro gra m O ve ra ll
ME 5 17 16 10 48
CQ 9 13 6 18 46
NC 2 6 9 8 25
FN 11 4 9 2 26
NQ 5 6 9 9 29
DDSWQ 10 5 9 12 36
SE 7 10 8 8 33
TOTAL 49 61 66 67 243
a ME—Metropolitan. CQ—Central Queensland. NC—North Coast. FN—Far North Queensland. NQ—North Queensland. DDSWQ—Darling
Downs South West Queensland. SE—South East. b includes year level coordinators, heads of department, classroom teachers and not
specified.
The analyses that follow were either conducted in SPSS where the data were quantitative or Leximancer where the data were qualitative. Leximancer theme maps have not been generated for all open-ended responses, only those that added value and depth to this evaluation. In the Leximancer concept maps, the relevance of the themes is portrayed through heat mapping. That is, the most prominent theme is coloured red and responses grade through the spectrum (orange, yellow, green, blue, violet) to violet which represents the least prominent theme.
3.2
Two day conference satisfaction
Conference participants were asked to rate their overall satisfaction on a scale from 1 (completely unsatisfied) to 10 (completely satisfied) of the effectiveness of the two day conference in preparing them to lead the implementation of a Junior Secondary program in their school. Participants were also asked to explain their rating. Table 3.3 shows the number of respondents per rating category by region, the total number of respondents for each region, means and standard deviations. Regions are listed by the date order of conference presentation. The highest mean rating was achieved in the Far North Queensland Region (M = 7.8, SD = 1.5) and the lowest in the North Coast region (M = 5.5,
Table 3.3 Two day conference satisfaction ratings, number of participants, means and standard deviations by region
Region Number of respondents Statistics
1 2 3 4 5 6 7 8 9 10 n M SD
Metropolitan 1 0 1 3 5 9 18 30 12 5 84 7.4 1.6
Central Queensland 0 2 3 5 4 4 21 23 8 1 71 6.9 1.8
North Coast 2 5 7 7 1 10 8 7 5 1 53 5.5 2.4
Far North Queensland 0 1 1 0 0 0 10 22 4 5 43 7.8 1.5
North Queensland 0 1 4 3 3 6 9 16 7 3 52 6.9 2.0
Darling Downs SWQ 0 0 4 5 0 9 15 26 11 5 75 7.3 1.8
South East 1 4 2 4 4 7 10 9 6 0 47 6.2 2.2
Total 4 13 22 27 17 45 91 133 53 20 425* 6.9 2.0
* Note: 41 participants did not answer this question.
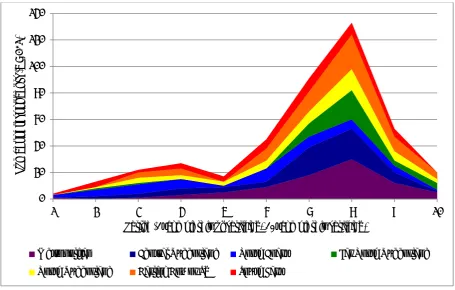
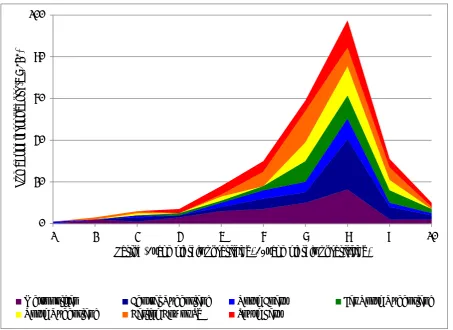
This data is presented graphically in Figure 3.1 using a cumulative display. The image clearly highlights the fact that there was polarity in the responses, with the majority of respondents generally very satisfied with the two day conference (hence the modal value is 8), but with a second and less substantial peak being reported at the unsatisfied end of the scale.
Figure 3.1 Two day conference satisfaction ratings by region
A one-way between-groups analysis of variance was conducted to detect statistically significant differences in overall satisfaction ratings by region. Conference participants were divided into seven groups according to their region (Group 1: Metropolitan; Group 2: Central Queensland; Group 3: North Coast; Group 4: Far North Queensland; Group 5: North Queensland; Group 6: Darling Downs SWQ; Group 7: South East). There was a statistically significant difference at the p < 0.01 level in
0 20 40 60 80 100 120 140
1 2 3 4 5 6 7 8 9 10
N
umb
er o
f re
sp
on
de
nt
s (
n
=
425)
Rating (1–completely unsatisfied, 10–completely satisfied)
size using eta-squared was 0.12 indicating a large effect size. Cohen (1998) defines an eta squared of 0.14 as being a large effect meaning the differences in overall satisfaction ratings between regions is real.
The mean differences between each region’s mean overall satisfaction rating as well as indicating statistically significant differences in overall satisfaction ratings between regions is shown in Table 3.4 below. Mean differences were calculated by subtracting the mean overall satisfaction rating of the region in the column from the region in that row. A positive difference indicates the region in the row has a greater mean overall satisfaction rating than the region in the column. For example, participants at the Metropolitan region (M = 7.1, SD = 1.7) conference overall were more satisfied with the conference than participants in both the North Coast (M = 5.5, SD = 2.3) and South East (M = 6.2, SD = 2.2) regions. Participants’ overall satisfaction ratings of the Metropolitan region did not differ significantly from Central Queensland (M = 6.8, SD = 1.8), Far North Queensland (M = 7.7,
SD = 1.6), North Queensland (M = 6.9, SD = 1.9) or Darling Downs SWQ (M = 7.3, SD = 1.7).
Table 3.4 Mean differences between regions’ two day conference satisfaction rating
Region Metropolitan Central
Queensland North Coast Queensland Far North Queensland North Downs SWQ Darling South East
Metropolitan - 0.468 1.841* -0.468 0.427 0.062 1.220*
Central
Queensland -0.468 - 1.373* -0.936 -0.041 -0.405 0.752
North Coast -1.841* -1.373* - -2.309* -1.414* -1.778* -0.621
Far North
Queensland 0.468 0.936 2.309* - 0.895 0.531 1.688*
North
Queensland 0.427 0.041 1.414* -0.895 - -.364 0.793
Darling Downs
SWQ -.062 0.405 1.778* -0.531 0.364 - 1.158*
South East -1.220* -0.752 0.621 -1.688* -0.793 -1.158* -
* Note: Indicates a statistically significant difference between the mean overall satisfaction ratings (p < 0.02).
3.2.1
Overall satisfaction by position
Other demographic data collected were the respondents’ position. Four variables were identified on the response sheet: Principal, Deputy Principal, Head of Junior Secondary, and Other. A significant number of respondents provided further detail regarding their positions and hence six variables were utilised gaining greater insight of the effectiveness of the two day conferences by position.
A one-way between-groups analysis of variance was conducted to detect statistically significant differences in overall satisfaction ratings by position. Conference participants were divided into six groups according to their position (Group 1: Principal; Group 2: Deputy Head; Group 3: Head of Junior Secondary; Group 4: Heads of curriculum and year level coordinators; Group 5: Teachers; Group 6: Other). There were no statistically significant differences at the p < 0.01 level in overall satisfaction ratings for the six position: F (5,419) = 0.402, p = 0.848.
3.2.2
Satisfaction rating differences
Respondents were asked to explain why they selected the rating (1-10). This qualitative data was then analysed using Leximancer to better understand why there were polarised views from respondents.
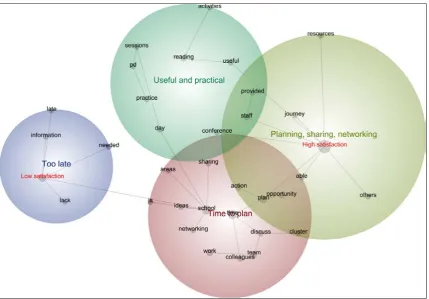
Leximancer identified four major themes in a comparison of participants who rated their overall satisfaction with the conference as low (ratings 1-5) compared to high (ratings 6-10). Figure 3.2 represents the analysis in a diagrammatic form. The most prominent themes in descending order were: the time to plan; planning, sharing and networking; the materials and conference being useful
and practical; and, the conference being too late. The two groups will be referred as the low
satisfaction and high satisfaction groups.
Figure 3.2 Thematic analysis of two day conference participants with low (ratings 1–5) and high (ratings 6–10) overall satisfaction
[image:24.595.72.502.208.507.2]Being given the time to plan was the major theme identified by both groups, but due to its proximity to the high satisfaction node (on the right in Figure 3.2) indicates that respondents who rated their satisfaction as being higher were more likely to state this as a reason for their higher satisfaction rating. The next most prominent theme, planning, sharing, networking, was centred around the high satisfaction group. The main issue identified by the low satisfaction group was too late. That is, the low satisfaction group were more likely to identify that the two day conference occurred too late within their Junior Secondary journey and that the information provided was needed earlier in the reform process. Table 3.5 provides insight into the strength of the nodes in association to each other.
Table 3.5 Emergent themes, connectivities and the underlying concepts in comparing low and high satisfaction ratings
Theme Connectivity (%) Concepts
Time to plan 100 school, time, plan, team, work, discuss, action, sharing, JS, opportunity, colleagues, networking, ideas, cluster, areas
Planning, sharing,
networking 48 High satisfaction, resources, able, journey, others
With regard to the overall satisfaction ratings, there were some key commonalities between the respondents’ comments in both the low and high brackets of responses respectively. The respondents who rated the two day conference overall in the high bracket commented positively about a number of factors including: the resources provided; the time provided to work together collegially; the sharing from the Pilot schools; as well as some of the processes used by the Leading Change Development team. In relation to the resources, the participants felt that they would be able to draw on these substantially in their own schools and apply the knowledge and content effectively with their staff, students, and community. The following comments are typical examples from the feedback provided:
The resources provided [will be] brilliant for sharing with staff (Head of Junior Secondary, North Coast)
The very well developed resource package—USB (Other, North Queensland) Activities to compare in each module (Head of Junior Secondary, North Coast) Large bank of well organised resources (Deputy Principal, Central Queensland)
Some of the models were very good at helping to highlight the gaps and areas for further development (Deputy Principal, North Coast)
Another strength commented on consistently was that participants were able to spend time with colleagues from their own school and also from other schools within their cluster and region, and this was revealed to be an opportunity they do not often get, particularly given the busy-ness of their management roles. This was highly valued by the participants, as evidenced in a number of comments, for example:
Spending time with my team to think (Principal, Central Queensland)
Allocated time for collegial discussion and action planning (Head of Junior Secondary, Central Queensland)
The integration between the whole group sessions and the within school discussion time (Other, North Queensland)
Networking opportunities, listen to what others had to say (Principal, Central Queensland) Discussing the progress made with each of the other schools at our table and I our cluster (Deputy Principal, North Coast)
Ample time to talk and plan with colleagues (Head of Junior Secondary, Darling Downs SWQ) Time to discuss with colleagues—fantastic! (Head of Junior Secondary, Darling Downs SWQ) Opportunities to network with other schools (Other, Far North Queensland)
Time to work as a team out of school work commitments (Principal, South East)
A substantial number of affirmative comments focused on the sessions where the Pilot Schools shared their Junior Secondary journeys so far. In these sessions the Pilot School teams were asked to report on the types of challenges as well as what they felt was successful with the implementation of Junior Secondary at their schools. It was apparent that leaders from the schools which were yet to welcome Year 7 students into their schools enjoyed hearing these stories and were able to take note of some of the suggestions and recommendations made by these Pilot Schools, as indicated by the following comments:
Pilot school success stories (Other, Darling Downs SWQ) Feedback from pilot schools (Other, Darling Downs SWQ)
Pilot schools sharing their implementation of year 7 and JS (Head of Junior Secondary, Central Queensland)
Best practice/ sharing from pilot schools (Head of Junior Secondary, Metropolitan)
With respect to this aspect of the conference, there were also a few comments praising the sessions where regional staff presented.
Implementation of the Junior Secondary initiative is clearly a complex process and participants appreciated being provided the chance to reflect on their journey to that point. There were a number of comments made about the opportunity to re-visit the Six Guiding Principles and have the chance to continue the development of their school’s individual Action Plans. A number of positive comments were made about the activities provided in the resource bank that assisted in the planning process, particularly in terms of applying theory to practice, including the Educational Change Model (ECM). The respondents appreciated the clear direction provided in terms of working through the materials provided with the aim of developing their school’s Action Plans by the end of the second day of the conference.
It was evident that the strategies underway outside the scope of the Leading Change Program varied in effect and intensity around the state. The Leading Change Team attempted to make connections and to reinforce these activities wherever that was possible.
Most of the responses in the low sector of the overall satisfaction focused on the timing of the conference within the term. However, some aspects related to the structure of the Program and the fact that some of the participants felt they already knew a lot of information presented. For example:
The info presented would have been useful 2 years ago (Deputy Principal, North Coast)
Poor timing—close to NAPLAN. Should have been held at end of 2012 beg 2013 (Head of Junior Secondary, North Coast)
The timing is awkward—we are beyond this level—maybe split groups (1. Beginner, 2. Intermediate, 3. Advanced) (Deputy Principal, Metropolitan)
This PD is great in content; however it is poorly timed and NOT an effective use of resources at this time—SORRY! YOU NEED TO KNOW IT'S ABOUT 18 MONTHS TOO LATE!! (Principal, Darling Downs SWQ)
Although these comments reflect the notion that the conference was too late and that they already
knew the content provided, they indicate that some respondents felt confident about their progress
with the Junior Secondary planning and preparation within their own particular context. However, it could also indicate that others were discontent that this opportunity was not provided to them earlier in order to support the development and progress of their school’s planning towards Junior Secondary implementation.
Some of the feedback focused on the timing of the sessions during the day, despite a substantial amount of the feedback that focused on the time working with colleagues being a positive aspect of the conference. However, there were some contradictions appearing in the comments across the board. For example:
Too much time in some sessions (Head of Junior Secondary, Far North Queensland)
Not enough clarity of instruction about what to achieve in sessions (Head of Junior Secondary, Central Queensland)
Some of the activities (Deputy Principal, Metropolitan)
3.2.3
Regional differences
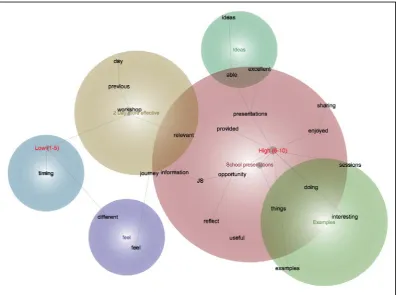
There was a notable difference between two of the regions (North Coast and South East) and the remaining five regions (Metropolitan, Central Queensland, North Queensland, Far North Queensland, and Darling Downs South West Queensland) in terms of overall satisfaction. These two groups will be referred to in the analysis as the Low regions (North Coast and South East) and High regions (all other regions) respectively. The most prominent themes identified by Leximancer in descending order of prominence were: the Nature of the activities; the Opportunity to network; the Nature of the
information; and, the Useful resources (see Figure 3.3). These comments may be attributed to a
number of reasons depending on the context of each of these two regions including the peer review process, the phase of the Junior Secondary reform initiative within these regions, as well as other impacting factors.
The high regions appreciated the time to share and collaboratively plan for the transition but at times felt the activities lacked structure and that at some stages, too much time was devoted to free time. The low regions predominantly felt the information was too basic or that they had already engaged with the information before:
We have already engaged in this information before (Other, North Coast) There was a lot of information I knew (Other, North Coast)
but nevertheless appreciated the opportunity to share ideas and resources with other schools:
[image:27.595.71.472.388.692.2]Access to expert advice/sharing (Principal, South East) Sharing with other schools (Other, Darling Downs SWQ)
3.2.4
Agreement with comments
With respect to the two day conference, respondents were asked to rate their agreement with three statements: I have a greater understanding of Junior Secondary; the content and delivery of the
workshops met my needs; and, the processes and activities used by the facilitator/s were effective. In
each case, the response category with the greatest proportion of respondents has been highlighted (see Table 3.6). Respondents, both by region and overall, on the whole agreed with each statement, that is, they have a greater understanding of Junior Secondary (see Table 3.7); the content and delivery of the workshops met their needs (see Table 3.8); and, the process and activities used by the facilitators were effective (see Table 3.9 ). Percentages are based upon those participants who responded to the respective items.
Overall, 73.5 percent of all participants agreed or strongly agreed they have a greater understanding of Junior Secondary; 70.1 percent agreed or strongly agreed that the content and delivery of the two day conference met their needs; and 67.7 percent agreed or strongly that the processes and activities used by the facilitators were effective.
Table 3.6 Participant agreement with the three items seeking feedback on the two day conference
Statement Percentage of respondents (%)
Strongly
Agree Agree Neutral Disagree Disagree Strongly
I have a greater understanding of Junior Secondary 17.8 55.7 15.3 8.9 2.3
The content and delivery of the workshops met my needs 12.6 57.5 16.8 9.7 3.4
The processes and activities used by the facilitators were
effective 12.5 55.2 17.3 12.2 2.8
Overall, 11.2 percent of all participants disagreed or strongly disagreed they have a greater understanding of Junior Secondary; 13.1 percent disagreed or strongly disagreed that the content and delivery of the two day conferences met their needs; and 15 percent disagreed or strongly disagreed that the processes and activities used by the facilitators were effective (see Table 3.7).
Table 3.7 Participant agreement with I have a greater understanding of Junior Secondary
Region Percentage of respondents (%)
Strongly Agree Agree Neutral Disagree Strongly Disagree
Metropolitan 14.9 67.8 11.5 3.4 2.3
Central Queensland 17.6 56.8 16.2 9.5 0.0
North Coast 7.1 46.4 17.9 19.6 8.9
Far North Queensland 45.5 43.2 4.5 6.8 0.0
North Queensland 19.6 54.9 17.6 7.8 0.0
Darling Downs SWQ 19.5 57.1 15.6 5.2 2.6
South East 6.1 53.1 24.5 14.3 2.0
Table 3.8 Participant agreement with The content and delivery of the workshops met my needs
Region Percentage of respondents (%)
Strongly Agree Agree Neutral Disagree Strongly Disagree
Metropolitan 16.5 64.7 12.9 4.7 1.2
Central Queensland 5.4 58.1 24.3 9.5 2.7
North Coast 5.4 39.3 21.4 25.0 8.9
Far North Queensland 25.0 63.6 4.5 2.3 4.5
North Queensland 13.7 60.8 15.7 7.8 2.0
Darling Downs SWQ 15.8 55.3 19.7 7.9 1.3
South East 8.2 59.2 14.3 12.2 6.1
OVERALL 12.6 57.5 16.8 9.7 3.4
Table 3.9 Participant agreement with The processes and activities used by the facilitators were effective
Region Percentage of respondents (%)
Strongly Agree Agree Neutral Disagree Strongly Disagree
Metropolitan 15.1 64.0 12.8 7.0 1.2
Central Queensland 9.7 52.8 20.8 12.5 4.2
North Coast 1.9 13.3 8.2 8.9 2.5
Far North Queensland 22.7 54.5 15.9 4.5 2.3
North Queensland 11.8 68.6 9.8 7.8 2.0
Darling Downs SWQ 9.5 43.2 17.9 8.4 1.1
South East 12.2 51.0 14.3 20.4 2.0
OVERALL 12.5 55.2 17.3 12.2 2.8
3.2.5
Three most effective aspects of the two day conference
Figure 3.4 is the resultant concept map of a content analysis of the 450 responses to List the three
most effective elements of the conference. Leximancer identified the major theme of team planning
(100% connectivity) and the minor themes of sharing and networking (16% connectivity) and
resources (3% connectivity). Each theme will be discussed in turn.
The most dominant theme in response to this question was the effectiveness of the opportunity for team planning provided by the conference. This is illustrated by the following comments:
School time together (Principal, Metropolitan)
Time to discuss with colleagues—fantastic (Head of Junior Secondary, Darling Downs SWQ) Team planning opportunity, a luxury that we don't have at school (Principal, North Coast) Extended blocks of time (uninterrupted) in which to have meaningful conversations with colleagues (Deputy Principal, Metropolitan)
A minor, but closely related theme, as indicated by its close proximity to the theme of team planning (see Figure 3.4), was the opportunity for sharing and networking with other schools:
Discussing and sharing with other schools (Principal, South East)
Inter school sharing of experiences and learning (Deputy Principal, North Coast) Sharing with other schools (Deputy Principal, North Coast)
Figure 3.4 Thematic analysis of the most effective elements of the two day conference
The second minor theme among the most effective elements of the conference was the resources, as indicated by the following responses:
Wide bank of resources (Head of Junior Secondary, North Coast) Access to resources (Principal, North Queensland)
Great resources (Principal, Metropolitan)
The very well developed resource packages (USB) (Other, North Queensland) Large bank of well organised resources (Deputy Principal, Central Queensland)
It is interesting to note that while some conference attendees commented that they appreciated the resources, in the following section on the least effective elements of the conference, the resources also emerged as a minor theme, suggesting that some participants felt they were not effective.
3.2.6
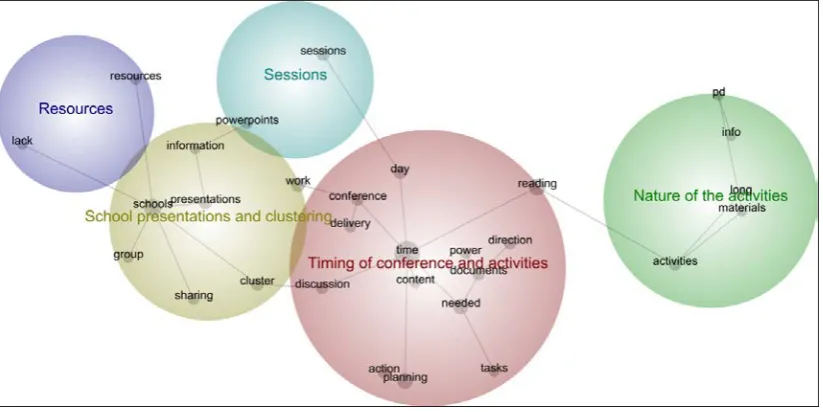
Three least effective aspects of the two day conference
Figure 3.5 presents the resultant concept map of a content analysis of the 237 responses to List the
three least effective elements of the conference. It is interesting to note the smaller response rate
(just over 50%) to this question, which suggests that more than half of the respondents had no comment with regard to least effective elements. The point here is that more than half of the respondents were unable to identify any aspect that was ineffective.
Leximancer identified two major themes and three minor themes among respondents who provided some responses. Timing (100% connectivity), with subthemes of the timing of the conference and
timing of the activities, and school presentations and clustering (42% connectivity), with subthemes
of presentations by schools and school clustering, were the two major themes. The Nature of the
Figure 3.5 Thematic analysis of responses to the least effective elements of the conference
Of this small number of respondents, some felt that both the timing of the conference and the timing of the activities were the least effective elements of the conference. Comments such as:
Timing—12 months too late! (Principal, Metropolitan)
Timing. Would have preferred to have it term 1 (2014) or term 4 (2013) (Head of Junior Secondary, Far North Queensland)
Timing—it’s really too late!! (Principal, Darling Downs SWQ)
The timing was hideous and the notice was unacceptable (Principal, Metropolitan) Would have been more useful 18 months ago (Principal, North Coast)
Comments around the timing of the activities were polarised with some conference participants responding:
Not enough time for each section (Principal, Central Queensland) Reading requirement in time allocated (Other, Far North Queensland)
Other respondents indicated that too much time was devoted to some activities:
Time to complete activities was too long for us (Principal, Darling Downs SWQ) Too much planning time (Deputy Principal, Metropolitan)
Too much time in discussion (Other, Darling Downs SWQ)
The second major theme of the least effective elements centred on the school presentations and clustering. Some respondents felt:
Sharing of case study schools was very dry but sharing itself is useful (Head of Junior Secondary, Central Queensland)
and
Having all the presentations of the pilot school one after the other (Principal, Darling Downs SWQ)
Not being grouped with like schools (Head of Curriculum, Darling Downs SWQ)
Grouping of cluster 1—too wide a range of contexts (Head of Junior Secondary, Central Queensland)
Would prefer to organise cluster review groups myself (Principal, Metropolitan)
Another minor theme identified by respondents was the nature of the activities with comments such as:
More structured activity needed (Head of Junior Secondary, North Queensland)
Clarity of activity—too distracted by reading the volumes of helpful literature provided! (Principal, Darling Downs SWQ)
Ambiguity of some activities (Teacher, Central Queensland)
The second theme focussed on the perceived ineffectiveness of the sessions:
Having mentors interrupt to monitor progress in the break-out sessions was annoying and impeded work flow and progress—not helpful (Head of Junior Secondary, South East)
A little too much time in some sessions (Head of Junior Secondary, Far North Queensland) Some sessions seemed overlong (Deputy Principal, Metropolitan)
Limited outcome to break up session (Deputy Principal, Central Queensland)
In contrast to the large number of respondents who felt the resources were an effective aspect of the conference, a similarly small group of responses criticised the resources with comments such as:
More illustrations needed (Deputy Principal, Darling Downs SWQ)
More explanation of some resources, particularly in PowerPoint presentation (Other, Central Queensland)
Folders of documents and PowerPoints that were hard to understand the terminology and intent of the writers (Principal, Darling Downs SWQ)
3.2.7
Question 5—Three strategies to utilise in your school to implement Junior
Secondary practices
Figure 3.6 presents the resultant concept map of a content analysis of the 544 responses to what
three strategies will you employ on your return to school?. A Leximancer analysis identified the major
theme of staff professional development (100% connectivity) and the minor themes of feeder and
cluster school engagement (36% connectivity) and a focus on stud