i
UNIVERSITY OF SOUTHERN QUEENSLAND
AN EVALUATION OF REDD+ IN
COMMUNITY MANAGED FORESTS: A
CASE STUDY FROM NEPAL
A Dissertation Submitted by
Shiva Shankar Pandey
MSc (Biodiversity Management), MA (Sociology and Anthropology), BSc (Forestry)
For the award of
DOCTOR OF PHILOSOPHY
ii
CERTIFICATION OF DISSERTATION
I certify that the ideas, research works, results, discussions and conclusions reported in this dissertation are entirely my own effort, except where otherwise acknowledged. I also certify that the work is original and has not been previously submitted to earn academic awards.
Signature of Candidate Date
Shiva Shankar Pandey
Endorsement
Signature of Principal Supervisor Date
Professor Geoffrey J Cockfield
Signature of Associate Supervisor Date
iii
LIST OF PUBLICATIONS AND AWARDS
List of journal papers during the PhD study
1. Pandey, S.S., Maraseni, T.N., Cockfield, G. and Gerhardt, K. 2014. Tree species diversity in community managed and national park forests in mid-hills of Central Nepal. Journal of Sustainable Forestry 33,796-813 (Rank “B” Journal in ERA 2010)
2. Maraseni, T.N. and Pandey, S.S. 2014.Can vegetation types work as an indicator of soil organic carbon? An insight from native vegetation in Nepal.
Ecological Indicators 46, 315-322 (Impact factor 3.2)
3. Pandey, S.S., Maraseni, T.N., and Cockfield, G. 2014. Carbon stock dynamics in different vegetation dominated community forests under REDD+: A case from Nepal. Forest Ecology and Management 327, 40–47
(Impact factor 2.76; Rank “A” Journal in ERA 2010)
4. Pandey, S.S., Cockfield, G. and Maraseni, T.N. 2014. Dynamics of carbon and biodiversity under REDD+ regime: A case from Nepal. Environmental Science & Policy 38, 272–281 (Impact factor 3.5)
5. Pandey, S.S., Cockfield, G. and Maraseni, T.N. 2013. Major drivers of deforestation and forest degradation in developing countries and REDD+.International Journal of Forest Usufructs Management 14, 99–107
Awards/Scholarships during the PhD study
1. USQ Publication Excellence Awards for: Pandey, S.S., Cockfield, G. and Maraseni, T.N. 2014. Dynamics of carbon and biodiversity under REDD+ regime: A case from Nepal. Environmental Science & Policy 38, 272–281
2. Student scholarship to attend IUFRO Conference on Forests for People. Traverse City, Michigan on May 19–23, 2013
3. Full travel grants to attend “Major groups-Led Initiative in support of the
iv
Economy”. National Institute of Tropical Botany, Rio de Janeiro, Brazil on
March 18–22, 2013
List of conference papers during the PhD study
1. Cockfield, G., Dhakal, A., Maraseni, T.N. and Pandey, S.S. 2013. Factors influencing carbon sequestration potential in Nepalese forests and agro-forest. In: International conference on forests, people and climate: changing paradigm. Institute of Forestry, Tribhuvan University, Departmente of Forest Research & Survey, Government of Nepal and Faculty of Science, University of Copenhagen. Pokhara, Nepal (August 28–30, 2013)
2. Pandey, S.S., Cockfield, G., Maraseni, T.N., and Subedi, B. 2013. Carbon enhancement in community based forestry: A case from early REDD+ project Nepal. In: Burns, R.C. and Highsmith, J. (Eds.) Book of Abstracts. IUFRO Conference on Forests for People. Traverse City, Michigan (May 19–23, 2013) p.55
http://www.recpro.org/assets/Conference_Proceedings/ffp_abstract_book_fin al.pdf
3. Pandey, S.S, Cockfield, G., and Maraseni, T.N. 2013. Conservation of the forests with linking livelihood of local communities and REDD+ in Nepal. In: Burns, R.C. and Highsmith, J. (Eds.) Book of Abstracts. IUFRO Conference on Forests for People. Traverse City, Michigan (May 19–23, 2013) p.56
http://www.recpro.org/assets/Conference_Proceedings/ffp_abstract_book_fin al.pdf
v
ABSTRACT
Deforestation and forest degradation contribute between 10 and 25% of total annual greenhouse gas emissions. The REDD+ program for reducing emissions from deforestation and forest degradation and promoting forest conservation, sustainable management of the forests and enhancement of forest carbon stocks is one mechanism developed in an attempt to mitigate greenhouse gas emissions. Various REDD+ initiatives have been trialled in developing countries, including for community forests (CFs), which are an increasingly common form of resource management. Through the program, incentives are provided to community forest user groups (CFUGs) to encourage changes in management practices likely to increase sequestration stocks. There is, however, limited knowledge about the factors responsible for enhancing carbon stocks in CFs, the likely trade-offs within communities and the potential for increasing sequestration stocks.
The overarching goal of this research is to evaluate the impacts and potential of REDD+ projects in CF systems. Results from this study provide information for the design and development of programs to increase sequestration and conservation benefits in developing countries. This study estimated carbon stocks and change in carbon stock, technical potential (maximum stocks), key factors affecting carbon stock and trade-offs between gains in sequestration and other foregone community benefits. The study covered 105 CFUGs operating within five major dominant vegetation types. Annual data of carbon pools comprising above and below ground biomass were used to analyse carbon stocks and stock changes. Where sufficient data and models for key species were available, the potential carbon stock was estimated. Social, economic and management data, including a review of existing relevant documents, key informant survey and focus group discussion were used to identify major drivers of forest carbon stock changes in CFs and added community effort and foregone cost added for REDD+. Total costs of REDD+ participation were compared with the potential carbon benefits to enable trade-offs to be identified.
vi
In comparing present carbon stock with the technical potential of carbon stock in forests, the study identified significant potential for REDD+ projects to increase carbon stock in CFs.
vii
ACKNOWLEDGEMENTS
First of all I would like to express my sincere gratitude to my supervisors Professor Geoff Cockfield and Dr Tek Narayan Maraseni for their guidance, supervision, coaching and encouragement throughout my PhD. Their continuous support, insightful comments and suggestions have been vital to the completion of this project and to the publication of five papers in peer review journals. It would not be possible for me to publish quality papers as lead author without their constructive suggestions and contribution on manuscripts. Similarly, I gained valuable insights through writing papers with them, particularly in analysing data and contributing to the paper on which I am second author.
I would like to acknowledge the University of Southern Queensland (USQ), Office of Research and Higher Degree for offering me the USQ post-graduate scholarship which was instrumental in enabling me to join the university and move further in my academic career. Similarly, I want to thank my research centre the International Centre for Applied Climate Sciences (ICACS) and Faculty of Business, Education, Law and the Arts (BELA) research staff and administrative staff for their cooperation and support.
viii
I would like to acknowledge the cooperation of members from the REDD+ pilot project which was implemented under financial assistance of the Norwegian Agency for Development Cooperation (NORAD).
I would like to thank Dr Badri Basnet, Dr Dev Raj Paudyal, Dr Arun Dhakal, Dr Arjun Neupane, Dr Rohini Prasad Devkota, Sanjib Tiwari, Suman Aryal, Hemang Sharma, Arjun KC, Gobinda Baral and Rohanmuni Bajracharya for their cooperation, encouragement and support throughout my PhD journey at USQ. I would also like to thank colleagues of the Nepalese Association of Toowoomba (NAT) executive committee and all Nepalese communities of Toowoomba for their cooperation and moral support. I would also like to thank Dr Kathryn Mary Reardon-Smith for editing and proof-reading this thesis.
Finally, a word of gratitude and appreciation to my family members, especially to my father Mohan Bahadur Pandey and mother Komal Pandey for their continuous encouragement and brothers (Gouri Shankar Pandey and Shankar Pandey), sisters (Swosthani Pandey, Saraswati Pandey and Kiran Pandey), sister-in-laws (Goma and Sakuntala), brother-in-laws (Prashuram and Madan), nieces (Elina, Garima, Ayushma, Jebina, Prinshi) and nephews (Ayam and Prince) for their continuous support. Similarly, I would like to thank my father-in-law Ram Bahadur KC and mother-in-law Indira KC for inspiration and support. Last but not least, my beloved wife Sangita and son Suyogya deserve my wholehearted thanks for their enormous patience and motivation throughout this study.
ix
TABLE OF CONTENTS
CERTIFICATION OF DISSERTATION ... ii
LIST OF PUBLICATIONS AND AWARDS ... iii
ABSTRACT ... v
ACKNOWLEDGEMENTS ...vii
TABLE OF CONTENTS ... ix
LIST OF TABLES ... xiii
LIST OF FIGURES ... xvi
LIST OF APPENDICES ... xviii
ABBREVIATIONS ... xix
1. INTRODUCTION ... 1
1.1. Background ... 2
1.2. Statement of the problem ... 3
1.3. Contentions to be tested in the study ... 6
1.4. Objectives of study ... 6
1.5. Justification of the study ... 7
1.6. Scope and significance of the study ... 7
1.7. Structure of the thesis... 8
1.8. Conclusions ... 9
2. A REVIEW OF THE CARBON SEQUESTRATION DYNAMICS AND ECONOMICS OF REDD+ IN COMMUNITY FORESTRY ... 11
2.1. Introduction ... 12
2.2. Climate change and role of forests in mitigation measures ... 12
2.2.1. Climate change and share of forestry sector in global GHGs emissions ...12
2.2.2. Global forest management practices and community forestry ...14
2.2.3. Forestry sector in climate change mitigation policy ...15
2.2.4. REDD+: introduction, challenges and opportunities ...17
2.3. Carbon pools and carbon pool measurement in community forests ... 22
2.3.1. Carbon pools in CF ...22
2.3.2. Carbon pools measurement methods ...23
2.4. Factors affecting carbon stock changes in CF ... 23
2.4.1. Possible biophysical factors ...24
2.4.2. Possible socio-economic factors ...27
2.4.3. Possible political factors ...30
2.5. Economics of REDD+ in CFs ... 31
2.5.1. Costs due to sacrificed benefits of communties for REDD+ mechanism ...32
x
2.6. Review of research methods related to CF studies ... 34
2.7. Monitoring methods of the REDD+ activities ... 35
2.8. Carbon prices in the existing market place ... 36
2.9. Review of existing models for forest growth prediction ... 37
2.10. Theoretical frameworks related to REDD+ in CF study ... 39
2.11. Conclusions ... 41
3. RESEARCH DESIGN AND METHODS ... 43
3.1. Introduction ... 44
3.2. Description of the study areas ... 45
3.2.1. Demographic information of the study area ...45
3.2.2. Precipitation and temperature of the study area ...47
3.2.3. Vegetation types of the study areas ...47
3.2.4. Forest management practice in the areas ...47
3.2.5. REDD+ project activities in the study areas ...48
3.3. Method used to estimate stocking rate of vegetations, carbon stock and carbon stock changes in CFs ... 49
3.3.1. Inventory of vegetation and carbon pool ...49
3.3.2. Analysis of vegetation and carbon pool ...54
3.4. Method used to analyse potential growth of carbon stock in CFs ... 59
3.4.1. Estimation of biomass carbon in undisturbed forests in S. robusta forests ...59
3.4.2. Estimation of carbon stock growth in S. robusta forests under CF ...60
3.4.3. Gap in carbon stock in CFs with mixed broadleaf, Schima-Castanopsis, Pine and Rhododendron-Quercus forests ...61
3.5. Methods used to analyse demographic data, forest management practices, changed behaviour and costs and benefits consequences of CFUGs for the REDD+ ... 61
3.5.1. Review of relevant documents ...62
3.5.2. Focus group discussion ...62
3.5.3. Key informant survey ...63
3.6. Methods used to analyse factors affecting carbon stock changes ... 63
3.7. Methods used to analyse trade-off between carbon benefits and community benefits ... 67
3.7.1. Costs of CFUGs for REDD+ ...67
3.7.2. Analysis of total costs and carbon benefits in REDD+ CFs ...71
3.7.3. Carbon gain estimation in CFs ...71
3.7.4. Price used in carbon revenue estimation ...71
3.8. Conclusions ... 72
xi
4.1. Introduction ... 74
4.2. Distribution of different size trees in CFs ... 74
4.3. Biomass and carbon stock dynamics in sample plots ... 76
4.3.1. Total biomass carbon in the reference year 2010 and year 2013...77
4.3.2. Change in carbon stock in sample plots in CFs between 2010 and 2013 ...81
4.4. Biomass and carbon stock in individual CF ... 84
4.5. Conclusion ... 85
5. POTENTIAL BIOMASS CARBON GROWTH IN COMMUNITY FORESTS ... 87
5.1. Introduction ... 88
5.2. Technical potential biomass carbon in Shorea robusta forests ... 88
5.2.1. Biomass carbon stock in undisturbed forests ...88
5.2.2. Biomass carbon growth in CFs ...89
5.2.3. Carbon growth in undisturbed forests, dense CFs and sparse CFs ...95
5.3. Biomass carbon growth in other vegetation types ... 96
5.4. Conclusion ... 97
6. CHANGED BEHAVIOUR OF THE COMMUNITIES AND FACTORS AFFECTING CARBON STOCK AND CARBON STOCK CHANGES IN THE REDD+ CFS ... 99
6.1. Introduction ... 100
6.2. Evidence of changed behaviour of communities related to biomass reduction in the forests ... 100
6.3. Changed practices of CFUGs for the REDD+ project ... 105
6.4. Elevation of the forests ... 109
6.5. Proximity of forests from road head ... 115
6.6. Proximity of forests from settlement ... 117
6.7. Stand age in CFs ... 119
6.8. Socio-economic aspects of CFUGs ... 119
6.8.1. Per capita forest areas ...120
6.8.2. Household level landholding ...121
6.8.3. Average change in livestock ...122
6.8.4. Biogas use ...122
6.8.5. Petroleum energy use ...123
6.8.6. Biomass extraction ...124
6.8.7. Grazing ...125
6.8.8. Caste heterogeneity ...126
xii
6.8.10. Fodder collection ...128
6.8.11. Litter collection ...129
6.9. Conclusion ... 130
7. TRADE-OFF BETWEEN SACRIFICED BENEFIT TO COMMUNITIES AND CARBON BENEFITS IN CFS ... 133
7.1. Introduction ... 134
7.2. Contribution of communities for REDD+ ... 134
7.3. Changed forest product use practices of communities for REDD+ ... 136
7.4. Conclusion ... 141
8. DISCUSSION OF FINDINGS ... 143
8.1. Introduction ... 144
8.2. Community-based forest management regime, rural livelihoods and REDD+ 144 8.3. Tree size distribution in community based forest management under REDD+ mechanism ... 145
8.4. Changes in carbon stock in CFs under REDD+ mechanism ... 147
8.5. Potential carbon growth in CFs... 151
8.6. Key factors affecting carbon stock in CFs ... 156
8.7. Trade-off between communities sacrificed benefits and carbon benefits in CFs ... 161
8.8. Sensitivity analysis of foregone benefits of communities for REDD+ mechanism ... 164
8.9. Performance of REDD+ projects in CFs ... 165
8.10. Contemporary issues in REDD+ and REDD+ CFs ... 167
8.11. Ideal CF for REDD+ benefits ... 171
9. SUMMARY, CONCLUSIONS AND RECOMMENDATIONS ... 177
9.1. Introduction ... 178
9.2. Summary of major findings ... 178
9.2.1. Distribution of different sized trees in forests and carbon stock dynamics in CFs by vegetation types ...179
9.2.2. Potential growth of carbon stock in CFs ...179
9.2.3. Key factors affecting carbon stock in CFs ...180
9.2.4. Model CFs for REDD+ projects...180
xiii
9.3. Contentions made before the study ... 181
9.4. Research contributions ... 183
9.5. Research implications ... 184
9.5.1. Implications for policy making level ...184
9.5.2. Implications for project implementation level ...185
9.6. Limitations of the study ... 186
9.7. Suggestions for further research ... 187
REFERENCES ... 189
APPENDICES ... 233
LIST OF TABLES
Table 2.1 Ownership of the global forests ... 14Table 2.2 Price of carbon dioxide equivalent (CO2e) in three different carbon marketing mechanisms where LULUCF sector is included ... 36
Table 3.1 Demographic information and size of forests in the study areas ... 45
Table 3.2 Average meteorological information of closely located stations from three watersheds in 1976-2005 ... 47
Table 3.3 Wood specific gravity used in analysis ... 56
Table 3.4 Dry to green weight ration used to convert green biomass to dry biomass of sapling ... 57
Table 3.5 Methods used for analysing factors affecting carbon stock and change in carbon stock in CFs ... 65
Table 3.6 Items and data sources used to estimate real time benefits and costs of the communities in CFs for six year (2006 -2012 i.e. three years before and three years during the REDD+ projects) ... 68
Table 3.7 Unit price of forest products in 2012 in the study areas ... 69
Table 4.1 Comparison of stocking rates of woody vegetation by species and their strata in the REDD+ CFs (in year 2010 and 2013) in the study sites ... 75
Table 4.2 Comparison of change in stocking rates (from 2010 and 2013) of woody vegetation by vegetation types and their strata in the REDD+ CFs in the study sites ... 76
xiv
Table 4.4 Pair-wise comparison of p value (assuming unequal variance, two tail) for having similar mean carbon stock (difference in mean =0) in CFs by vegetation and canopy cover differences in 2010 ... 80 Table 4.5 Comparison of changes in biomass C in three year (between 2010 and
2013, both above- and-belowground) by vegetation types and their strata in CFs in the study areas ... 82 Table 4.6 Pair-wise comparison of p- value (assuming unequal variance, two tail)
for having similar mean carbon stock (difference in mean =0) for having same changes in biomass carbon in CFs (from 2010 to 2013) by vegetation and canopy cover ... 83 Table 4.7 Average carbon stock (MgC/ha) in different canopy forests within
different altitudes estimated from sample plots ... 84 Table 4.8 Average biomass carbon (above and below ground, in year 2010 and
2013) in CFs by dominant vegetation types in the study areas ... 84 Table 4.9 Change in biomass carbon (above and below ground, between 2010 and
2013) in CFs by dominant vegetation types in the study areas ... 85 Table 5.1 Dynamic models of relative total biomass accumulation in dense S.
robusta forests ... 91 Table 5.2 Dynamic models of relative total biomass accumulation in sparse S.
robusta forests ... 92 Table 5.3 Gaps between 10th percentile and 90th percentile value of carbon stock in both dense and sparse canopy types CFs by vegetation ... 97 Table 6.1 Summary of the changed practices in CFs for REDD+ in the study areas
106
Table 6.2 Proximity (Road to plots) and average C-stock (MgC/ha in year 2010) and change in C-stock (between 2010-2013, MgC/ha) in forests analysing 21 plots located at farthest away and 21 at closest from the road head ... 115 Table 6.3 Proximity (settlement to plots) and average c-stock (MgC/ha in year
2010) and change in C-stock (between 2010-2013, t C/ha) in forests analysing 21 plots located at farthest away and 21 at closest from the local settlement 117
Table 6.4 Average age of forest stand, and stock in year 2010 (MgC/ha) and C-stock change between 2010 and 2013 (MgC/ha) in CFs by vegetation types 119
xv
Table 6.6 Household level landholding size and C-stock in year 2010(MgC/ha) and C-stock change between 2010–2013 (MgC/ha) in CFs by vegetation types 121 Table 6.7 Household level livestock unit and C-stock in the year 2010 (MgC/ha)
and C-stock change between 2010 – 2013 (MgC/ha) in CFs by vegetation types ... 122 Table 6.8 Proportion of biogas using households and C-stock in year 2010
(MgC/ha) and C-stock change between 2010 – 2013 (MgC/ha) in CFs by vegetation types ... 123 Table 6.9 Proportion of Petroleum energy (LP gas, Kerosene) using households
and C-stock in year 2010 (MgC/ha) and change in C-stock between 2010 – 2013 (MgC/ha) in CFs by vegetation types ... 124 Table 6.10 Change in quantity of biomass extraction (both timber and firewood)
and C-stock in year 2010 (MgC/ha) and C-stock change between 2010 – 2013 (MgC/ha) in CFs by vegetation types ... 125 Table 6.11 Grazing (Live Stock Unit days in a year) and C-stock in year 2010
(MgC/ha) and C-stock change between 2010–2013 (MgC/ha) in CFs by vegetation types ... 126 Table 6.12 Caste heterogeneity and C-stock in year 2010 (MgC/ha) and C-stock
change between 2010–2013 (MgC/ha) in CFs by vegetation types ... 127 Table 6.13 Quantity of grass collection and stock in year 2010 (MgC/ha) and
C-stock change between 2010 – 2013 ( MgC/ha) in CFs by vegetation types.. 128
Table 6.14 Quantity of fodder collection, and C-stock in year 2010 (MgC/ha) and C-stock change between 2010 – 2013 (MgC/ha) in CFs by vegetation types 129
Table 6.15 Quantity of litter collection, and C-stock in year 2010 (MgC/ha) and change in C-stock between 2010 – 2013 (MgC/ha) in CFs by vegetation types 130
Table 7.1 Participant number (person/ha/yr) in meetings and general assembly and forestry activities costs in the CFUGs (US$/ ha/yr) ... 135 Table 7.2 Cost of the CFUGs (US$/ ha/yr) by vegetation type due to changed
forest management practices after REDD+ in the study sites ... 136 Table 7.3 Average annual forest product collection and income from NTFP in
xvi
Table 7.4 Average annual cost (US$/ha) of the CFUGs due to changing forest product use behaviour for the REDD+ by vegetation types of the study sites 138
Table 7.5 Sacrificed benefits of communities for the REDD+ in CFs by vegetation types in the study area ... 140 Table 8.1 Comparison between our estimates and other estimates for closely
related forests for carbon stock (MgC/ha) ... 150 Table 8.2 Theoretical maximum carbon stocks by years in CF and undisturbed S.
robusta forests ... 153 Table 8.3 Age category of CFs by dominant vegetation types ... 153 Table 8.4 Scale of REDD+ project for CFs and possible issues ... 170
LIST OF FIGURES
Figure 2.1 Greenhouse gas emissions (CO2-equivalent) measured in 1970, 1990
and 2010 by five sectors in four economic regions (Source: Victor et al. 2014) 13
Figure 2.2 Development of the REDD+ mechanism in UNFCCC ... 16 Figure 2.3 Theoretical aspects for REDD+ in community forestry ... 39 Figure 3.1 Map showing the study area with three watersheds: Kayerkhola
watershed (271 –1,618m asl) in Chitwan district; Ludikhola watershed (418– 1,401m asl) in Gorkha district; and Charnawati watershed (652–3,238m asl) in Dolakha district. ... 46 Figure 3.2 Distribution of sample plots in S. robusta, mixed broadleaf, Schima
Castanopsis , Pine and Rhododendron-Quercus dominated forests in
Charnawati watershed Dolakha (A), Kayerkhola watershed Chitwan (B) and Ludikhola Watershed Gorkha (C) of the study areas ... 51 Figure 3.3 Model of a composite sample plot used to measure carbon pools during forest inventory ... 52 Figure 5.1 Cumulative biomass carbon in undisturbed S. robusta forests (adopted
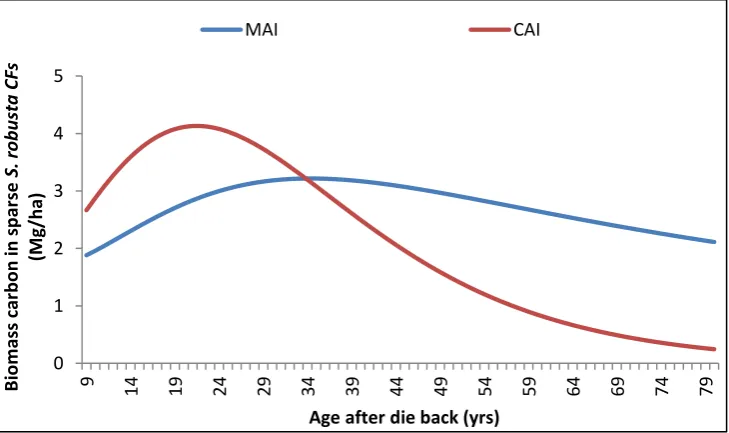
from Rautienen 1995) ... 89 Figure 5.2 Mean Annual Incremenet (MAI) and Current Annual Increment (CAI)
xvii
Figure 5.5 Mean Annual Increment (MAI) and Current Annual Increment (CAI) in dense S. robusta dominated CF ... 94 Figure 5.6 Mean Annual Incremenet (MAI) and Current Annual Increment (CAI)
in sparse S. robusta dominated CF ... 94 Figure 5.7 Cumulative biomass carbon in undistubed natural forests with uniform
age; dense and sparse canopy CFs with average age of dominanat trees in S. robusta forests ... 95 Figure 5.8 Area under curves showing cumulative biomass carbon growth in
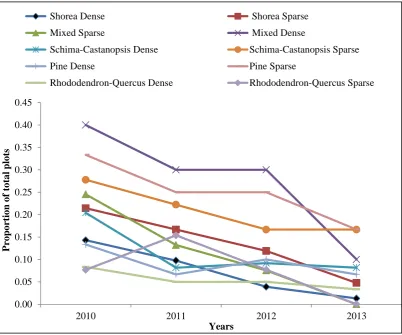
undistubed natural forests(34,708.07); (A) dense CFs (10,651.03); (B) sparse CFs (8,304.57) in S. robusta forests ... 96 Figure 6.1 Observed forest fire incidence by proportion of total plots in different
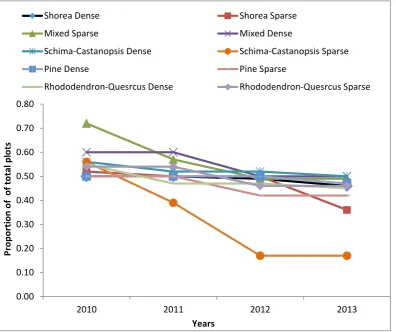
vegetation and canopy cover types ... 101 Figure 6.2 Observed livestock grazing incidence by proportion of total plots in
different vegetation and canopy cover types ... 102 Figure 6.3 Observed fodder collection incidence by proportion of total plots in
different vegetation and canopy cover types ... 103 Figure 6.4 Observed firewood collection incidence by proportion of total plots in
different vegetation and canopy cover types ... 104 Figure 6.5 Observed timber collection incidences by proportion of total plots in
different vegetation and canopy cover types ... 105 Figure 6.6 Scatter plots showing relationship between carbon stock (average in
year 2010 and change between 2010- 2013) in S. robusta dominant forests by canopy types ... 110 Figure 6.7 Scatter plots showing relationship between carbon stock (in year 2010
and change between 2010 - 2013) in Mixed broadleaf forests by canopy (A-F) ... 111 Figure 6.8 Scatter plots showing relationship between carbon stock (in year 2010
and change between 2010-2013) in Schima-Castanopsis forests by canopy types (A-F) ... 112 Figure 6.9 Scatter plots showing relationship between carbon stock (average in
year 2010 and change between 2010- 2013) in Pine forests by canopy types (A-F) ... 113 Figure 6.10 Scatter plots showing relationship between carbon stock (average in
year 2010 and change in carbon stock between 2010 and 2013) in
xviii
Figure 6.12 Proximity of sample plots from settlement ... 118 Figure 8.1 REDD+ project performance cycle can be used during REDD+
evaluation (adopted from Liu and Walker (1998)) ... 165 Figure 8.2Theoretical growth pattern of carbon stock in forests [Adopted from
growth pattern of trees mentioned in literatures (Birch 1999; Clark & Clark 1999) which was found similar in this study] ... 175
LIST OF APPENDICES
Appendix A: Checklist for key informant survey ... 233 Appendix B: Checklist used to collect forest related information from documents
available with CFUGs ... 234 Appendix C: Checklist used to collect costs and benefits data from documents
available with CFUGs ... 235 Appendix D: Checklist of the questions asked in group discussion ... 236 Appendix E: A format used to collect forest resource inventory data in each
sample plot ... 237 Appendix F: Comparison of biomass (both above ground and below ground) using four year measurement data by vegetation types and canopy strata of CFs in the study areas ... 240 Appendix G: Average carbon stock (MgC/ha) in individual CF in the study areas
243
xix
ABBREVIATIONS
3PG Physiological Principle Predicting Growth Model
AGTB Above Ground Tree Biomass
AGSB Above Ground Sapling Biomass
AFOLU Agriculture, Forestry and Other Land Use
ANSAB Asia Network for Sustainable Agriculture and Bioresources
BEF Biomass Expansion Factor
BGTB Below Ground Tree Biomass
BGSB Below Ground Sapling Biomass
DoF Department of Forests
C Carbon
CAI Current Annual Increment
CBA Cost Benefit Analysis
CBD Convention on Biological Diversity
CDM Clean Development Mechanism
CER Certified Emissions Reduction
CF Community Forest
CFUG Community Forest User Group
cm Centimetre
CO2 Carbon Dioxide
CO2e Carbon Dioxide Equivalent
COP Conferences of the Parties
DANIDA Danish International Development Agency
DBH Diameter at Breast Height
DHM Department of Hydrology and Meteorology
EU-ETS European Union Emissions Trading System
FAO Food and Agriculture Organisation
FCPF Forest Carbon Partnership Facility
FECOFUN Federation of Community Forestry Users Nepal
FGD Focus Group Discussion
FSC Forest Stewardship Council
xx
g Gram
GA General Assembly
GHG Greenhouse Gas
GIS Geographic Information System
GoN Government of Nepal
GPS Global Positioning System
H Height
ha Hectare
HB Herb Biomass
HH Household
ICIMOD International Centre for Integrated Mountain Development
ICS Improved Cooking Stove
IPCC Intergovernmental Panel on Climate Change
kg Kilogram
LB Litter Biomass
LPG Liquefied Petroleum Gas
LSU Livestock Standard Unit
LULUCF Land Use, Land Use Change and Forestry
MAI Mean Annual Increment
MFSC Ministry of Forests and Soil Conservation
Mg Mega gram
mm millimeter
MMF Morgen-Mercer- Flodin
MPFS Master Plan for Forestry Sector Nepal
MRV Measurement, Reporting and Verification
MSY Maximum Sustained Yield
NARC National Agriculture Research Coulcil
NARMSAP Natural Resource Management Sector Assistance Programme
NORAD Norwegian Agency for Development Cooperation
NSCFP Nepal Swiss Community Forestry Project
NTFP Non-Timber Forest Products
xxi
REDD+ Reducing Emissions from Deforestation and Forest Degradation,Sustainable Management,
Conservation and Enhancement of Forest Carbon Stock
PES Payment for Ecosystem Services
R2 Coefficient of Determination
REL Reference Emission Level
SBSTA Subsidiary Body for Scientific and Technological Advice
SD Standard Deviation
SOC Soil Organic Carbon
UN United Nations
UNFCCC United Nations Framework Convention on Climate Change
UNFF United Nations Forum on Forests
UN-REDD United Nations REDD+
US$ United States Dollar
VDC Village Development Committee
1
CHAPTER ONE
1.
INTRODUCTION
2
1.1.
Background
Forest area loss is considered to be one of the major sources of greenhouse gas emissions (GHGs) (Fearnside 2000; UNFCCC 2014). Deforestation and forest degradation contribute 10–25 % of global anthropogenic emissions (Stern 2007; Van der Werf et al. 2009). To reduce deforestation and forest degradation, “REDD+” (reducing emissions from deforestation and forest degradation, conservation of the forests, sustainable management of the forests and enhancement of the carbon stock in the forests) has been trialled in developing countries (Olander et al. 2012; Streck 2012). REDD+ is expected to offer offsetting opportunities to Annex I countries (emitting more GHGs and with an obligation to reduce) for achieving their set targets of emission reduction while the non-annexed developing countries get income generating opportunities from their forest carbon enhancement performance (Angelsen 2009; Ghazoul et al. 2010).
The REDD+ program was instigated at the thirteenth session of the United Nations Framework Conventions in Climate Change (UNFCCC) Conference of Parties (COP 13) (Angelsen et al. 2012) and it is considered to be a primary agenda of the UNFCCC (UNFCCC 2007, 2010, 2011; Okereke & Dooley 2010; Szolgayová et al.
2014). Since 2007, many developing countries have initiated REDD+ readiness activities and demonstration projects (Cerbu et al. 2011). These initiatives are taking place under a number of bilateral and multilateral funding arrangements including the United Nations REDD+ (UN-REDD+) program and the World Bank’s Forest Carbon Partnership Facility (FCPF). These projects are implementing pilot activities for the REDD+ at both project and national levels (Angelsen et al. 2009; Blom et al.
2010; Hajek et al. 2011; Leggett & Lovell 2012).
While implementing REDD+ mechanisms, safeguarding social or environmental benefits and developing credible Monitoring, Reporting and Verification (MRV) guidelines have been identified as key issues which need to be addressed by researchers (Angelsen et al. 2012). These issues were raised during negotiations and the Subsidiary Body for Scientific and Technological Advice (SBSTA) requested that developing countries be provided with guidance and support to address them (Johns et al. 2008; UNFCCC 2011). As each developing country is unique in terms of its economic status (Lee 2005), each has different capacity to adopt new technologies (Comin & Hobijn 2004), each has specific forest management policies and practices (FAO 2011), and each may need context specific REDD+ mechanisms to address these issues.
3
countries (White & Martin 2002; Agrawal et al. 2008). Therefore, community forestry, a process whereby specific community forest users protect and manage state forests in some form of partnership with the government (Hobley 1996), is important for the REDD+ mechanism.
The area of community forests is increasing in Asia and Africa in order to conserve forest, fulfil subsistence needs for forest resources and improve livelihood opportunities of the forest dependent communities (Sunderlin et al. 2008). Nepal, a Himalayan country, provides a good example of community forests (CFs) with rights of forest management and sustainable use of more than 25% of national forests (1664 917 ha) afforded to 17,808 community forest user groups (CFUGs) representing more than 35% of the population (CFD/DoF 2013). The country has piloted Forest Stewardship Council (FSC) certification and has 21 CFUGs that have met the FSC forest management standards (Kanel 2006). A REDD+ community forestry (CF) pilot project was initiated by government and non-government organisations in 2009 (MFSC 2011). CFs can increase carbon stocks and contribute in sequestering atmospheric CO2 (Maraseni et al. 2005) and the REDD+ interventions could be
instrumental in improving both people’s livelihood and carbon sequestration capacity of forests. However, REDD+ may require additional efforts and costs from communities, and poor forest dependent peoples would only be able to sacrifice the benefits they currently gain from forests if they get appropriate compensation from REDD+. Therefore there is nothing to be gained in implementing REDD+ in CFs if REDD+ carbon benefits are less than costs. Alternatively, CFUGs are able to improve the condition of forests after decade long management efforts and start to generate income by selling forest products (MFSC 2013) when benefits exceed costs. This is important for developing countries like Nepal where a total of 83% of people live in village areas, about 76% of households are involved in agriculture based economy (CBS 2011b) and farming practices are interrelated to forest resource extraction (Adhikari & Nagata 2004). Similarly, a total of 77% of total household energy demand is sourced from fuel wood in Nepal (WECS 2010) with forests the primary source.
In this context, there is a need to evaluate the REDD+ pilot projects to understand the carbon stock in CFs, factors affecting carbon stock and carbon changes, the maximum potential growth capacity of forests and the trade-off between carbon benefits and sacrificed benefits of the communities in REDD+ CFs. This knowledge may help to design REDD+ and similar programs. This PhD research strives to make a contribution on these issues by analysing an ongoing REDD+ pilot project in Nepal. In the next section, some of the issues related to this study are discussed.
1.2.
Statement of the problem
The main policy problem driving this research is that forests are one of the key sectors in mitigating the rise in the level of GHGs (specifically, CO2) in the
atmosphere (Pachauri & Reisinger 2007; Stern 2007). Deforestation and forest degradation are main causes of CO2 emissions with a global forest area loss of 5.2
4
change the existing forest management practices of local communities to increase future carbon stocks through the REDD+ incentive based mechanism. CF is an important target form of management because forest dependent people have a history of collectively working and satisfying their subsistence forest product needs while improving forest quality (Yadav et al. 2003; MFSC 2013). In pursuit of the potential economic benefits of a future REDD+ mechanism, CFUGs could change their existing practices; however, this may add costs or increase sacrificed benefits and may change governance practices (Phelps et al. 2010). Therefore there is not appropriate to implement REDD+ in CFs if REDD+ carbon benefits will be less than sacrificed benefits. From a welfare economics perspective (Hochman & Rodgers 1969), these costs could and should be fully compensated in the REDD+ mechanism (Ghazoul et al. 2010).
CFUGs comprise different community groups in terms of castes and forest resource dependency, and also encompass a range of vegetation types (Springate-Baginski et al. 2003). According to the decision of the General Assembly (GA) of a CFUG and with the approval of the district forest office, communities can also change their existing use practices and forest management activities to further improve forests and generate greater REDD+ carbon benefits. These changed activities and practices may involve additional costs to these communities which need to be estimated and identified. Knowledge about the trade-off between a community’s sacrificed benefits and the carbon benefits gained, and so also whether or not the REDD+ approach is appropriate for CFs, is limited. The following research gaps in relation to this problem were identified in the literature.
Knowledge gaps in forest carbon enhancement in CFs
Most previous studies use governance as well as forest cover and the income of local users as indicators to evaluate the outcomes of CF management (Yadav et al. 2003; Acharya 2004; Gilmour et al. 2004; Sunderlin 2004; Sapkota & Odén 2008 ). However, there are few and limited studies about carbon enhancement with the incentive motivation of REDD+ in CFs. One limitation is that there is little attention given to the disaggregation of the carbon storage performance of forest species. CF systems in Nepal vary in terms of vegetation composition and species dominance (CFD/DoF 2013) so are likely to have different capacities for carbon growth with the adoption of REDD+ activities. Some studies related to carbon accounting in forests have been carried out in government managed and protected area systems (Singh et al. 1994; Wang et al. 2008; Sharma et al. 2010; Solberg et al. 2010; Usuga et al.
2010; Köthke et al. 2014). However, for designing an appropriate REDD+ project and benefit distribution of the carbon benefits within CF systems, the carbon enhancement status of different CFs needs to be estimated.
Knowledge about gaps between actual carbon stock in CFs and potential growth in undisturbed forests
5
which would provide a benchmark for the full potential of these forests, is limited (Resosudarmo et al. 2012). If silvicultural activities are not appropriate, harvesting of forest products in higher quantities than the sustainable yield can reduce the biomass stock of forest stands (Foley et al. 2005; Hoover & Stout 2007; Chiang et al. 2008). Although, there is a specified provision of forest product harvesting and silviculture activities in operation plan of CFUGs; technical knowledge of communities and their implementation practices affect the outcomes (Pagdee et al. 2006). Therefore, the management practices of forest users in CF can lead to differences in carbon growth in managed forests compared to undisturbed forests. Estimation of carbon stock in both situations (i.e in CFs and without disturbances) is important to understanding the impact of CF. These difference will provide an idea about the maximum potential carbon benefits in CFs with REDD+ activities.
Knowledge gaps of major factors affecting carbon enhancement to design project activities to be targeted for REDD+ CF
Forest based CO2 emissions may be driven by various human induced factors
including the conversion of forest land to agricultural land, illegal harvesting, infrastructure development, forest fires, encroachment and grazing (Geist & Lambin 2002; Pandey et al. 2013). Previous studies have found that the growth capacity of forests is strongly influenced by management practices (Hoen & Solberg 1994; Foley
et al. 2005; Harmon et al. 2009). The sequestering of atmospheric CO2 may depend
on a forest’s proximity to roads (Angelsen & Kaimowitz 1999) and settlements (Laurance et al. 2006), the rate of extraction of forest products (Harmon et al. 2009), livestock grazing (Blackmore & Vitousek 2000), agriculture landholding size (Adhikari et al. 2004), alternative energy sources (Katuwal & Bohara 2009), demographic factors (Jha & Bawa 2006), size of forests (Rudel et al. 2005) and age of forest stands (Pukkala et al. 2009). These may also differ in CFs where local communities are carrying out various forestry activities according to local knowledge and needs and the location of the forest area (MFSC 2013) but also in response to REDD+ economic possibilities. CFUGs may change existing practices in response to REDD+ incentives which may then change the status and carbon stock of the forests to an extent that is yet to be identified and analysed. Understanding of the major factors responsible for carbon enhancement in CFs is important in the design and implementation of REDD+ projects.
Knowledge gap about trade-off between community’s sacrificed benefits and carbon benefits for REDD+ project in CFs
6
understood in the available literature. It is important that the community sacrificed benefits (cost) involved in enhancing carbon stock in CFs is evaluated holistically and that the REDD+ program is modified if necessary to ensure that communities are not disadvantaged through their participation.
1.3.
Contentions to be tested in the study
This research was based on several contentions during data collection, analysis and interpretation:
• Stocking rates of trees is affected by silviculture operations (Nyland 1996) therefore forest biomass (and therefore carbon stocks and sequestration rates) in CFs is affected by management practices. These include harvesting and other disturbance practices. Due to these disturbances, actual potential carbon stocks in CFs may be much lower than technical potential carbon stocks in undisturbed natural forests.
• Carbon stocks and sequestration rates are affected by various biophysical and socio-economic factors which include altitude, age, forest canopy cover, species type, size of forests, caste heterogeneity, agriculture land holding size, forest product extraction and use of alternative energy sources (Rudel 1989; Smith et al. 1997; Cochrane & Schulze 1999; Pahari & Murai 1999; Geist and lambin 2002; D'Amato et al. 2011).
• REDD+ incentives may be insufficient (Ghazoul et al. 2010), especially in the long term, to offset the economic losses from changing management practices of communities.
1.4.
Objectives of study
The overall aim of the study is to evaluate the feasibility of the REDD+ project in CF systems in Nepal by considering the gain in carbon stock in relation to costs incurred by communities.The objectives (with research sub-questions) are to:
a) Estimate carbon stocks and annual carbon stock changes in REDD+ CFs by vegetation type:
What is the total carbon stock in CFs by dominant vegetation types for a reference year of the REDD+ project?
What are the dynamics of carbon stocks in REDD+ CFs by different vegetation types?
b) Estimate the technical potential carbon stock of undisturbed forests and actual carbon stock in CFs by dominant vegetation types:
What is the technical potential of carbon growth in CFs by dominant vegetation types?
What is the actual carbon growth in CFs by dominant vegetation types?
7
c) Identify and analyse key factors affecting carbon stock changes in CFs:
What is the occurrence of biomass reduction activities after REDD+ in CFs?
What are the key biophysical and socio-economic factors affecting carbon stock changes in REDD+ CFs?
d) Identify and estimate trade-offs between carbon benefits and net sacrificed community benefits for REDD+ in CF:
What community benefits are sacrificed to enhance carbon stocks in the REDD+ CFs?
How much community benefit is sacrificed to enhance per unit amount of carbon stock in the REDD+ CFs ?
1.5.
Justification of the study
This study investigates the impact of REDD+ in CF because, while the UNFCCC has agreed to use REDD+ as a climate change mitigation option to be implemented in developing countries with an incentive mechanism (UNFCCC 2007), it is not clear that it will be an effective implementation mechanism; CF in some developing countries is recognised as a successful forest management system which respects traditional practices, fulfils local needs and generates incomes for the local people (Gilmour et al. 2004; Nurse & Malla 2006). Nepal is one of the leading countries which have been successfully implementing CF from last three decades (MFSC 2013).
This study selected to study CFs in Nepal because the Nepalese CF provides a successful model for adoption in other developing countries (Brown et al. 2002); the present CF system in Nepal has been developed from long experience (CFD/DoF 2013; MFSC 2013); government and nongovernment organisations in Nepal have been involved in REDD+ pilot initiatives in CF; and the Government of Nepal has established a separate institutional structure (REDD- Forestry and Climate Change Cell) under the Ministry of Forests and Soil Conservation (MFSC) to facilitate REDD+ activities. Moreover, a multi-partner REDD+ project in CF was implemented in Nepal from 2009 which provided ground for researching community efforts and carbon stock relationship (MFSC 2011). Finally the author has had a personal involvement in CF and earlier worked on the REDD+ pilot initiatives in Nepal. Although this study was conducted in Nepal, the overall framework of the research could be replicated and the knowledge generated from the study may be applicable in other developing countries.
1.6.
Scope and significance of the study
8
Meinshausen et al. 2009). Among different climate change mitigation options, the UNFCCC has agreed upon a REDD+ incentive based mechanism to be implemented in developing countries but scientific inputs are lacking (Caplow et al. 2011). This is important in CFs because the participation of local communities and the safeguarding of socio-economic benefits are issues for REDD+ (UNFCCC 2011) and the proper management of forest resources is suggested for poverty reduction and environmental sustainability by United Nations Forum on Forest (UNFF 2011). Without knowledge of the trade-offs between community’s added foregone costs and carbon benefits, REDD+ may lead to perverse incentives and may not address, but exacerbate, existing social, environmental and climate change problems. Therefore, this study is crucial to policy decisions.
Reducing poverty of the forest users through the sustainable use of forest resources is one of the key aims of CF (Mahanty et al. 2009). Existing CFs provide subsistence products to the communities that conserve forests but may not be enough to bring these communities out of poverty especially in rural area where limited economic options are provided (Edwards 1996; Subedi 2006). Previous studies suggest implementing economically oriented CF to address poverty issues in developing countries (Edwards 1996; Gilmour et al. 2004; Subedi 2006). This study provides learning and new knowledge for consideration during the design and implementation of REDD+ and other incentive based conservation projects in CF.
As a least developed country, the government of Nepal is also moving towards REDD+ initiatives under multinational (UN REDD, World Bank forest carbon partnership facility -FCPF) and bilateral (US government, Norwegian government) funding schemes. The Government of Nepal has agreed to facilitate a nested approach (both national and subnational level) to REDD+ projects (MFSC 2011). However, the effective implementation of the REDD+ project needs a fair benefit distribution mechanism (Hoang et al. 2013) which accounts for foregone costs. The finding of this study can help to make appropriate policies that consider both community costs and carbon benefits in CF.
1.7.
Structure of the thesis
9
under the REDD+ mechanism. Finally, Chapter Eight and Nine discuss and summarise the major findings of the study, its research contribution and implications and makes suggestions for future research.
1.8.
Conclusions
The REDD+ mechanism for developing countries is a promising concept which provides offset options to developed countries and income generation opportunities to poor forest dependent communities. CF is a participatory forestry practice that may demand additional efforts and changes in the existing practices of communities. For its long term success, an effective design and implementation of REDD+ in CFs is required; this could be better if it is based on knowledge about existing carbon stocks, the carbon stock increment potential, factors affecting carbon stock differences in CFs and trade-offs between community foregone sacrificed benefits and carbon benefits.
11
CHAPTER TWO
2.
A REVIEW OF THE
CARBON SEQUESTRATION
DYNAMICS AND
ECONOMICS OF REDD+ IN
COMMUNITY FORESTRY
A REVIEW OF THE
CARBON SEQUESTRATION
DYNAMICS AND
ECONOMICS OF REDD+ IN
12
2.1.
Introduction
Chapter one explains about major knowledge gaps on possible outcomes of the REDD+ projects in CFs, research questions for this study and its significance. This chapter includes a review of some relevant issues about climate change, the role of forests in mitigating climate change and mechanisms for reducing GHG emissions from forestry sectors. This chapter includes ten sections. The next section reviews the literature related to climate change and the role of forests in mitigation measures. The third section gives information about carbon pools and carbon pool measurement practices in forests, the fourth section includes reviews regarding possible factors affecting carbon stock changes in CFs, the fifth section covers the economics of REDD+ in CFs while the sixth section includes a review of research methods in CF. In the seventh section, the chapter covers existing knowledge about carbon prices in global markets and, in the eighth section, reviews existing yield models for forest growth prediction. The ninth section highlights information about theoretical aspects related to REDD+ in CFs and the final section provides a conclusion to the chapter.
2.2.
Climate change and role of forests in mitigation
measures
2.2.1. Climate change and share of forestry sector in global GHGs
emissions
Average global temperatures increased in the late 20th century. The rate of global surface temperature increase has been about 0.2°C per decade over the past 30 years (Hansen et al. 2006; Pachauri & Reisinger 2007). Global temperature increase and climate change are used interchangeably in literatures (Stern 2007; Shi et al. 2010; Cook et al. 2013). Anthropogenic activities are considered the main causes of climate change (Tett et al. 2002; Cook et al. 2013). According to the fifth assessment report of the Intergovernmental Panel on Climate Change (IPCC), GHG emissions from 2000 to 2010 have grown at about twice the rate observed in the decade from 1970. Of all anthropogenic GHGs, CO2 was responsible for about 55% of total
13
Figure 2.1 Greenhouse gas emissions (CO2-equivalent) measured in 1970, 1990 and
2010 by five sectors in four economic regions (Source: Victor et al. 2014)
Within AFOLU, deforestation and forest degradation contribute significant emissions. The forestry sector is important, storing huge quantities of carbon stock. At present, forests occupy 30% of the global land area and hold double the amount of carbon that is in the atmosphere (Canadell & Raupach 2008; FAO 2010b). This shows the important contribution of the forests in mitigating climate change through reducing atmospheric carbon; however, there is also significant risk of stored carbon being returned to the atmosphere through forest disturbance (Canadell & Raupach 2008). Deforestation and forest degradation contribute 10–25 % of total global emissions (Stern 2007; Van der Werf et al. 2009). Those emissions related to deforestation and forest degradation come mainly from human activities (Kasischke
et al. 1995; Nepstad et al. 1999; Hurteau et al. 2008). This is mostly in developing countries where forests are used for economic development (Koop & Tole 2001; Ewers 2006). For example, in Nepal, the area of forests decreased by 1.7% per annum from 1978 to 1994. Shrub areas of Nepal is incresing from 4.7% in 1978/79 to 10.6 % in 1994 of country areas which shows that degradation is going on in some of the existing forests (FAO 1999).
G
H
G
Em
issio
n
s
(G
t
CO
2
e
q
/y
r)
14
2.2.2.
Global forest management practices and community forestry
Clarity in ownership is an important factor in achieving the aim of sustainable forest management (Dudley et al. 2005; Jin & Sader 2006; Siry et al. 2005). At present, global forests are mainly under three ownership systems, namely public, private and community. The majority of forests are owned by government, followed by private (individual or company) and community (White & Martin 2002; FAO 2011;). Forest areas owned by government are generally larger in developed countries than in developing countries, while the opposite is the case for community owned forests which are larger in developing countries. Similarly, a larger proportion of private forests are in developed countries than in developing countries (Table 2.1). In the case of CFs, local communities are working collectively to manage their surrounding forests (Gilmour & Fisher 1991; Bray et al. 2005; Pagdee et al. 2006) through mutually agreed plans and decisions (Nurse & Malla 2006).
Table 2.1 Ownership of the global forests
Categories Government (%) Community (%) Private form (%)
Global forest 77 11 12
Developing countries 71 22 7
Developed countries 81 3 16
Tropical countries 71 19 10
Source: White & Martin (2002)
All forests contribute to global climate change mitigation (Houghton 2005; Maraseni
et al. 2005; Peichl & Arain 2007) although the quantity and trends of carbon sequestration capacity vary (Kasischke et al. 1995; Lambin 1999; Ayres 2000; Koop & Tole 2001; Pregitzer & Euskirchen 2004; Houghton 2005). A global study conducted in major forested countries found that a significant proportion of government managed forest areas have logging concessions, particularly in Canada, Democratic Republic of Congo, Central African Republic, Gabon, Equatorial Guinea, Malaysia, Cambodia and Indonesia (White & Martin 2002) indicating a possible risk of increasing deforestation and forest degradation. CF recognises the traditional forest resource use rights of local and indigenous communities who are living in areas surrounding forests and have a history of using forest resources for their basic needs (Arnold 1991; Nurse & Malla 2006). CF is expanding in developing countries (White & Martin 2002) and there are now more than 10% of global forests and over 22% forests in developing countries under this form of management (Nurse & Malla 2006). This proportion is likely to increase with the present global prioritisation of participatory forest management approaches which emphasise equity and livelihood needs, in line with the aims of decentralization, cost effective management, capacity of the local people to be a best manager and proximity to resources (Brown 1999 ; Gilmour 2003; Gilmour et al. 2004).
15
of national forest to an organized group of local communities who live around a forest and use forest products for their subsistence (Acharya 2002; Gilmour et al.
2004). After three decades of CF practices, Nepal has devolved forest management authority of more than 25% of its forested areas to 17,808 CFUGs involving more than 35% of the total population of the country (CFD/DoF 2013). Now, CFUGs are able to improve forest status and some of them have initiated to get economic benefits from sustainable harvesting of forest products (MFSC 2013).
2.2.3.
Forestry sector in climate change mitigation policy
The scientific community has identified that the maximum allowable increment in mean global temperature of 2°C above the preindustrial level to minimise future climatic impacts (Meinshausen 2006; Randalls 2010) and that this is possible by limiting GHGs emissions to 550 ppmv (parts per million by volume) CO2 equivalent
(Randalls 2010). The UNFCCC agreed to develop a collaborative plan between developed and developing countries, linked to the sustainable development agenda (UNFCCC 2010). For this, the UNFCCC through the Kyoto protocol (1997) set emission reduction targets for industrialised countries and provided options to achieve the target by adopting three mechanisms; these are the Clean Development Mechanism (CDM), joint implementation and emissions trading (Kyoto-Protocol 1997).
The IPCC fifth assessment report (2014) clearly identifies the forestry sector as one of the key sectors responsible for GHG emissions (Victor et al. 2014) while conserving and reducing forest biomass loss can provide a relatively cheap form of climate change mitigation (Stern 2007). Therefore, forestry sector emissions were included in the UNFCCC, a key intergovernmental global body that facilitates discussions on global concerns and solutions related to climate change among parties, starting from the fifth Conference of Parties (CoP) (Kyoto-Protocol 1997) (Figure 2.2). The Kyoto Protocol (1997) included afforestation (plant and develop new forests on land where forests had not existed for a long period) and reforestation (plant and develop forests where forests had previously existed) project activities under the CDM mechanism. However there were few afforestation and reforestation (A/R) projects under the CDM mechanism with only 55 A/R projects of a total of 7,531 CDM projects registered with the UNFCCC by 2014 (UNFCCC 2014). This could be a result of the cumbersome process involved in getting a project registered under the CDM (Hayashi & Michaelowa 2007) and the comparatively long time needed for forestry projects to sequester a significant quantity of atmospheric CO2.
16
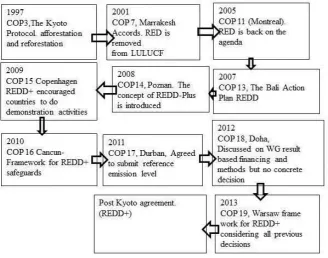
Reducing emissions from deforestation and forest degradation (REDD) was included in the Bali Action Plan at COP 13 (UNFCCC 2007). The concept of reducing deforestation and forest degradation, conservation, sustainable management of the forests and enhancement of forest carbon (REDD+) was introduced in COP 14 in Poznan (2008) and agreed in COP 15 in Copenhagen (2009). Inception of the REDD+ was supported by pressure from countries associated with the Rainforest Alliance, countries of the African Forest Commission and the advice of UNFCCC’s SBSTA. To put these decisions in practice, COP 15 encouraged developed countries to support developing countries for readiness and demonstration activities for REDD+.
While developing strategies and planning for the REDD+ is underway, the literature highlights a possible threat to biodiversity and the rights of local and indigenous communities (Angelsen 2009; Kanowski et al. 2011; Thompson et al. 2011). At the 16th COP in Cancun, parties agreed to develop appropriate guidelines for safeguarding these social and environmental principles while developing REDD+ projects in developing countries (UNFCCC 2011). The 19th COP adopted the ‘Warsaw framework’ to move forward on REDD+ which includes provisions for developing: (1) national and sub national level forest monitoring systems; (2) guidelines for safeguarding social and environmental benefits; and (3) financial and technical support for developing countries (UNFCCC 2014).
[image:37.595.117.446.416.674.2]It is now already seven years after the REDD+ concept evolved which is coming through various discussions in different COPs at the UNFCCC (Figure 2.2).
Figure 2.2 Development of the REDD+ mechanism inUNFCCC
(Source: UNFCCC websites:
http://unfccc.int/resource/docs/convkp/kpeng.pdf; http://unfccc.int/land_use_and_climate_change/lulucf/items/3063.php; http://unfccc.int/meetings/montreal_nov_2005/meeting/6329/php/view/decisions.php;
http://unfccc.int/resource/docs/2007/cop13/eng/06a01.pdf;http://unfccc.int/meetings/poznan_dec_2008/meeting/6314.php; http://unfccc.int/meetings/copenhagen_dec_2009/meeting/6295.php;
17
2.2.4.
REDD+: introduction, challenges and opportunities
a) REDD+: an introduction
REDD+ is considered to be a relatively cost effective, easy and quick way to mitigate climate change (Clements 2010; Angelsen et al. 2012; Gardner et al. 2012). The market based mechanism is expected to incentivise developing countries to undertake forest management activities to enhance carbon stocks in forests. The REDD+ will be voluntary for any developing country which can participate and present a verifiable quantity of forest carbon enhancement (Gibbs et al. 2007). It must have additionality in emission reduction or sequestration with REDD+ project activities. The additionality means that quantity of reduced emissions or increased sequestration which would not have happened without the REDD+ project activity or at the business-as-usual scenario. It includes five forestry activities for reducing forestry related carbon emissions and increasing sequestration of atmospheric carbon in developing countries. These are: (1) reducing emissions from deforestation; (2) reducing emissions from forest degradation; (3) conservation of the forests; (4) sustainable management of forests; and (5) enhancement of forest carbon stocks (UNFCCC 2010; Angelsen et al. 2012). Brief descriptions of these activities follow. Reducing emissions from deforestation: The Marrakesh accord defined deforestation as a direct human-induced conversion of forested land to non-forested land (Angelsen et al. 2008). Reducing deforestation is a primary aim of the REDD+ (de Jong et al. 2010). Government or forest owners should limit the conversion of forest areas to other land use systems from the reference forest area (UNFCCC 2007). The reference level of historical deforestation is estimated for projecting business-as-usual scenarios against which the reduction of deforestation is monitored for REDD+ outcome.
Reducing emissions from forest degradation: Forest degradation activity is a reduction of biomass stock and productivity of a forest. Forest cover in degraded forests is reduced from the reference level (Van der Werf et al. 2009). In REDD+, establishing baseline scenarios, developing a reference level and monitoring forest biomass degradation part is difficult compared to the deforestation situation (Herold & Skutsch 2011). Most forests face some sort of degradation due to human activities including CFs (GoN/MFSC/REDD-Cell 2014); however, levels of forest degradation can differ.
18
Sustainable management of forests: Sustainable management of forests means the conservation and sustainable use of forest resources without reducing existing productivity and biomass stock. This activity includes sustainable use practices ( i.e. use within the limit of yield) that create zero or positive carbon balance in the long-run (Herold & Skutsch 2011).
Enhancement of forest carbon stocks: The enhancement of forest carbon stocks is also a key part of the REDD+ mechanism. For this, activities which ensure reductions in the extraction of forest resources, plantation activities, the promotion of alternative sources of forest products and reduce pressure on forests can be designed and implemented (Geist & Lambin 2002; Nagendra 2007).
b) Challenges and opportunities on REDD+
Although, the REDD+ is a promising mechanism, the design and implementation of this mechanism is challenging (Minang & van Noordwijk 2013). It may require changes to existing historical practices and the building of political consensus between key actors in policy arenas to achieve multilevel coordination (from global to local communities) and manage complex flows of information and payments in the context of large future uncertainties about climate mitigation regimes while ensuring supply to meet strong immediate demands for food, fuel and fibre (Angelsen et al. 2012). The REDD+ has a supposition of win-win policy frameworks that help to attain dual goals of reduction in GHG emissions and reduction of poverty in developing countries (Angelsen et al. 2009). For effective implementation, appropriate REDD+ policy, projects and implementation strategies may be needed. However there are various challenges indicated and issues raised in global discussions and the literature which need to be addressed. Key issues and challenges associated with REDD+ are discussed below:
Technical challenges in developing a credible MRV mechanism: Measurement, Reporting and Verification (MRV) of the REDD+ project performance is important to show carbon sequestration performance and to claim credits. Making a credible MRV mechanism considering transparency, accountability and sustainability is an important issue for the REDD+ framework (Angelsen et al. 2009). The use of external experts in the MRV process is possible, but may increase the costs and therefore the price of carbon credits in REDD+ schemes. On the other hand, the full or partial participation of local people in the MRV process can be cost effective, transparent and sustainable (Rist et al. 2010; Danielsen et al. 2011); therefore the potential of using locally based monitoring systems in REDD+ is emphasised (Skutsch 2005; Danielsen et al. 2011). Participatory monitoring may be more suited to the CF system as local communities that are managing a forest may be involved in forest resource monitoring (Ojha et al. 2009). However, an appropriate verification mechanism would need to be developed.
19
Developing equitable benefit sharing mechanism: Multiple stakeholders are involving in forest management in developing countries including government agencies, communities and the private sector (FAO 2010b). The combined efforts of all stakeholders in REDD+ projects are expected to generate carbon credits from their forest management. Creating an environment by involving all stakeholders including local communities, accounting contributions of rural people and designing an equitable benefit distribution without promoting perverse incentives are important for an effective