0022-538X/10/$12.00 doi:10.1128/JVI.02229-09
Copyright © 2010, American Society for Microbiology. All Rights Reserved.
Two Kinetic Patterns of Epitope-Specific CD8 T-Cell Responses
following Murine Gammaherpesvirus 68 Infection
䌤
Michael L. Freeman,
1Kathleen G. Lanzer,
1Tres Cookenham,
1Bjoern Peters,
2John Sidney,
2Ting-Ting Wu,
3Ren Sun,
3David L. Woodland,
1Alessandro Sette,
2and Marcia A. Blackman
1*
Trudeau Institute, Saranac Lake, New York 129831; La Jolla Institute of Allergy and Immunology, La Jolla,
California 920372; and University of California at Los Angeles, Los Angeles, California 900953
Received 22 October 2009/Accepted 28 December 2009
Murine gammaherpesvirus 68 (␥HV68) provides an important experimental model for understanding mechanisms of immune control of the latent human gammaherpesviruses. Antiviral CD8 T cells play a key role throughout three separate phases of the infection: clearance of lytic virus, control of the latency amplification stage, and prevention of reactivation of latently infected cells. Previous analyses have shown that T-cell responses to two well-characterized epitopes derived from ORF6 and ORF61 progress with distinct kinetics. ORF6487-specific cells predominate early in infection and then decline rapidly, whereas ORF61524-specific cells
continue to expand through early latency, due to sustained epitope expression. However, the paucity of identified epitopes to this virus has limited our understanding of the overall complexities of CD8 T-cell immune control throughout infection. Here we screened 1,383 predicted H-2b
-restricted peptides and identified 33 responses, of which 21 have not previously been reported. Kinetic analysis revealed a spectrum of T-cell responses based on the rapidity of their decline after the peak acute response that generally corresponded to the expression patterns of the two previously characterized epitopes. The slowly declining responses that were maintained during latency amplification proliferated more rapidly and underwent maturation of functional avidity over time. Furthermore, the kinetics of decline was accelerated following infection with a latency-null mutant virus. Overall, the data show that␥HV68 infection elicits a highly heterogeneous CD8 T-cell response that segregates into two distinctive kinetic patterns controlled by differential epitope expression during the lytic and latency amplification stages of infection.
Murine gammaherpesvirus 68 (␥HV68) is a mouse pathogen closely related to the human gammaherpesviruses Epstein-Barr virus (EBV) and Kaposi’s sarcoma-associated herpesvirus (KSHV). Intranasal infection of mice with␥HV68 leads to an acute infection in lung epithelial cells that is ultimately cleared and the concurrent establishment of latency in B cells, den-dritic cells, and macrophages that undergoes amplification in the spleen and is maintained lifelong (11, 12). Even though
␥HV68 has the capacity to downregulate major histocompati-bility complex class I (MHC-I) molecules (36), CD8 T cells
specific for ␥HV68 are generated and have been shown to
proliferate in response to cognate antigen, protect naive mice from␥HV68 infection, lyse peptide-pulsed target cellsin vivo
andin vitro, and maintain the ability to produce antiviral cy-tokines (5, 6, 13, 27, 35). Until recently, knowledge of the antiviral CD8 T-cell repertoire in C57BL/6 mice was largely limited to two well-characterized epitopes derived from ORF6 and ORF61. T-cell responses to these epitopes have been shown to progress with distinct kinetics, with ORF6487-specific cells predominating early in infection and ORF61524-specific cells continuing to expand through early latency before declin-ing and then persistdeclin-ing at higher levels late in infection (33). The difference in response kinetics correlates with the differ-ential presentation of the epitopes, with the ORF6487epitope
being expressed only during lytic infection and the ORF61524
epitope being expressed both during lytic infection and during the latency amplification phase (22, 28). Additionally, the la-tency amplification phase is associated with the expansion of CD8 T cells with a V4 T-cell receptor (TCR) component in several mouse strains (17), presumably due to a superantigen-like effect of the␥HV68 M1 protein (4, 9).
To better understand the breadth of the anti-␥HV68 T-cell response, we used an enzyme-linked immunospot (ELISpot) ap-proach to identify new epitopes. We identified a large number of epitopes derived from 26 proteins that drive the acute CD8 T-cell response to␥HV68, which then narrowed over time, resulting in a limited antiviral response during latency. We did not observe inflation of any of the responses, as has been demonstrated for some murine cytomegalovirus (MCMV)-specific responses (20, 26). There was no evidence for functional exhaustion, as all de-tectable CD8 T-cell responses maintained functionality, but the responses declined in numbers over time. The decline in re-sponses occurred over a broad kinetic range, which segregated into two general groups that correlated precisely with those pre-viously described for ORF6 and ORF61. Thus, some responses declined rapidly after the acute phase of infection, while others declined more slowly.
We examined two epitope-specific responses from each of the two patterns in detail over time for functional and pheno-typic characteristics and found the responses to be highly het-erogeneous, differing in TCR affinity, functional avidity, and proliferation rates. Importantly, slowly declining responses were not maintained as efficiently after infection with a
latency-* Corresponding author. Mailing address: Trudeau Institute, 154 Algonquin Avenue, Saranac Lake, NY 12983. Phone: (518) 891-3080, ext. 316. Fax: (518) 891-5126. E-mail: mblackman@trudeauinstitute .org.
䌤Published ahead of print on 6 January 2010.
2881
on November 8, 2019 by guest
http://jvi.asm.org/
deficient virus, consistent with a role for epitope expression in driving the heterogeneous rate of decline in cell number after the acute infection. The data show that the response kinetics
seen for the ORF6487and ORF61524 responses are broadly
applicable to multiple CD8 T-cell epitopes.
MATERIALS AND METHODS
Mice and viral infections. Female 6- to 12-week-old C57BL/6 mice were obtained from the Trudeau Institute animal facility and kept under specific-pathogen-free conditions. Mice were anesthetized with 2,2,2-tribromoethanol
and infected intranasally (i.n.) with 400 PFU murine␥HV68 (strain WUMS) or
AC-RTA (18a) in 30l Hanks’ balanced salt solution (HBSS). All animal
experiments were approved by the Institutional Animal Care and Use Commit-tee of the Trudeau Institute.
Tetramers and flow cytometry.Allophycocyanin-conjugated MHC-I tetramers
specific for ␥HV68 epitopes Db/ORF6
487–495 (p56, AGPHNDMEI), Kb/
ORF61524–531 (p79, TSINFVKI), Kb/ORF75c940–947 (KSLTYYKL), and Kb/
ORF48148–155(TNYKFSLV) were obtained from the Trudeau Institute
Molec-ular Biology Core Facility. Cells were treated with Fc Block and then stained with tetramers for 1 h at room temperature, followed by incubation with appropriate
antibodies. Fluorochrome-conjugated antibodies against CD8␣, CD27, CD43
(1B11), CD44, CD127, KLRG1, and V4 TCR were purchased as needed. To
measure intracellular Bcl-2, cells were permeabilized following surface staining using the BD Pharmingen Cytofix/Cytoperm kit according to the manufacturer’s instructions. All samples were collected on a BD FACSCanto II cytometer and analyzed using FlowJo software (TreeStar).
Intracellular cytokine assay.Cells were incubated with congenic splenocytes
and 10g/ml appropriate peptide for 5 h at 37°C in the presence of brefeldin-A
and then washed, labeled, and permeabilized using the BD Pharmingen Cytofix/
Cytoperm kit according to the manufacturer’s instructions. Antibodies to gamma
interferon (IFN-␥) and tumor necrosis factor alpha (TNF-␣) were purchased
from BD Pharmingen. For the functional avidity assay, 100-fold dilutions of each
peptide were used and maximum IFN-␥was set as the amount produced with 10
g/ml peptide.
In vivo cytotoxicity assay.Splenocytes from congenic (CD45.1 or Thy1.1)
uninfected mice were pulsed with 10g/ml of the appropriate peptide for 5 h at
37°C. Experimental peptide-pulsed splenocytes were labeled with differential concentrations of carboxyfluorescein diacetate succinimidyl ester (CFSE), and
control peptide (influenza NP366)-pulsed cells were left unlabeled. Cells were
mixed in a 1:1:1 ratio in two groups (Thy1.1 donors, ORF6487/ORF48148/NP366;
CD45.1 donors, ORF61524/ORF75c940/NP366), and 6 ⫻107 cells from each
donor were intravenously injected into mice that had been previously infected
with␥HV68 (or into naive mice to calculate specific lysis). Spleens were
har-vested from recipient mice approximately 16 h postinjection, and CD45.1 or Thy1.1 donor cells were identified and enumerated using flow cytometry. Lysis
was calculated in individual mice using the formula (1⫺ratio uninfected/ratio
infected)⫻100.
BrdU incorporation assay.To measure proliferation, mice were treated with 0.8 mg/ml 5-bromo-2-deoxyuridine (BrdU) in their drinking water for 4 consec-utive days at various times postinfection (p.i.). After 4 days, splenocytes were harvested and BrdU incorporation was measured using the BD Pharmingen BrdU kit with DNase in accordance with the manufacturer’s instructions.
Tetramer affinity assay.Splenocytes were isolated 12 days p.i. and labeled with MHC-I tetramers for 1 h at room temperature. Cells were then washed and
incubated with unlabeled anti-H-2Kb
/Db
antibody (Ab) for various times at 37°C.
Cells were then washed and labeled with Ab to CD8␣. Maximum tetramer
binding was set to the percentage of tetramer⫹CD8 T cells without incubation
with anti-MHC Ab.
Bioinformatics and MHC peptide binding assays.To identify potential CD8
[image:2.585.135.449.73.369.2]T-cell epitopes from throughout the␥HV68 genome, protein sequences were
FIG. 1. Robust early CD8 T-cell response to␥HV68. (A) Mice were infected with 400 PFU␥HV68; at the given times, splenocytes were harvested, and 106cells were stimulated for 48 h with 5⫻105irradiated APCs pulsed with peptides or the medium control in a standard ELISpot
assay for IFN-␥. The numbers of spots per 106cells minus the medium control (⫾standard deviations [SD]) are shown. The dashed line is at 30
spots above background at 12 days p.i. Samples were run in duplicate per experiment, and data are from 3 or 4 experiments per time point. (B) The number of predicted MHC-I binding epitopes per open reading frame (ORF) is shown versus the amino acid length of the protein.r2is 0.6904.
on November 8, 2019 by guest
http://jvi.asm.org/
analyzed using previously described algorithms (25) that predict the affinity of
peptides for H-2Kb(8- and 9-mers) and Db(9- and 10-mers) class I molecules.
Peptides scoring in the top 1% range for each allele/size combination were selected for further study and were synthesized as crude material by Mimotopes (Clayton, Victoria, Australia).
MHC purification and quantitative assays to measure the affinity for binding of
peptides to purified H-2Kb
and H-2Db
molecules were performed as previously described (21, 31). Briefly, 0.1 to 1 nM radiolabeled peptide was coincubated at
room temperature with 1M to 1 nM purified MHC in the presence of 1 to 3M
human2-microglubulin (Scripps Laboratories) and a cocktail of protease
in-hibitors. After a 2-day incubation, binding of the radiolabeled peptide to the corresponding MHC-I molecule was determined by capturing MHC/peptide complexes on Lumitrac 600 microplates (Greiner Bio-One) coated with either
the Y3 (anti-H-2Kb) or 28-14-8s (anti-H-2 Db, Ld, and Dq) antibody and
mea-suring bound cpm using the TopCount microscintillation counter (Packard In-strument Co.).
For competition assays, the concentration of peptide yielding 50% inhibition
of the binding of the radiolabeled peptide (IC50) was calculated. Peptides were
typically tested at 6 different concentrations covering a 100,000-fold dose range and in 3 or more independent assays. Under the conditions utilized, where the
concentration of the radiolabeled peptide is⬍MHC concentration and IC50is
ⱖMHC concentration, the measured IC50s are reasonable approximations of
true binding affinities (3, 16).
IFN-␥ELISpot assay.Splenocytes from infected mice and irradiated naive splenocytes (3,000 rads) were incubated for 48 h at 37°C in a standard
enzyme-linked immunospot (ELISpot) assay. For all assays, 1g/ml of appropriate
peptide or a no-peptide control was used. Purified capture Ab and biotinylated detection Ab were purchased from BD Pharmingen, and Fast BCIP/NBT (Sigma) substrate and streptavidin-alkaline phosphatase (Dako) enzyme were used.
RESULTS
Robust early CD8 T-cell response to␥HV68.To better un-derstand the T-cell response to␥HV68, we characterized the breadth of the antiviral CD8 T-cell response. Using an MHC-I binding prediction algorithm for H-2Kband H-2Db, we
iden-tified and synthesized 1,383 potential CD8 T-cell epitopes from
coding sequences throughout the␥HV68 genome (25). Each
of these peptides was screened for its ability to induce IFN-␥
release by splenocytes from mice that had been infected with
␥HV68 (12 days p.i.) in a standard ELISpot assay (Fig. 1A). We identified 33 peptides that reproducibly induced IFN-␥ responses, including some that had been published previously (14, 23, 33, 34). The 33 responses we detected were derived from 26 proteins. In general, the larger the protein the more predicted epitopes they contain (Fig. 1B), but 6 genes (ORF38, ORF45, ORF52, M10b, M12, and M14) were not predicted to encode any MHC-I restricted epitopes.
In the mouse model of the betaherpesvirus murine cytomeg-alovirus (MCMV), several patterns of antiviral T-cell re-sponses develop in response to infection, including a delayed but prolonged accumulation of some epitope-specific cells termed “memory inflation” (20, 26). To determine whether memory inflation was also driven by␥HV68 infection, we in-vestigated whether any of the 33 T-cell responses we identified at 12 days p.i. inflated over time. As shown in Fig. 1A (solid bars), we found no evidence for inflation of any of the antiviral CD8 T-cell responses. On the contrary, there was a dramatic reduction in the breadth of the response, as many of the pep-tides failed to induce IFN-␥release at the late time point. This could be due to impairment in the ability of the cells to syn-thesize or release IFN-␥, a reduction in the number of IFN-␥ -producing cells, or a combination of both.
During the course of our study, a separate report
identi-fied 19 previously unknown ␥HV68-specific CD8 T-cell
epitopes using a caged MHC-I tetramer approach (14). In addition to three well-characterized epitopes (ORF61524,
[image:3.585.43.539.81.299.2]ORF6487, and ORF8604) and 9 of the 19 epitopes recently identified using the caged tetramer approach, our screen identified 21 novel CD8 T-cell epitopes (Table 1). Compar-ative analysis of the affinity of binding to MHC-I by the epitopes identified in our screen and those identified by the caged tetramer technique showed that the binding affinity of
TABLE 1. Novel CD8 T-cell epitopes identified by ELISpot assay
ORF Amino acids Sequence Function Gene
expressiona
MHC
restriction IC50(nM)b
ORF40 599–606 ILSNYETL Helicase-primase L Kb 423
ORF21 586–595 FCYELSKPHM Thymidine kinase E Db 6,323
ORF25 1208–1216 YSPENAAKL Major capsid protein L Db 10
ORF74 250–258 VSFICTTIL G-protein coupled receptor L Kb 80
ORF75a 807–814 SHIIWVSL Tegument protein/FGARAT IE Kb 313
ORF67 148–157 NSMVVCRTYI Tegument protein L Db 417
ORF60 227–234 VEYSFIAA Ribonucleotide reductase, small subunit E Kb 671
ORF22 175–182 KYVEYGSL Glycoprotein H E Kb 90
ORF24 447–456 YSVKEPSFTI Unknown function E Db 21,558
ORF7 83–92 LSHENTYDHV Transport protein L Db 930
ORF66 20–28 RSFCIYGHL Unknown function L Kb 75
ORF7 496–504 YKLLNGPLI Transport protein L Db 11
ORF9 283–291 SSWPPYNIL DNA polymerase E Kb 121
ORF40 323–330 ITSMWPLL Helicase–primase L Kb 102
ORF19 386–924 FSFLMENYL Tegument protein L Kb 510
M4 136–143 TIYSVVPV Unknown function E Kb 67
ORF39 209–216 LVLFYRPI Glycoprotein M L Kb 149
ORF22 410–418 VSAHAFTFM Glycoprotein H E Kb 99
ORF58 322–329 NGVYFVYL Unknown function E Kb 147
ORF64 1604–1611 ISTNSAKL Tegument protein L Kb 973
ORF69 193–201 IFFEETNGM Unknown function E Kb 471
a
IE, immediate early; E, early; L, late.
b
IC50, 50% inhibitory concentration.
on November 8, 2019 by guest
http://jvi.asm.org/
the epitopes identified by the ELISpot method was signifi-cantly lower (Fig. 2).
Dynamic range of CD8 T-cell response kinetics.Although we did not observe inflation of any of the 33 responses by 6 months p.i. and although all responses declined over time, we observed variation in the patterns of decline among the responses. To investigate this in more detail as well as to independently confirm the identified epitopes, we resynthe-sized 13 of the peptides from Fig. 1 and used them to stimulate CD8 T cells from␥HV68-infected mice at various times after infection in an intracellular cytokine stain assay.
All resynthesized peptides induced IFN-␥ production, and
some responses showed a prolonged ability to produce IFN-␥, maintaining greater than 40% of their 12-day IFN-␥ production at 49 days p.i. (Fig. 3A). Other responses showed a faster decline in their ability to synthesize IFN-␥, such that at 49 days, less than 40% of their 12-day IFN-␥production level remained intact (Fig. 3B). The kinetic patterns did not correlate with the affinity of each peptide for MHC-I (Fig.
3C). As previously reported, the well-characterized
ORF61524- and ORF6487-specific responses segregated into the two patterns, consistent with their differential expression throughout infection (22, 33).
Multifunctionality of␥HV68-specific responses.The ability of T cells to exhibit multiple effector functions correlates with their protective efficacy (7). In chronic infections such as HIV and hepatitis C virus (HCV) infections in humans and lymphocytic choriomeningitis virus (LCMV) infection in mice, CD8 T cells can lose their effector functions in a stepwise manner and become functionally exhausted (15, 30, 41). Using peptide-specific stimulation and intracellular cy-tokine staining, we examined the ability of CD8 T cells
specific for 6 different epitopes to produce IFN-␥ and
[image:4.585.101.224.69.206.2]TNF-␣at 12 and 49 days p.i. (Fig. 4A). Although the total production of IFN-␥and the ratio of IFN-␥⫹TNF-␣⫹cells to IFN-␥⫹TNF-␣⫺cells dropped for each response at the later time point, there was still a considerable proportion of the IFN-␥⫹cells that can also synthesize TNF-␣at 49 days after infection. Additionally, at all times examined, all IFN-␥⫹cells were also positive for CD107a, a marker for lytic granule release (data not shown) (1). As targeted re-lease of lytic granules is closely correlated with the ability of CD8 T cells to kill virally infected cells, we measured the
FIG. 2. Comparison of MHC-I binding affinities. The log10
concen-trations of peptide yielding 50% inhibition of binding of radiolabeled peptide (IC50s) are shown for 21 previously published epitopes and the
21 epitopes newly identified in this report (Table 1).***,P⬍0.0001 (Student’sttest).
FIG. 3. Two patterns of CD8 T-cell response kinetics. (A and B) CD8 T cells from infected mice were stimulated for 5 h in the presence of brefeldin-A with congenic splenocytes pulsed with the indicated peptides and then analyzed by flow cytometry. The percentage of CD8 T cells that produced IFN-␥was normalized to the percentage at 12 days after infection. (A) Pattern 1 responses maintained 40% or greater of the 12-day value at 49 days after infection (n⫽3/group). (B) Pattern 2 responses maintained less than 40% of the 12-day value at 49 days after infection (n⫽ 3/group). (C) The IC50values for the 11 pattern 1 and 4 pattern 2 responses are shown. ns, not significant (Student’sttest).
on November 8, 2019 by guest
http://jvi.asm.org/
[image:4.585.85.504.435.678.2]ability of T cells specific for each of the epitopes to kill
CFSE-labeled target cells pulsed with cognate antigen in
vivo in a 16-h cytotoxicity assay (Fig. 4B). CD8 T cells
specific for all 6 epitopes could specifically lyse target cells 12 days after infection, and most of the responses main-tained their cytotoxic ability as late as 6 months after infec-tion. Given the low frequency of IFN-␥⫹cells at 6 months p.i. in the ELISpot assay for each epitope (Fig. 1A), the prolonged ability to kill target cells in vivo suggests that
these responses maintain functionality as they decline in numbers.
[image:5.585.83.503.70.342.2]Decline in numbers of CD8 T-cell responses.To distinguish a loss of T-cell function from a decline in numbers, we made MHC-I tetramers with two new epitopes representative of each of the response patterns, ORF48148and ORF75c940, and compared these with ORF6487and ORF61524in terms of tet-ramer-positive CD8 T-cell numbers, function, and phenotype (Table 2).
FIG. 4. Multifunctionality of␥HV68-specific responses. (A) CD8 T cells were analyzed by intracellular flow cytometry for IFN-␥and TNF-␣ synthesis following 5 h of stimulation with the indicated peptides. Numbers indicate the percentages of CD8 T cells in the quadrant. Data are representative of 3 experiments per time point. (B) T-cell cytotoxicity was measuredin vivo. Infected mice were injected with CFSE-labeled congenic splenocytes that had been pulsed with a␥HV68 peptide epitope or influenza virus NP366epitope as a negative control. Spleens were
harvested 16 h later, and specific killing was calculated as described in Materials and Methods. Data are representative of at least 3 experiments per time point.
TABLE 2. CD8 T-cell epitopes for MHC-I tetramer synthesis
Pattern ORF Amino
acids Sequence Function
Gene
expressiona MHC
restriction IC50(nM)
b
Tetramer
1 ORF9 283–291 SSWPPYNIL DNA polymerase E Kb 120 No
1 ORF17 308–316 SAITNHAAF Capsid protein E Db 81 No
1 ORF25 1208–1216 YSPENAAKL Major capsid protein L Db 10 No
1 ORF39 209–216 LVLFYRPI Glycoprotein M L Kb 149 No
1 ORF40 323–330 ITSMWPLL Helicase-primase L Kb 102 No
1 ORF48 148–155 TNYKFSLV Unknown function E Kb 10 Yes
1 ORF54 253–260 AVVQFIRV dUTPase E Kb 45 No
1 ORF61 524–531 TSINFVKI Ribonucleotide reductase, large subunit E Kb 32 Yes
1 ORF75c 176–184 SAIENYETF Tegument protein/FGARAT L Db 10 No
2 ORF6 487–495 AGPHNDMEI Single-stranded DNA binding protein E Db 14 Yes
2 ORF21 304–311 TGFRYSYM Thymidine kinase E Kb 11 No
2 ORF39 167–174 FVYLFHFM Glycoprotein M L Kb 16 No
2 ORF75c 940–947 KSLTYYKL Tegument protein/FGARAT L Kb 11 Yes
a
E, early; L, late.
b
IC50, 50% inhibitory concentration.
on November 8, 2019 by guest
http://jvi.asm.org/
[image:5.585.45.543.559.709.2]At various times after infection, splenocytes from ␥ HV68-infected mice were stained for binding of CD8 and a tetramer (Fig. 5A). The two pattern 1 responses were characterized by a lower percentage of lymphocytes at 12 days p.i. than at 21 days p.i., whereas the pattern 2 responses were higher earlier. By 4 months p.i., however, only the ORF61524-specific T cells
were retained in sizable numbers. Thus, the kinetics of the ORF75c940- and ORF48148-specific responses are consistent
with the previously characterized kinetics for ORF6487- and ORF61524-specific responses, respectively. We then compared
the percentage of CD8s that were tetramer positive with the percentage of CD8s that were positive for IFN-␥ synthesis
following stimulation at each time point (Fig. 5B). There was significant correlation between the numbers of tetramer⫹cells and IFN-␥ production, indicating that the loss of cytokine production we observed by ELISpot (Fig. 1A) and intracellular staining (Fig. 3 and 4) was due to a decline in T-cell numbers and not to impaired functionality or exhaustion.
It has been reported that␥HV68 expresses a superantigen activity that drives a mononucleosis-like expansion of CD8 T cells expressing a V4 TCR component (4). ORF61524- and ORF6487-specific cells have been shown previously to be
[image:6.585.74.504.70.495.2]ex-cluded from this V4 population (10, 33), and our current data show that neither the ORF48148- nor ORF75c940-specific cells
FIG. 5. CD8 T-cell responses maintain functionality, but are reduced numerically over time. (A) Spleens were harvested from␥HV68-infected mice at the indicated times, and cells were stained with an MHC-I tetramer and antibody to CD8. Zebra plots are representative of at least 3 experiments. Numbers indicate percentages of lymphocytes positive for CD8 and the tetramer. (B) Shown are the percentages of CD8 T cells that produced IFN-␥in response to peptide stimulation versus the percentages of CD8 T cells that bound that particular MHC-I tetramer at all time points tested.r2values are as follows: ORF61
524, 0.9515; ORF48148, 0.9441; ORF6487, 0.9518; ORF75c940, 0.9763 (n⫽20/group). (C) At 41 days
p.i., spleens were harvested and stained with antibodies to CD8, the tetramer, and TCR V4. Numbers indicate percentages of CD8 T cells in each quadrant (n⫽3).
on November 8, 2019 by guest
http://jvi.asm.org/
were involved in the V4 expansion (Fig. 5C). It remains to be
determined whether the expanded V4 population includes
any of the other new epitopes we have identified.
To determine whether the distinct response patterns re-flected differences in the rates of proliferation of T cells with different specificities, we analyzed the incorporation of a thy-midine analog, 5-bromo-2-deoxyuridine (BrdU), into DNA. At each time tested, antigen-experienced CD44hi cells, but not
naive CD44locells, underwent proliferation, but proliferation
declined over time (Fig. 6A). We compared the rates of DNA synthesis in T cells with different specificities (Fig. 6B). A higher percentage of pattern 1 T cells proliferated at 20 days p.i., consistent with their slower decline in numbers at day 49 (Fig. 3A) compared to pattern 2 responses (Fig. 3B). We also measured intracellular levels of the antiapoptotic molecule Bcl-2. At 12 and 20 days after infection, we saw no differences in Bcl-2 expression between pattern 1 and pattern 2 responses (data not shown), suggesting that the rates of cell death for the responses are similar. Thus, it appears that the greater prolif-eration of pattern 1 responses at the peak of infection, and not increased cell death of pattern 2 responses, is responsible for the kinetic differences between the two patterns that we ob-serve.
To further understand how the two kinetic patterns are regulated, we examined the surface expression of activation and memory markers on the four virus-specific T-cell popula-tions (Fig. 7A). Consistent with immune responses to other respiratory infections (18), most cells exhibited a highly acti-vated CD27hiCD43hiphenotype early after␥HV68 infection.
Over time, the populations shifted toward a less activated CD27⫹/⫺CD43lophenotype. At 21 days p.i., a higher
percent-age of ORF61524-specific cells retained an activated phenotype than did cells of other specificities (Fig. 7B). We also examined the memory phenotype by examining surface expression of CD127 (interleukin-7R␣[IL-7R␣]), a marker that is expressed on naive cells, is downregulated during activation, and is reex-pressed during memory (19, 29), and KLRG-1, a marker of terminal differentiation (Fig. 7C, D, and E) (29, 40). The pop-ulations progressed from low to higher CD127 expression, consistent with the development of memory (Fig. 7C and D).
The cells adopted and maintained a KLRG-1hi phenotype,
similar to cells from other persistent infections in mice and
humans (32, 38), but ORF75c940-specific cells expressed lower levels of KLRG-1 than the other epitope-specific cells (Fig. 7C and E). These results suggest that T cells from different kinetic patterns express relatively similar levels of CD127 and KLRG1, and by 2 months p.i., there is a shift toward a less activated, memory phenotype, albeit one that is KLRG-1hi.
It has been shown previously that the ORF6487-specific T-cell population does not change TCR affinity (affinity of the TCR for cognate peptide-MHC complexes) or functional avid-ity (the abilavid-ity to produce IFN-␥in response to a given con-centration of peptide-MHC complexes) over time, as
deter-mined from the tetramer dissociation rate and IFN-␥
production at low antigen densities, respectively (5). Whether this is also the case for the other epitope-specific responses is currently unknown. At day 12 after infection, we performed a standard tetramer dissociation assay to measure TCR affinity (Fig. 8A). Our data show that this parameter does not corre-late with the kinetic patterns. Rather, only ORF75c940-specific cells appear to have a strong affinity for their cognate antigen-MHC complex. To measure functional avidity, we stimulated splenocytes with target cells pulsed with dilutions of peptide in an intracellular cytokine staining assay and measured IFN-␥ accumulation (Fig. 8B). As has been shown previously, it was found that the ORF6487-specific response did not undergo maturation of functional avidity when measurements were made 2 months after infection (5). Interestingly, the other
pattern 2 response we measured, that of ORF75c940, also
maintained its level of functional avidity. Alternatively, the two pattern 1 responses tested both showed a shift of functional avidity over time toward higher avidity. Thus, it appears that functional avidity maturation may be a correlate of prolonged persistence in the overall antiviral T-cell pool.
Role for antigen in maintaining T-cell responses.The mat-uration of functional avidity of pattern 1 cells over the first 2 months of infection, along with their slower decline and higher rates of proliferation, suggests that these cells may be contin-ually stimulated by persistent virus during the latency amplifi-cation phase. To test whether pattern 1 responses require sustained virus during latency amplification for their persis-tence we utilized a recently developed latency-null
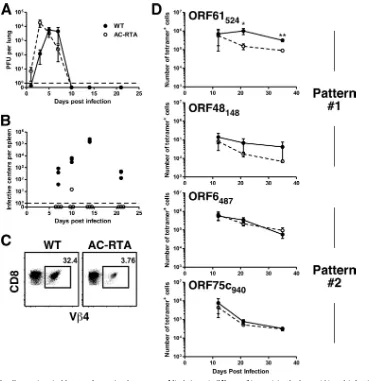
recombi-nant␥HV68, termed AC-RTA (18a). Intranasal infection of
[image:7.585.135.450.67.199.2]mice with AC-RTA resulted in transient virus replication in
FIG. 6. The two patterns exhibit differential proliferation rates. At various times after infection, mice were treated with BrdU in their drinking water for 4 consecutive days. At the end of treatment, spleens were harvested and stained with a tetramer and antibodies to CD8 and CD44. CD8 T cells were measured for BrdU incorporation. (A) Representative histograms show incorporation by CD44loCD8 T cells and CD44hiCD8 T cells.
(B) The percentages of tetramer⫹cells that incorporated BrdU are shown (n⫽5 to 10/group).
on November 8, 2019 by guest
http://jvi.asm.org/
the lung that was cleared with kinetics similar to that of wild-type␥HV68 (Fig. 9A). Unlike wild-type virus, however, AC-RTA does not readily reach the spleen to establish a latent infection and thus did not go through latency amplification (Fig. 9B) or induce splenomegaly (data not shown). In addi-tion, there was no expansion of CD8 T cells expressing V4 TCR after AC-RTA infection (Fig. 9C), consistent with a fail-ure of AC-RTA to establish latency in C57BL/6 mice. We then examined how the lack of viral latency affects the kinetics of decline of virus-specific CD8 T-cell numbers (Fig. 9D). There was no difference in T-cell numbers of the pattern 2 responses in the presence or absence of latency. However, both pattern 1 responses showed a trend toward lower T-cell numbers 21 and 35 days after AC-RTA infection, and these reductions were statistically significant for the ORF61524-specific response. These data are consistent with pattern 1 cells requiring antigen expression during latency amplification for their prolonged proliferation and survival.
DISCUSSION
The generation and maintenance of functional antiviral CD8 T cells are important for control of acute␥HV68 infection and prevention of reactivation from latency (8, 37). Infection by the gammaherpesviruses involves at least three stages—acute lytic infection, latency establishment and amplification, and stable long-term latency—but how the cellular immune system re-sponds to different viral epitopes during each stage of infection is poorly understood. Previous studies have shown that the kinetics of the CD8 T-cell responses to two immunodominant epitopes, ORF6487/Dband ORF61
524/K
b, followed the
expres-sion of the two epitopes: ORF6487 is expressed exclusively during the acute phase and ORF61524is expressed during the
[image:8.585.75.502.70.457.2]acute and early latent phases (22, 28, 33). However, it is un-known if these two patterns are representative of the overall response. We also do not know if some CD8 T-cell responses inflate during the latent phase (26) or if prolonged exposure to
FIG. 7. Prolonged activation of ORF61524-specific responses. At various times after infection spleens were harvested and stained with a
tetramer and the indicated antibodies. Representative zebra plots show staining of tetramer⫹CD8 T cells with CD27 and CD43 (A) or CD127 and KLRG-1 (C). Numbers in plots show the percentages of tetramer⫹cells in each quadrant. Plots are representative of at least 3 experiments. The percentages of tetramer⫹cells that are CD27hiCD43hi(B), CD127hi(D), or KLRG1hi(E) are shown.
on November 8, 2019 by guest
http://jvi.asm.org/
antigen during long-term latency drives some responses to functional exhaustion (2). To address these questions, we have
identified a large number of new ␥HV68 epitopes and have
examined the early and late CD8 T-cell responses to these and previously identified epitopes. We failed to find evidence for inflation or functional exhaustion. Rather, our analysis re-vealed that the T-cell numbers of all responses declined over time, with two distinct patterns defined by delayed (pattern 1) or rapid (pattern 2) decline. Interestingly these patterns cor-responded precisely to the previously defined kinetics of the CD8 T-cell responses to ORF6487and ORF61524, suggesting that we have identified a common feature of the early CD8 T-cell response to infection.
Differential antigen availability during distinct phases of in-fection has been shown to influence the kinetics of expression of epitope-specific T cells. Although the lytic and latent phases of infection are established concurrently, the lytic infection of epithelial cells is cleared rapidly, resulting in the elimination of antigens expressed exclusively during the acute phase. For example, it has been shown that the ORF6487epitope is pre-sented transiently by epithelial cells during the acute phase of infection in the lung and is not presented by spleen cells, and ORF6487-specific cells decline steeply after clearance of the lytic infection. On the other hand, latency is established in macrophages, dendritic cells, and B cells, all of which can serve as potent antigen-presenting cells (APCs) (11, 22). Latently
infected cells undergo an amplification phase in the spleen before being controlled by cellular immunity, leading to the prolonged presence of antigens that are expressed during la-tency amplification (12, 27, 39). The ORF61524epitope is pre-sented both during the acute phase in the lung and in the spleen during latency amplification. Consistent with this pat-tern of epitope expression, ORF61524-specific CD8 T cells are sustained throughout latency amplification (22, 28). In the current study we have identified 4 epitopes that elicit T cells with a rapid decline and 9 epitopes that drive T cells with a slow kinetic decline. Consistent with a role for antigen, those cells with sustained responses underwent sustained prolifera-tion and exhibited funcprolifera-tional avidity maturaprolifera-tion between 12 and 60 days p.i. In contrast, cells that declined more rapidly did not show sustained proliferation and did not undergo func-tional avidity maturation. To directly test the role of sustained antigen presence in driving pattern 1 T-cell kinetics, we ana-lyzed the T-cell response following infection with either wild-type virus or a mutant virus, AC-RTA, which fails to establish a latent infection (18a). Importantly, CD8 T-cell responses to epitopes that elicited pattern 1 kinetics in mice infected with WT virus exhibited pattern 2 kinetics in mice infected with the latency-null virus. These data strongly support the idea that antigen expression during the establishment and amplification of latency is an important factor in driving pattern 1 T-cell response kinetics.
FIG. 8. Functional avidity maturation occurs for pattern 1 responses. (A) TCR affinity was measured by staining cells with a tetramer for 1 h followed by incubation with anti-H-2Kb/Dbantibody at 37°C to observe tetramer dissociation. Cells were then stained with anti-CD8 and analyzed
by flow cytometry. Data represent the percentages of tetramer⫹CD8 T cells expressed as percentages (⫾SD) of maximum binding at time zero (left column) or as raw data showing the percentages (⫾SD) of CD8 T cells (right column). (B) Functional avidity was measured by stimulating cells for 5 h in the presence of the designated concentration of antigen and brefeldin-A and then staining for intracellular accumulation of IFN-␥. For each time point, data represent the percentages of cells positive for IFN-␥expressed as percentages (⫾SD) of the 10-g/ml value (left column) or as raw data showing the percentages (⫾SD) of CD8 T cells (right column) (n⫽2 or 3/concentration).
on November 8, 2019 by guest
http://jvi.asm.org/
It is unclear how epitope expression is differentially regu-lated during infection, but interestingly, in two separate cases two epitopes from the same protein drove T-cell responses in different kinetic classes. Thus, ORF75c176drove pattern 1 re-sponses whereas ORF75c940drove pattern 2 responses. Simi-larly, ORF39209drove pattern 1 responses whereas ORF39167 drove pattern 2 responses. These data suggest that epitope-specific response patterns are not directly linked to the kinetics of viral protein expression during infection. Rather, the expres-sion of these epitopes is likely controlled by differences in antigen processing, presentation, or infected cell type during the lytic or latency amplification stage of infection in the lung, mesenteric lymph nodes (MLN), or spleen. This is currently being examined.
Importantly, although we did not directly examine the role of sustained antigen in the long-term functionality of epitope-specific responses in the current study, we saw no evidence that
␥HV68-specific CD8 T cells became functionally impaired.
Indeed, both pattern 1 and pattern 2 responses maintained
their abilities to synthesize cytokines and release lytic granules ex vivo and lyse peptide-loaded target cellsin vivo (Fig. 4). These results suggest that, although prolonged antigen stimu-lation during latency amplification is sufficient to affect T-cell response kinetics, levels of antigen expression during long-term latency are apparently insufficient to drive CD8 T cells to exhaustion. Whether long-term latency is required for the pro-longed maintenance of the number of virus-specific CD8 T cells over time is currently under investigation.
Here we carried out a genome-wide screen and used ELIS-pot assays to identify 33␥HV68-specific CD8 T-cell epitopes, confirming 14 previously published epitopes and identifying 21 new epitopes. It is instructive to compare the results of our epitope screen with those of another screen recently reported (14). Consistent with the previous screen, the epitopes we identified came predominantly from early and late genes (24), with a bias toward H-2Kb restriction. However, our screen
[image:10.585.109.478.66.447.2]identified 21 additional epitopes, encompassing a broader range of MHC binding affinities. One possible explanation for
FIG. 9. Pattern 1 cells require viral latency for optimal responses. Viral titers (⫾SD;n⫽3/group) in the lungs (A) and infective centers in the spleen (B) following wild-type (WT)␥HV68 infection or AC-RTA infection. (C) Forty-one days after infection spleens were harvested and stained with antibodies to CD8 and TCR V4. Numbers indicate percentages of CD8 T cells expressing V4 (n⫽3/group). (D) Number (⫾SD) of tetramer⫹CD8 T cells over time (n⫽3 to 6/group; data representative of 3 experiments).*,P⬍0.05;**,P⬍0.01 (Student’sttest).
on November 8, 2019 by guest
http://jvi.asm.org/
why our screen identified so many new epitopes is the breadth of the peptide library we used: unlike previous screens, our
screen included H-2Db-restricted 9-mers and 10-mers and
H-2Kb-restricted 8-mers and 9-mers, totaling 1,383 peptides.
Thus, of the 21 new responses we detected, 10 epitopes (4 Db-restricted 10-mers and 6 Kb-restricted 9-mers) had not
been tested in other assays (14, 22, 33). A second reason is that our screen may be more sensitive than the caged MHC-I tet-ramer approach (14), in that we identified peptides with sig-nificantly lower affinity for binding to MHC-I (Fig. 2).
Taken together, the results of the current analysis of a large number of␥HV68-specific CD8 T-cell responses show that the virus-specific CD8 T-cell numbers can be categorized into two general kinetic classes, those that decline slowly (pattern 1) and those that decline rapidly (pattern 2). The slow decliners show sustained rates of proliferation and undergo functional avidity maturation, and their slow rate of decline is dependent on continued antigen expression during latency amplification. These data advance our understanding of the complexities of CD8 T-cell immune control of this latent gammaherpesvirus, which is essential for the development of effective vaccines and therapeutics.
ACKNOWLEDGMENTS
We thank Scottie Adams for help with tetramer generation, Claire Burkum for excellent technical assistance, and Jacob Kohlmeier for critically reading the manuscript.
This project was funded by NIH grants AI42927 and CA148250 (to M.A.B.); T32 AI49823 (to D.L.W.); F32 AI084327 (to M.L.F.); DE18337 (to T.-T.W.); and CA91791, DE14153, and DE15752 (to R.S.). Funding was also provided by NIH contracts N01-AI400023C and N01-AI400024C (to A.S.), the Stop Cancer Foundation (to R.S.), and the Trudeau Institute.
REFERENCES
1.Alter, G., J. M. Malenfant, and M. Altfeld.2004. CD107a as a functional marker for the identification of natural killer cell activity. J. Immunol.
Meth-ods294:15–22.
2.Blattman, J. N., E. J. Wherry, S. J. Ha, R. G. van der Most, and R. Ahmed.
2009. Impact of epitope escape on PD-1 expression and CD8 T-cell
exhaus-tion during chronic infecexhaus-tion. J. Virol.83:4386–4394.
3.Cheng, Y., and W. H. Prusoff.1973. Relationship between the inhibition constant (K1) and the concentration of inhibitor which causes 50 per cent
inhibition (I50) of an enzymatic reaction. Biochem. Pharmacol.22:3099–
3108.
4.Coppola, M. A., E. Flano, P. Nguyen, C. L. Hardy, R. D. Cardin, N. Shastri, D. L. Woodland, and M. A. Blackman.1999. Apparent MHC-independent
stimulation of CD8⫹T cells in vivo during latent murine gammaherpesvirus
infection. J. Immunol.163:1481–1489.
5.Cush, S. S., K. M. Anderson, D. H. Ravneberg, J. L. Weslow-Schmidt, and E. Flano.2007. Memory generation and maintenance of CD8⫹T cell function
during viral persistence. J. Immunol.179:141–153.
6.Cush, S. S., and E. Flano.2009. Protective antigen-independent CD8 T cell memory is maintained during {gamma}-herpesvirus persistence. J. Immunol.
182:3995–4004.
7.Darrah, P. A., D. T. Patel, P. M. De Luca, R. W. Lindsay, D. F. Davey, B. J. Flynn, S. T. Hoff, P. Andersen, S. G. Reed, S. L. Morris, M. Roederer, and R. A. Seder.2007. Multifunctional TH1 cells define a correlate of
vaccine-mediated protection against Leishmania major. Nat. Med.13:843–850.
8.Ehtisham, S., N. P. Sunil-Chandra, and A. A. Nash.1993. Pathogenesis of murine gammaherpesvirus infection in mice deficient in CD4 and CD8 T
cells. J. Virol.67:5247–5252.
9.Evans, A. G., J. M. Moser, L. T. Krug, V. Pozharskaya, A. L. Mora, and S. H. Speck.2008. A gammaherpesvirus-secreted activator of Vbeta4⫹CD8⫹T
cells regulates chronic infection and immunopathology. J. Exp. Med.205:
669–684.
10.Flano, E., C. L. Hardy, I. J. Kim, C. Frankling, M. A. Coppola, P. Nguyen, D. L. Woodland, and M. A. Blackman.2004. T cell reactivity during infec-tious mononucleosis and persistent gammaherpesvirus infection in mice.
J. Immunol.172:3078–3085.
11.Flano, E., S. M. Husain, J. T. Sample, D. L. Woodland, and M. A. Blackman.
2000. Latent murine gamma-herpesvirus infection is established in activated
B cells, dendritic cells, and macrophages. J. Immunol.165:1074–1081.
12.Flano, E., Q. Jia, J. Moore, D. L. Woodland, R. Sun, and M. A. Blackman.
2005. Early establishment of {gamma}-herpesvirus latency: implications for
immune control. J. Immunol.174:4972–4978.
13.Fuse, S., J. J. Obar, S. Bellfy, E. K. Leung, W. Zhang, and E. J. Usherwood.
2006. CD80 and CD86 control antiviral CD8⫹T-cell function and immune
surveillance of murine gammaherpesvirus 68. J. Virol.80:9159–9170.
14.Gredmark-Russ, S., E. J. Cheung, M. K. Isaacson, H. L. Ploegh, and G. M. Grotenbreg.2008. The CD8 T-cell response against murine gammaherpes-virus 68 is directed toward a broad repertoire of epitopes from both early and
late antigens. J. Virol.82:12205–12212.
15.Gruener, N. H., F. Lechner, M. C. Jung, H. Diepolder, T. Gerlach, G. Lauer, B. Walker, J. Sullivan, R. Phillips, G. R. Pape, and P. Klenerman.2001.
Sustained dysfunction of antiviral CD8⫹T lymphocytes after infection with
hepatitis C virus. J. Virol.75:5550–5558.
16.Gulukota, K., J. Sidney, A. Sette, and C. DeLisi.1997. Two complementary methods for predicting peptides binding major histocompatibility complex
molecules. J. Mol. Biol.267:1258–1267.
17.Hardy, C. L., E. Flano, R. D. Cardin, I. J. Kim, P. Nguyen, S. King, D. L. Woodland, and M. A. Blackman.2001. Factors controlling levels of CD8⫹
T-cell lymphocytosis associated with murine gamma-herpesvirus infection.
Viral Immunol.14:391–402.
18.Hikono, H., J. E. Kohlmeier, S. Takamura, S. T. Wittmer, A. D. Roberts, and D. L. Woodland.2007. Activation phenotype, rather than central- or
effec-tor-memory phenotype, predicts the recall efficacy of memory CD8⫹T cells.
J. Exp. Med.204:1625–1636.
18a.Jia, Q., M. L. Freeman, E. J. Yager, I. McHardy, L. Tong, D. Martinez-Guzman, T. Rickabaugh, S. Hwang, M. A. Blackman, R. Sun, and T.-T. Wu.
2010. Induction of protective immunity against murine gammaherpesvirus 68
infection in the absence of viral latency. J. Virol.84:2453–2465.
19.Kaech, S. M., J. T. Tan, E. J. Wherry, B. T. Konieczny, C. D. Surh, and R. Ahmed.2003. Selective expression of the interleukin 7 receptor identifies effector CD8 T cells that give rise to long-lived memory cells. Nat. Immunol.
4:1191–1198.
20.Karrer, U., S. Sierro, M. Wagner, A. Oxenius, H. Hengel, U. H. Koszinowski, R. E. Phillips, and P. Klenerman.2003. Memory inflation: continuous
ac-cumulation of antiviral CD8⫹T cells over time. J. Immunol.170:2022–2029.
21.Kotturi, M. F., B. Peters, F. Buendia-Laysa, Jr., J. Sidney, C. Oseroff, J. Botten, H. Grey, M. J. Buchmeier, and A. Sette.2007. The CD8⫹T-cell response to lymphocytic choriomeningitis virus involves the L antigen:
un-covering new tricks for an old virus. J. Virol.81:4928–4940.
22.Liu, L., E. Flano, E. J. Usherwood, S. Surman, M. A. Blackman, and D. L. Woodland.1999. Lytic cycle T cell epitopes are expressed in two distinct
phases during MHV-68 infection. J. Immunol.163:868–874.
23.Liu, L., E. J. Usherwood, M. A. Blackman, and D. L. Woodland.1999. T-cell vaccination alters the course of murine herpesvirus 68 infection and the
establishment of viral latency in mice. J. Virol.73:9849–9857.
24.Martinez-Guzman, D., T. Rickabaugh, T. T. Wu, H. Brown, S. Cole, M. J. Song, L. Tong, and R. Sun.2003. Transcription program of murine
gamma-herpesvirus 68. J. Virol.77:10488–10503.
25.Moutaftsi, M., B. Peters, V. Pasquetto, D. C. Tscharke, J. Sidney, H. H. Bui, H. Grey, and A. Sette.2006. A consensus epitope prediction approach
iden-tifies the breadth of murine T(CD8⫹)-cell responses to vaccinia virus. Nat.
Biotechnol.24:817–819.
26.Munks, M. W., K. S. Cho, A. K. Pinto, S. Sierro, P. Klenerman, and A. B. Hill.2006. Four distinct patterns of memory CD8 T cell responses to chronic
murine cytomegalovirus infection. J. Immunol.177:450–458.
27.Nash, A. A., B. M. Dutia, J. P. Stewart, and A. J. Davison.2001. Natural history of murine gammaherpesvirus infection. Philos. Trans. R. Soc. Lond.
B. Biol. Sci.356:569–579.
28.Obar, J. J., S. Fuse, E. K. Leung, S. C. Bellfy, and E. J. Usherwood.2006. Gammaherpesvirus persistence alters key CD8 T-cell memory characteristics
and enhances antiviral protection. J. Virol.80:8303–8315.
29.Sarkar, S., V. Kalia, W. N. Haining, B. T. Konieczny, S. Subramaniam, and R. Ahmed.2008. Functional and genomic profiling of effector CD8 T cell
subsets with distinct memory fates. J. Exp. Med.205:625–640.
30.Shankar, P., M. Russo, B. Harnisch, M. Patterson, P. Skolnik, and J. Lieberman.2000. Impaired function of circulating HIV-specific CD8(⫹) T
cells in chronic human immunodeficiency virus infection. Blood96:3094–
3101.
31.Sidney, J., S. Southwood, C. Oseroff, M. F. del Guercio, A. Sette, and H. M. Grey. 2001. Measurement of MHC/peptide interactions by gel filtration. Curr. Protoc. Immunol., chapter 18, unit 18.3.
32.Snyder, C. M., K. S. Cho, E. L. Bonnett, S. van Dommelen, G. R. Shellam, and A. B. Hill.2008. Memory inflation during chronic viral infection is maintained by continuous production of short-lived, functional T cells.
Im-munity29:650–659.
33.Stevenson, P. G., G. T. Belz, J. D. Altman, and P. C. Doherty.1999. Changing
patterns of dominance in the CD8⫹T cell response during acute and persistent
murine gamma-herpesvirus infection. Eur. J. Immunol.29:1059–1067.
34.Stevenson, P. G., G. T. Belz, J. D. Altman, and P. C. Doherty.1998. Virus-specific
on November 8, 2019 by guest
http://jvi.asm.org/
CD8(⫹) T cell numbers are maintained during gamma-herpesvirus reactivation
in CD4-deficient mice. Proc. Natl. Acad. Sci. U. S. A.95:15565–15570.
35.Stevenson, P. G., and P. C. Doherty.1998. Kinetic analysis of the specific
host response to a murine gammaherpesvirus. J. Virol.72:943–949.
36.Stevenson, P. G., S. Efstathiou, P. C. Doherty, and P. J. Lehner.2000. Inhibition of MHC class I-restricted antigen presentation by gamma
2-her-pesviruses. Proc. Natl. Acad. Sci. U. S. A.97:8455–8460.
37.Stewart, J. P., E. J. Usherwood, A. Ross, H. Dyson, and T. Nash.1998. Lung epithelial cells are a major site of murine gammaherpesvirus persistence. J.
Exp. Med.187:1941–1951.
38.Thimme, R., V. Appay, M. Koschella, E. Panther, E. Roth, A. D. Hislop, A. B. Rickinson, S. L. Rowland-Jones, H. E. Blum, and H. Pircher.2005.
In-creased expression of the NK cell receptor KLRG1 by virus-specific CD8 T
cells during persistent antigen stimulation. J. Virol.79:12112–12116.
39.Usherwood, E. J., D. J. Roy, K. Ward, S. L. Surman, B. M. Dutia, M. A. Blackman, J. P. Stewart, and D. L. Woodland.2000. Control of gammaherpesvirus latency by
latent antigen-specific CD8(⫹) T cells. J. Exp. Med.192:943–952.
40.Voehringer, D., C. Blaser, P. Brawand, D. H. Raulet, T. Hanke, and H. Pircher.2001. Viral infections induce abundant numbers of senescent CD8
T cells. J. Immunol.167:4838–4843.
41.Wherry, E. J., J. N. Blattman, K. Murali-Krishna, R. van der Most, and R. Ahmed.2003. Viral persistence alters CD8 T-cell immunodominance and tissue distribution and results in distinct stages of functional impairment.
J. Virol.77:4911–4927.