This is a repository copy of
Biodiversity and ecosystem function in soil
.
White Rose Research Online URL for this paper:
http://eprints.whiterose.ac.uk/571/
Article:
Fitter, A H, Gilligan, C A, Hollingworth, K et al. (3 more authors) (2005) Biodiversity and
ecosystem function in soil. Functional Ecology. pp. 369-377. ISSN 0269-8463
https://doi.org/10.1111/j.1365-2435.2005.00969.x
[email protected]
https://eprints.whiterose.ac.uk/
Reuse
Items deposited in White Rose Research Online are protected by copyright, with all rights reserved unless
indicated otherwise. They may be downloaded and/or printed for private study, or other acts as permitted by
national copyright laws. The publisher or other rights holders may allow further reproduction and re-use of
the full text version. This is indicated by the licence information on the White Rose Research Online record
for the item.
Takedown
If you consider content in White Rose Research Online to be in breach of UK law, please notify us by
Functional
Ecology 2005
19, 369–377
© 2005 British Ecological Society
369
Blackwell Publishing, Ltd. Oxford, UK FEC Functional Ecology 0269-8463 British Ecological Society, 2005 ? 2005 19 ?Essay Review Biodiversity and ecosystem function in soil A. H. Fitter et al.
ESSAY REVIEW
Biodiversity and ecosystem function in soil
A. H. FITTER,*† C. A. GILLIGAN,‡ K. HOLLINGWORTH,*
A. KLECZKOWSKI,‡ R. M. TWYMAN,* J. W. PITCHFORD* and
THE MEMBERS OF THE NERC SOIL BIODIVERSITY PROGRAMME
*Department of Biology, University of York, York YO10 5YW, and ‡Department of Plant Sciences, University of
Cambridge, Cambridge CB2 3EA, UK
Summary
1.
Soils are one of the last great frontiers for biodiversity research and are home to an
extraordinary range of microbial and animal groups. Biological activities in soils drive
many of the key ecosystem processes that govern the global system, especially in the
cycling of elements such as carbon, nitrogen and phosphorus.
2.
We cannot currently make firm statements about the scale of biodiversity in soils,
or about the roles played by soil organisms in the transformations of organic materials
that underlie those cycles. The recent UK Soil Biodiversity Programme (SBP) has
brought a unique concentration of researchers to bear on a single soil in Scotland, and
has generated a large amount of data concerning biodiversity, carbon flux and
resil-ience in the soil ecosystem.
3.
One of the key discoveries of the SBP was the extreme diversity of small organisms:
researchers in the programme identified over 100 species of bacteria, 350 protozoa, 140
nematodes and 24 distinct types of arbuscular mycorrhizal fungi. Statistical analysis of
these results suggests a much greater ‘hidden diversity’. In contrast, there was no unusual
richness in other organisms, such as higher fungi, mites, collembola and annelids.
4.
Stable-isotope (
13C) technology was used to measure carbon fluxes and map the
path of carbon through the food web. A novel finding was the rapidity with which carbon
moves through the soil biota, revealing an extraordinarily dynamic soil ecosystem.
5.
The combination of taxonomic diversity and rapid carbon flux makes the soil
ecosystem highly resistant to perturbation through either changing soil structure or
removing selected groups of organisms.
Key-words: bacteria, 13C, carbon flux, fungi, models, resilience, soil fauna, Sourhope
Functional Ecology (2005) 19, 369–377 doi: 10.1111/j.1365-2435.2005.00969.x
Introduction
Establishing the linkage between ecosystem function and ecosystem biodiversity is a substantial scientific challenge. Nowhere is this challenge greater than in soils. Fundamental processes within the carbon and nitrogen cycles occur in soils. The precise role of many soil organisms in these cycles is unknown, although the great diversity and abundance of microbial, plant and animal life in soil seems likely to influence ecosystem function in various ways. There have been several reports of remarkable microbial diversity (Torsvik, Goksoyr & Daae 1990; Tiedje et al. 1999; Torsvik, Ovreas & Thingstad 2002). Although no-one has ever counted
all the microbial species in a natural soil, estimates sug-gest anything up to 104 bacterial species per g soil, of
which at least half (and perhaps as many as 95%) are as yet unculturable (Sait, Hugenholtz & Janssen 2002; Joseph et al. 2003). An understanding of the linkages between soil biodiversity and the processes of C and N cycling is essential given the potential impact of both natural events and human activity on soil communi-ties, but experiments are rarely performed in a context where their significance to ecosystem-level processes can be reliably inferred.
This review reports key ecological findings from a major research programme, Soil Biodiversity and Ecosystem Function (aka the Soil Biodiversity Programme or SBP), funded by the UK Natural Environment Research Council. The SBP had the specific aim of combining both traditional and molecular approaches to the
370
A. H. Fitter et al.
© 2005 British Ecological Society,
Functional Ecology,
19, 369–377
analysis of diversity (Box 1) with novel experimental investigations of the C cycling activities of different types of soil organism. The SBP ran from 1997 to 2004; its unique feature was that £5·85 million of research funds were all expended on a single site, a rather dull hectare of grassland at Sourhope (Box 2) in the Scottish Borders. Choosing a single site for 27 distinct but related research projects allowed an unprecedented insight into the workings of a soil ecosystem. Choosing a biologically unexceptional site which does not display especially great richness in plant diversity means that explanations for diversity in the soil cannot fall back on the argument that the below-ground community is driven by that above ground.
By undertaking all the experimental activity on one site, a single experimental design could be used and the results from many related projects integrated into one model. The scope for collaboration and cross-fertilization between separate projects was also improved using this strategy. The Sourhope site is part of the UK Environ-mental Change Network, and is also the most thoroughly studied site in the MicroNet programme funded by the Scottish Executive. The site studies were complemented
by laboratory-scale investigations using the Ecotron facility at the Centre for Population Biology, Imperial College, London, in which a simplified grassland eco-system was recreated with defined faunal communities differentiated on body size.
To achieve the SBP’s objective, the ecosystem at Sourhope was perturbed by removing taxa using a biocide or by artificially manipulating their population numbers, and by subjecting plots to various treatments representative of anthropogenic inputs and designed to affect biodiversity. Thirty plots, each 12 × 20 m, were laid out and five treatments applied: a factorial of limestone and N addition, with an extra control and a biocide treatment. These treatments were intended to alter both diversity and function and allow investigators to look for correlated changes. Then the research teams were let loose: between them they studied a remarkable range of taxa, processes and treatments (Box 2).
The SBP did not aim to compile an all-taxa biodiversity inventory (e.g. www.dlia.org/atbi/index.html) – that would have been a massive task, and probably un-achievable at a time when systematic concepts for many soil organisms remain so fluid.
Box 1. Novel technologies to probe soil biodiversity and function
The biggest hurdle encountered by researchers in soil biodiversity is that most of the organisms are not identifiable by conventional morphological taxonomy. Prokaryotes and many fungi (especially the symbiotic fungi that form arbuscular mycorrhizas with plant roots) are largely unculturable, and so could be identified morphologically only from structures that can be recovered from field samples. Typically these are inadequate for any useful taxonomy. Even where organisms are large enough to be extracted intact from soil, as is true of most animals, morphology may be a poor guide to genetic differentiation. Molecular techniques are therefore essential.
Estimating the diversity of microbial taxa in a sample can be achieved by extracting the DNA, cutting it with one or more restriction enzymes and separating out the fragments on an electrophoresis gel. A range of such techniques was used in the SBP, such as denaturing gradient gel electrophoresis (Kowalchuk, Gerards & Woldendorp 1997) and terminal restriction fragment-length polymorphism (Liu et al. 1997).
Identifying the taxa relies ultimately on sequencing DNA after amplifying it using PCR. Selecting an appropriate gene for sequencing is critical: it must be sufficiently conserved to be consistent within a species, but offer enough variation to be a useful discriminator among species. Often ribosomal genes are used. However, most sequences that are discovered within environmental samples come from unknown organisms, so ‘identification’ often means no more than giving a sequence a unique identifier and making some statement about its phylogenetic relationships.
Identifying the organisms is only half the story: we also need to know which ones are acquiring and metabolizing soil resources. The stable-isotope technology we used relies on distinguishing the heavy 13C atoms from background 12C using
mass spectrometry. Bulk samples or individual organisms or parts of them can be analysed to reveal the pathway of C movement. At Sourhope this approach was facilitated by the development of a mobile laboratory, designed by Professor Phil Ineson (University of York), that can control the supply of an air stream containing pure 13CO
2 at ambient
concentration along 18 gas lines simultaneously, enabling different patches of vegetation to fix the 13C pulse: 99·9 at % 13C-labelled CO
2 was provided to vegetation at ambient concentrations (355 µmol mol−1; Ostle et al. 2000).
The novel 13C techniques developed in the SBP involved measuring the 13C content of specific molecules. Stable-isotope
probing builds on the classic Meselson & Stahl (1958) experiment, and relies on separating the DNA (or RNA) from a sample along a density gradient and then amplifying the separated bands to identify the organisms that have become labelled (Radajewski et al. 2000). It is a powerful technique for measuring the activity of unculturable microbes. By starting with RNA, and including a reverse transcription step, an even more precise focus on metabolic activity can be achieved, as RNA is much more labile than DNA (Ostle et al. 2003). If the organisms are larger and can be separated from soil visually, then there is no need for stable-isotope probing, and compound-specific infrared mass spectrometry can be used to measure the 13C content of specific compounds (so avoiding the danger that, for example, gut contents
371
Biodiversity and ecosystem function in soil
© 2005 British Ecological Society,
Functional Ecology,
19, 369–377
Box 2. The Sourhope experiment
The field site at Sourhope (grid reference NT855197), an experimental farm managed by the Macaulay Land Use Research Institute, Aberdeen, UK, was ≈1 ha of semi-improved grassland 320 m above sea level (see www.soilbio.nerc.ac.uk). The main plant species were common grasses of upland Britain such as Agrostis capillaris, Festuca rubra and Poa pratensis; dicots were relatively scarce. At the start of the experiment the site was fenced and sheep grazing was replaced by regular mowing. Although this change of management indubitably affected the vegetation and hence the soil communities, it was an essential logistical step: many of the experiments would have been impossible had sheep roamed freely across the site. The experimental design comprised 30 plots, each 12 × 20 m, and each subdivided into 10 subplots, four of which (5 × 5 m) were used as nested plots within each main plot; the other six (3 × 3 m) were for special treatments (see figure). The main plots received one of five treatments:
1,2 two controls
3 limestone added at 600 g m−2 annually in spring 4 nitrogen added at 12 g m−2 twice a year
5 both limestone and N
6 biocide (Dursban), added at 0·15 ml m−2 five times a year.
Each subplot was divided into 0·25 m2 grid squares, and all sampling activity was recorded to that resolution so that a complete record of all
the programme activities is available in space and time. The experiment is being maintained for at least another 3 years, and other experimenters are welcome to make use of what is now one of the best known plots of soil in the world.
Box 2 Fig. 1. Design of the Sourhope field experiment. There were five treatments (the controls were duplicated) and five blocks. The major
372
A. H. Fitter et al.
© 2005 British Ecological Society,
Functional Ecology,
19, 369–377
Diversity of small things is very great
Bacterial diversity had already been determined by the research group of Professor Jim Prosser (University of Aberdeen), at a site a few hundred metres away from that used in the SBP. They identified around 100 spe-cies, but statistical estimation of diversity from these data suggests that there may be between 500 and 5000 species of bacteria at Sourhope (McCaig, Glover & Prosser 2001; Curtis, Sloan & Scannell 2002), perhaps unsurprisingly if other estimates that soils harbour 103–104 bacterial species g−1 are correct (Torsvik et al.
2002). Importantly, the SBP has shown that this rich-ness is mirrored at Sourhope in other taxa. The team led by Dr Bland Finlay (Centre for Ecology and Hydrology) recorded 365 species of protozoa, representing one-third of the global total of non-marine species (Finlay & Fenchel 2001). That proportion is high, but similar values for protozoa have been recorded previously at other sites (Finlay et al. 2001). However, those iden-tifications were morphological, raising the question of whether each morphospecies comprises several genet-ically distinct groups. The latter explanation may well apply to nematodes: the group led by Dr Mark Blaxter’s group (University of Edinburgh) examined 3500 individual nematodes and found that they represented
≈140 species defined using molecular, not morpholo-gical, criteria (Floyd et al. 2002). Where it was possible to compare the two approaches there was a good match, except that morphology, as expected, often failed to reveal the presence of genetically distinct taxa. Using a collector’s curve approach, the estimate is that the Sourhope hectare is home to over 400 species of nema-tode. Those data compare with the richest site previ-ously studied in the UK – Porton Down, a biologically diverse chalk grassland, with 125 nematode species; and to the richest site previously studied in the world
– Mbalmayo forest, Cameroon, with 431 morphospe-cies (Bloemers et al. 1997).
A similar result, on a different scale, was found for the symbiotic fungi in the phylum Glomeromycota that form arbuscular mycorrhizas (AM). Only 150 – 200 morphospecies of these fungi have been described worldwide (Morton, Bentivenga & Bever 1995), yet the group led by Professor Peter Young (University of York) found 17 distinct molecular types in a few roots of a single plant species (white clover, Trifolium repens), and 24 when the grass Agrostis capillaris was also sampled (Vandenkoornhuyse et al. 2002). There were quite distinct communities of AM fungi in roots of these two species and of a second grass species, Poa pratensis
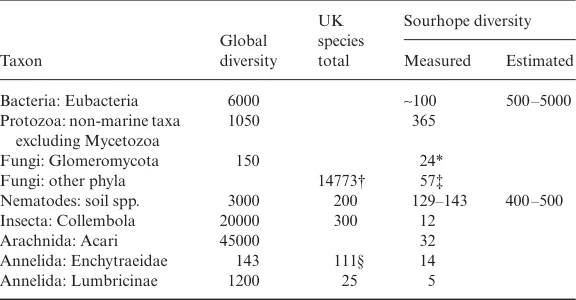
(Vandenkoornhuyse et al. 2003). Even allowing for our uncertainty as to the relationship between sequence diversity and species diversity in this phylum (Pawlowska & Taylor 2004), it is pertinent to ask whether 10% of all AM fungal species can occur on a few roots of a single plant species at Sourhope; alternatively, is the diversity of these key symbionts much greater than we have allowed? In contrast to the Glomeromycota, the diversity of saprotrophic fungi (mainly Ascomycota and Basidio-mycota) at Sourhope appeared low, with only 57 taxa (counted as genera) isolated from litter soil and basidiomes (C. H. Robinson and E. J. Pryce Miller, unpublished data). However, cryptic species may have been missed. In contrast to the high diversity of these small organisms, there was no unusual richness in the larger soil species. Just 44 species of mites and collembola and 19 annelids (five earthworms and 14 enchytraeids) were discovered. Their low diversity does not make them ecologically unimportant: Professor Donald Davidson’s group (University of Stirling) showed that 90% of the soil organic matter at Sourhope has been processed by annelids, and the upper horizons of the soil at Sourhope are largely composed of annelid excre-ment (Davidson et al. 2002). The disproportionately high diversity of small – but not the larger – organisms (Table 1) is unexplained and represents a new ecological challenge: it is likely that it reflects great unidentified global diversity in these small-organism taxa. This pattern could be related to the extreme heterogeneity of soils on all spatial scales, and the limited migration ability of most of these species, resulting in systems that are always far from equilibrium. This explanation is supported by data of Zhou et al. (2002), who found that saturated soils had fewer and more evenly distrib-uted bacterial taxa than did well drained soils: in the latter, migration and dispersal through the soil’s water-filled pores would be less effective.
[image:5.595.37.325.519.669.2]A related question is whether the high diversity reflects the global distribution of microbial and other small-organism taxa, as postulated for protozoa (Finlay et al. 2001); in other words, do microbes have biogeography or are microbial species ubiquitous, with local communities selected by environmental prefer-ences from a universal species pool? The latter view has been the dominant one in microbial ecology since
Table 1. Species diversity of some groups of organisms measured at the Sourhope site
compared with UK and global diversity (where known)
Taxon Global diversity UK species total Sourhope diversity Measured Estimated
Bacteria: Eubacteria 6000 ∼100 500 –5000
Protozoa: non-marine taxa excluding Mycetozoa
1050 365
Fungi: Glomeromycota 150 24*
Fungi: other phyla 14773† 57‡
Nematodes: soil spp. 3000 200 129–143 400 –500
Insecta: Collembola 20000 300 12
Arachnida: Acari 45000 32
Annelida: Enchytraeidae 143 111§ 14
Annelida: Lumbricinae 1200 25 5
Data sources for Sourhope as in text; others from Groombridge (1992) except where specified.
*, As phylotypes from two plant species only (Vandenkoornhuyse et al. 2002). †, P.M. Kirk, personal communication.
373
Biodiversity and ecosystem function in soil
© 2005 British Ecological Society,
Functional Ecology,
19, 369–377
Beijerinck (Horner-Devine, Carney & Bohannon 2004; Wall, Paul & Fitter, 2005), but is increasingly challenged. Data on Pseudomonas from locations on four continents (Cho & Tiedje 2000), and from the archaean genus
Sulfolobus from geographically distributed hot springs
(Whittaker, Grogan & Taylor 2003), suggest that there are significant biogeographical patterns to be dis-covered, described and explained for microbes, as does the demonstration of taxon–area relationships for bacterial communities (Horner-Devine et al. 2004b). Parallel studies at other sites will be needed to reveal how general these results are.
Carbon flux is rapid
The SBP used stable-isotope technology (Staddon 2004) to measure the rates and routes of carbon move-ment through the soil food web. By allowing vegeta-tion to photosynthesize in an atmosphere of 13CO
2 for
a day, the appearance of that label could be traced in successive recipients within the food web: first to AM fungi, rhizosphere bacteria and root-feeding animals, then to predators of these, and ultimately to higher-level predators. A novel feature was the use of a mobile laboratory to ensure very high enrichment with the stable isotope 13C, allowing the label to be applied at
ambient CO2 concentration: if excessive CO2
concen-trations had been used, for example by releasing CO2
from carbonate within a sealed chamber, that would have altered C allocation between shoot and root (Suter et al. 2002) and biased the results.
The most striking finding from these experiments was the speed with which C moves into the soil biota. Laser ablation spectroscopy revealed that only 10% of the roots received 13C after the pulse (Bruneau et al.
2002). This presumably reflected either high rates of root turnover, the presence of many dead or moribund roots, or possibly non-uniform transport of 13C from
labelled shoots to roots. In any case, over 70% of the labelled C was released from the plants as either respired CO2 or exudates within 48 h (Ostle et al. 2000).
Fur-thermore, a strong signal was observed in AM fungi within an hour of the end of the short pulse (Fig. 1; Johnson et al. 2002), and liming the soil increased the rate of transfer of 13C to soil organisms (Staddon et al.
2003a). About 5 – 8% of the 13C fixed by plants during
the pulse went to mycorrhizal fungi and ≈2% to the bacteria (Ostle et al. 2003). There have been numerous attempts to quantify these transfers in laboratory conditions: the SBP data are the first to be obtained in the field, and demonstrate the importance of this fast pathway for C transfer in the cycle.
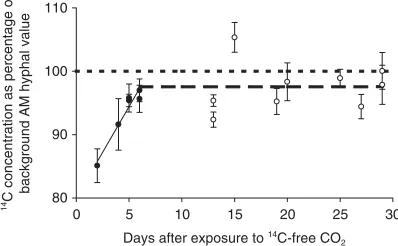
One major uncertainty is how long C stays in par-ticular soil pools. Accelerator mass spectrometry (AMS) and natural 14C tracing was applied in a novel manner
to obtain the first measurements of C residence time in AM fungal hyphae (Staddon et al. 2003b). A pulse of CO2 from a fossil source was used, which therefore
contained no 14C, and this created a recognizable signal
[image:6.595.355.556.32.173.2]in the fungal tissue. The rate at which the signal returned to background was then measured, as newly fixed C from atmospheric CO2 was transferred to the fungi
(Fig. 2). The extraordinary sensitivity of AMS means that these minute differences could be detected in sam-ples of <100 µg hypha, and showed that the C turnover time was ≈5 days. This rapid turnover appears to be even faster than for bacteria: measurements of 13C in
bacterial RNA at Sourhope show a turnover time of about 11 days (Ostle et al. 2003).
These data reveal an exceptionally dynamic ecosystem in soil, and have large implications for the construction of global C cycle models. What remains to emerge from the data is identification of the pathway followed by the bulk of C in the food web. We know that some
[image:6.595.355.554.307.430.2]13C remains in root systems much longer than the
Fig. 1. Recovery of 13C in CO
2 released by respiration from
soil cores in the field at intervals after exposure of plants to
13CO
2. The isotopic signature (δ13C(‰)) of CO2 is much
greater in soil from cores into which mycorrhizal mycelium had been allowed to grow through a fine (20 µm) mesh (solid circles) than where the cores had been rotated (open circles), severing the mycelium and preventing the fungus entering the core. Solid triangles represent data from rotated cores in unlabelled plots (± SE). Points sharing a letter are not significantly different (P > 0·05). From Johnson et al. (2002).
Fig. 2. The 14C concentration of extraradical AM hyphae
recovers to the natural background value within 5 – 6 days after plants are allowed to photosynthesize in an atmosphere of 14C-free CO
2 at ambient concentration (350 µmol mol−1),
which reduces the background 14C concentration in plant and
374
A. H. Fitter et al.
© 2005 British Ecological Society,
Functional Ecology,
19, 369–377
rapidly moving component that goes to AM fungi and rhizosphere bacteria. Ultimately, earthworms and enchytraeids process around 90% of the root-derived C. Initially, this slower pool is picked up by sapro-trophic fungi and root grazers, and from them goes to predators such as fungivorous collembola. Although earthworms typically accounted for >80% of faunal biomass, most (0·1%) of the 13C label in the fauna was
found in mites and collembola, even though they com-prised only 3% of the biomass (P. Ineson, unpublished data). However, this figure is small compared with the
13C in the microbial biomass, which peaked at 8% of
the label fixed by plants. Nevertheless, it appears that whereas earthworms have a large indirect influence on soil biodiversity and C flux, mesofauna have a more important direct effect on C dynamics. 13C labelling
reveals the biological role of individual species. By measuring the δ13C of cholesterol isolated from
indi-vidual enchytraeid worms, these organisms, previously assumed to feed wholly on detritus, were shown to be feeding directly on material in the rhizosphere, and some species to a much greater extent than others (H. Black, unpublished data). These techniques therefore reveal new aspects of the fundamental biology of soil organisms. The next step in understanding the role played by different soil organisms in the C cycle will be achieved using stable-isotope probing (Box 1). In theory, the paths of C to all the genetically distinguishable taxa in soil can be resolved. Several groups within the SBP are applying stable-isotope probing and are developing it to use mRNA rather than DNA (Manefield et al. 2002), as RNA is more labile and so likely to reveal the taxa that are actively metabolizing C in situ.
Does the diversity matter?
What is the impact of altering the structure and diver-sity of such a complex and dynamic ecosystem? This key question was tackled in three ways in the SBP, by:
1. exploring correlated changes in diversity and eco-system processes in the treatments in the field; 2. reconstructing the ecosystem in a progressive manner
in a controlled environment; and 3. modelling the system.
The treatments had the expected substantial impacts. Liming increased soil pH; raised plant productivity; and substantially altered the composition of many groups of soil biota, from bacteria through saprotrophic fungi to enchytraeid worms. However, liming had no detectable effect on the rate of soil respiration, suggest-ing that the system was resistant to perturbation (Gray
et al. 2003). Similar results were obtained by imposing
specific stresses on the system, including drought, heat and the application of sewage sludge (Griffiths et al. 2003). The most explicit test of the system’s resilience came from a major reconstruction experiment. Soil was taken from the site and used to rebuild the community
in the controlled environment of the Ecotron (Bradford
et al. 2002). The distinct soil horizons were restored
and then the biota added back, either as just the microbes (<100 µm diameter); or as the microbes plus the mesofauna (100 µm−2 mm); or both those with
the macrofauna (>2 mm) as well. These very different communities exhibited large differences in parameters such as root growth, AM colonization and decomposi-tion rate (Fig. 3a). The biggest differences were between the macrofauna treatment and the others, suggesting that predators such as beetle larvae feeding on the mesofauna are major controlling agents, even if the predators are neither especially abundant nor diverse in the system. For example, the extraradical mycelium of AM fungi was least well developed in the mesofauna treatment, probably because the fungivores could operate without predator restraint: this result mirrors the find-ing that AM fungal diversity was greater in the field plots that had received insecticide (Vandenkoornhuyse
et al. 2003). Remarkably, however, despite these radical
[image:7.595.342.543.34.307.2]differences in the composition of the soil community, the reconstructed systems showed no differences in overall productivity or ecosystem C exchange rate, even after 9 months (Fig. 3b), suggesting that these systems are
Fig. 3. (a) Effect of faunal treatment on three system
375
Biodiversity and ecosystem function in soil
© 2005 British Ecological Society,
Functional Ecology,
19, 369–377
extremely resilient, and perhaps that significant changes cannot be expected in short-term experiments.
Soil ecosystems are so complex that all experimental approaches to them pose major problems, of either real-ism (as in reconstruction experiments), or precision (as in the perturbations in the field). An alternative is to express the key features of the system in a model. This was achieved by adapting the well known and widely applied Hunt model (Hunt et al. 1987; Berg et al. 2001; Hunt & Wall 2002) to the Sourhope food web. That model is flexible, in that it can handle any number of compartments, and C can flow between them. A version of the model has been implemented that allows the fate of a 13C pulse to be followed in any food web; it can
be downloaded from www-users.york.ac.uk/∼jwp5. Running the model with communities based on data
from the Ecotron experiment reveals 13C dynamics in,
for example, the bacteria and AM fungi: these outputs can be used to generate testable hypotheses for experi-menters to examine (L. Austin, unpublished data).
However, the Hunt et al. model has one feature that is obviously unrealistic: it assumes constant biomass. C flows through the model system because the top predator consumes a quantity of prey in a time interval, and those prey must consume an equal quantity (plus what they lose by respiration) to permit that predation. This effect then cascades through the web. However, soil ecosystems do not exhibit constant biomass in all compartments. Through a series of workshops that brought together soil biologists, mathematicians and modellers, the SBP developed dynamic versions of this static model: incorporation of Lotka–Volterra dynamics Box 3. Static models, dynamic ecosystems
The Hunt et al. (1987) model assumes constant biomass: inputs exactly balance outputs at all times in each compartment. This assumption is restrictive, and this figure illustrates a potential pitfall in its application. Identical models (from the static point of view) with identical parameters can produce radically different signals in pulse dynamics, driven simply by the timing of pulsing relative to the population dynamics.
When pulse data show a consistent pattern in timing and magnitude of peaks, we can infer that either the population dynamics are slow relative to the overall C flux, or the pulse was administered at a sufficiently large spatial scale to average out any local heterogeneities.
Box 3 Fig. 1. Simulated pulses in a Lotka–Volterra predator–prey system. Panels on the left show population dynamics
376
A. H. Fitter et al.
© 2005 British Ecological Society,
Functional Ecology,
19, 369–377
reveals that the size, duration and timing of the peaks in 13C seen in a particular trophic group in the soil
depends on the dynamics of the population (Box 3). This has serious implications for experimenters: in the simplest case of constant populations, the dynamics of a 13C pulse are characterized by a single monotonic
peak in 13C in the target group. In such a case, relatively
few samples would be sufficient to reveal the position and magnitude of the peak. However, the more com-plex signals implied by the dynamic model could not easily be resolved experimentally without an intensive sampling campaign. This is an area requiring careful exploration in planning future field experiments.
Conclusions
The Soil Biodiversity Programme is unique in the scale of the effort that has been expended on understanding a single patch of soil. It represents new thinking by ecologists about the importance of model systems. Microbiologists use Escherichia coli; developmental biologists use Drosophila melanogaster or Arabidopsis
thaliana; ecologists have tended to use their own
spe-cies or system. Consequently, we have always found it hard to synthesize data from different studies. The focus on Sourhope has revealed that there is extensive unexplored diversity across a range of microbial and small eukaryotic taxa, but not especially of large organisms. This diversity exists in a system deliberately chosen for its apparent biological dullness: it would be less surprising to find it in a known diversity hotspot, and what awaits us in soils in such places remains to be seen (Husband et al. 2002). Ecosystem processes in the Sourhope soil are also exceptionally dynamic, as shown by measurements of C flux. Again, the single-site focus enables us to compare fluxes across functional groups: the early steps in the C cycle appear to be much more rapid than we anticipated, and root-associated microbes (AM fungi and bacteria) play a key role in them. Later steps are, as we expected, much slower, and the bio-logical roles of some soil taxa in them are beginning to reveal big surprises. However, one consequence of taxonomic richness appears to be substantial resilience in the face of external forces: soils appear able to retain function even when their biological structure has been radically altered. For how long they can do that, and how far we can push them, remain to be seen.
Acknowledgements
The authors are grateful to the Natural Environment Research Council for funding the Soil Biodiversity Programme. All members of that programme are credited with their contributions in the authorship, but we would particularly like to thank Jim Prosser, Bland Finlay, Mark Blaxter, Peter Young, Clare Rob-inson, Donald Davidson, Phil Ineson, Helaina Black and Laura Austin for making available unpublished data.
References
Berg, M., De Ruiter, P., Didden, W., Jansen, M., Schouten, T. & Verhoef, H. (2001) Community food web, decomposition and nitrogen mineralization in a stratified Scots pine forest soil. Oikos94, 130 –142.
Bloemers, G.F., Hodda, M., Lambshead, P.J.D., Lawton, J.H. & Wanless, F.R. (1997) The effects of forest disturbance on diversity of tropical soil nematodes. Oecologia111, 575 –582. Bradford, M.A., Jones, T.H., Bardgett, R.D. et al. (2002) Impacts of soil faunal community composition on model grassland ecosystems. Science298, 615 – 618.
Bruneau, P.M.C., Ostle, N., Davidson, D.A., Grieve, I.C. & Fallick, A.E. (2002) Determination of rhizosphere C-13 pulse signals in soil thin sections by laser ablation isotope ratio mass spectrometry. Rapid Communications in Mass Spectrometry16, 2190 –2194.
Cho, J.C. & Tiedje, J.M. (2000) Biogeography and degree of endemicity of fluorescent Pseudomonas strains in soil.
Applied and Environmental Microbiology66, 5448 –5456. Curtis, T.P., Sloan, W.T. & Scannell, J.W. (2002) Estimating
prokaryotic diversity and its limits. Proceedings of the National Academy of Sciences, USA99, 10494 –10499. Davidson, D.A., Bruneau, P.M.C., Grieve, I.C. & Young,
I.M. (2002) Impacts of fauna on an upland grassland soil as determined by micromorphological analysis. Applied Soil Ecology20, 133 –143.
Finlay, B.J. & Fenchel, T. (2001) Protozoan community struc-ture in a fractal soil environment. Protist152, 203 –218. Finlay, B.J., Esteban, G.F., Clarke, K.J. & Olmo, J.L. (2001)
Biodiversity of terrestrial protozoa appears homogeneous across local and global spatial scales. Protist152, 355 – 366.
Floyd, R., Abebe, E., Pepert, A. & Blaxter, M. (2002) Mole-cular barcodes for soil nematode identification. Molecular Ecology11, 839 – 850.
Gray, N.D., Hastings, R.C., Sheppard, S.K et al. (2003) Effects of soil improvement treatments on bacterial com-munity structure and soil processes in an upland grassland soil. FEMS Microbiology Ecology46, 11–22.
Griffiths, R.I., Whiteley, A.S., O’Donnell, A.G. & Bailey, M.J. (2003) Physiological and community responses of established grassland bacterial populations to water stress. Applied and Environmental Microbiology69, 6961– 6968.
Groombridge, B. (1992) Global Biodiversity. Chapman & Hall, London.
Horner-Devine, M.C., Carney, K.M. & Bohannan, B.J.M. (2004a) An ecological perspective on bacterial biodiversity.
Proceedings of the Royal Society of London, Series B271, 113 –122.
Horner-Devine, M.C., Lage, M., Hughes, J.B. & Bohannan, B.J.M. (2004b) A taxa–area relationship for bacteria.
Nature432, 750 –753.
Hunt, H.W. & Wall, D.H. (2002) Modelling the effects of the loss of soil biodiversity on ecosystem function. Global Change Biology8, 33 –50.
Hunt, H.W., Coleman, D.C., Ingham, E.R. et al. (1987) The detrital food web in a shortgrass prairie. Biology and Fertility of Soils3, 57– 68.
Husband, R., Herre, E.A., Turner, S.L., Gallery, R. & Young, J.P.W. (2002) Molecular diversity of arbuscular mycorrhizal fungi and patterns of host association over time and space in a tropical forest. Molecular Ecology11, 2669 –2678.
Johnson, D., Leake, J.R., Ostle, N., Ineson, P. & Read, D.J. (2002) In situ (CO2)-C13 pulse-labelling of upland grassland
demonstrates a rapid pathway of carbon flux from arbus-cular mycorrhizal mycelia to the soil. New Phytologist153, 327– 334.
377
Biodiversity and ecosystem function in soil
© 2005 British Ecological Society,
Functional Ecology,
19, 369–377
and previously uncultured soil bacteria. Applied and En-vironmental Microbiology69, 7210 –7215.
Kowalchuk, G.A., Gerards, S. & Woldendorp, J.W. (1997) Detection and characterization of fungal infections of Ammo-phila arenaria (marram grass) roots by denaturing gradient gel electrophoresis of specifically amplified 18S rDNA. Applied and Environmental Microbiology63 (10), 3858 –3865. Liu, W.T., Marsh, T.L., Cheng, H. & Forney, L.J. (1997)
Characterization of microbial diversity by determining terminal restriction fragment length polymorphisms of genes encoding 16S rRNA. Applied and Environmental Micro-biology63 (11), 4516 – 4522.
Manefield, M., Whiteley, A.S., Griffiths, R.I. & Bailey, M.J. (2002) RNA stable isotope probing, a novel means of link-ing microbial community function to phylogeny. Applied and Environmental Microbiology68, 5367 –5373.
McCaig, A., Glover, L.A. & Prosser, J.I. (2001) Numerical analysis of grassland bacterial community structure under different land management regimens by using 16S ribosomal DNA sequence data and denaturing gradient gel electrophoresis banding patterns. Applied and Environ-mental Microbiology67, 4554 – 4559.
Meselson, M. & Stahl, F.W. (1958) The replication of DNA.
Cold Spring Harbor Symposium in Quantitative Biology23, 9 –12.
Morton, J.B., Bentivenga, S.P. & Bever, J.D. (1995) Discovery, measurement, and interpretation of diversity in arbuscular endomycorrhizal fungi (Glomales, Zygomycetes). Canadian Journal of Botany73, S25 –S32.
Ostle, N., Ineson, P., Benham, D. & Sleep, D. (2000) Carbon assimilation and turnover in grassland vegetation using an
in situ (CO2)-C-13 pulse labelling system. Rapid Commun-ications in Mass Spectrometry14, 1345 –1350.
Ostle, N., Whiteley, A.S., Bailey, M.J., Sleep, D., Ineson, P. & Manefield, M. (2003) Active microbial RNA turnover in a grassland soil estimated using a (CO2)-C13 spike. Soil Bio-logy and Biochemistry35, 877– 885.
Pawlowska, T.E. & Taylor, J.W. (2004) Organization of genetic variation in individuals of arbuscular mycorrhizal fungi. Nature427, 733 –737.
Radajewski, S., Ineson, P., Parekh, N.R. & Murrell, J.C. (2000) Stable-isotope probing as a tool in microbial ecology.
Nature403, 646 – 649.
Sait, M., Hugenholtz, P. & Janssen, P.H. (2002) Cultivation of genetically distinct soil bacteria from phylogenetic lineages previously only detected in culture-independent surveys.
Environmental Microbiology4, 654 – 666.
Staddon, P.L. (2004) Carbon isotopes in functional soil ecology.
Trends in Ecology and Evolution19, 148 –154.
Staddon, P.L., Ostle, N., Dawson, L.A. & Fitter, A.H. (2003a) The speed of soil carbon throughput in an upland soil is increased by liming. Journal of Experimental Botany54, 1461–1469.
Staddon, P.L., Ramsey, C.B., Ostle, N., Ineson, P. & Fitter, A.H. (2003b) Rapid turnover of hyphae of mycorrhizal fungi determined by AMS microanalysis of 14C. Science300,
1138 –1140.
Suter, D., Frehner, M., Fischer, B.U., Nosberger, J. & Luscher, A. (2002) Elevated CO2 increases carbon allocation
to the roots of Lolium perenne under free-air CO2
enrich-ment but not in a controlled environenrich-ment. New Phytologist 154, 65 –75.
Tiedje, J.M., Asuming-Brempong, S., Nusslein, K., Marsh, T.L. & Flynn, S.J. (1999) Opening the black box of soil micro-bial diversity. Applied Soil Ecology13, 109 –122. Torsvik, V., Goksoyr, J. & Daae, F.L. (1990) High diversity of
DNA in soil bacteria. Applied and Environmental Micro-biology56, 783 –787.
Torsvik, V., Ovreas, L. & Thingstad, T.F. (2002) Prokaryotic diversity – magnitude, dynamics, and controlling factors.
Science296, 1064 –1066.
Vandenkoornhuyse, P., Husband, R., Daniell, T.J. et al.
(2002) Arbuscular mycorrhizal community composition associated with two plant species in a grassland ecosystem.
Molecular Ecology11, 1555 –1564.
Vandenkoornhuyse, P., Ridgway, K.P., Watson, I.J., Fitter, A.H. & Young, J.P.W. (2003) Co-existing grass species have distinctive arbuscular mycorrhizal communities. Molecular Ecology12, 3085 –3095.
Wall, D., Paul, E.A. & Fitter, A.H. (2005) Developing new perspectives from advances in soil biodiversity research.
Soil Biodiversity and Function, 44th Symposium of the British Ecological Society (eds R. Bardgett & M.B. Usher), pp. 000 – 000. Blackwell Scientific Publications, Oxford (in press).
Whitaker, R.J., Grogan, D.W. & Taylor, J.W. (2003) Geographic barriers isolate endemic populations of hyperthermophilic archaea. Science301, 976 –978.
Zhou, J.Z., Xia, B.C., Treves, D.S. et al. (2002) Spatial and resource factors influencing high microbial diversity in soil.
Applied and Environmental Microbiology68, 326 –334.