Sediment
fi
ngerprinting in agricultural catchments: A critical re-examination of source
discrimination and data corrections
Hugh G. Smith
a,⁎
, William H. Blake
b aSchool of Environmental Sciences, University of Liverpool, Liverpool, L69 7ZT, UK
bSchool of Geography, Earth and Environmental Sciences, Plymouth University, Plymouth, PL4 8AA, UK
a b s t r a c t
a r t i c l e i n f o
Article history: Received 8 April 2013
Received in revised form 5 August 2013 Accepted 6 August 2013
Available online 14 August 2013
Keywords:
Sedimentfingerprinting Sediment tracing Sediment sources Fallout radionuclides Soil geochemistry River catchments
Fine sediment sourcefingerprinting techniques have been widely applied in agricultural river catchments. Successful source discrimination in agricultural environments depends on the key assumption that land-use source signatures imprinted on catchment soils are decipherable from those due to other landscape factors affecting soil and sediment properties. In this study, we re-examine this critical assumption by investigating (i) the physical and chemical basis for source discrimination and (ii) potential factors that may confound source un-mixing in agricultural catchments, including particle size and organic matter effects on tracer properties. The study is situated in the River Tamar, a predominantly agricultural catchment (920 km2) in south-west England that has also been affected by mining. Source discrimination focused on pasture and cultivated land uses and channel banks. Monthly, time-integrated suspended sediment samples were collected across seven catchments for a 12-month period. Physical and chemical properties measured in source soils and sediment included fallout radionuclides (137Cs, excess210Pb), major and minor element geochemical constituents, total organic carbon and particle size. Source discrimination was entirely dependent on differences in tracer property concentrations be-tween surface and sub-surface soils. This is based on fallout radionuclide concentrations that are surface-elevated, while many geochemical properties are surface-depleted due to weathering and pedogenetic effects, although surface soil contamination can reverse this trend. However, source discrimination in the study catch-ments was limited by (i) rotation of cultivated and pasturefields resulting in reduced differences between these two sources, and (ii) the cultivated source signature resembling a mix of the pasture and channel bank sources for many tracer properties. Furthermore, a combination of metal pollution from abandoned historic mines and organic enrichment of sediment from upland areas of peaty soils resulted in the non-conservative be-haviour of some tracer properties in several catchments. Differences in the particle size and organic carbon con-tent of source soils could explain much of the variation in these properties in downstream sediment, rather than selective transport effects. Inconsistent relationships between particle size, organic carbon and tracer property concentrations further undermined the basis for the use of widely applied corrections to tracer datasets. Sensi-tivity analysis showed that correcting source tracer data for differences in organic matter can produce large changes to source contribution estimates that cannot be justified, and such corrections should not be used. Con-founding factors related to poor source discrimination and non-conservative behaviour are highly likely to affect sedimentfingerprinting studies in many agricultural catchments. As a result, estimates of source contributions in manyfingerprinting studies may contain significant unquantified errors.
© 2013 Elsevier B.V. All rights reserved.
1. Introduction
Fine sedimentfingerprinting involves the discrimination of sedi-ment sources based on differences in source material properties and quantification of the relative contributions from these sources to sedi-ment delivered downstream in river catchsedi-ments. Thefingerprinting procedure employs statistical testing of a range of source material tracer properties to select a subset that discriminate sources (Collins and Walling, 2002). These tracers may include geochemical, radionuclide,
mineral magnetic, organic constituent, stable isotope and colour prop-erties (Foster and Lees, 2000). Source un-mixing requires solutions to a set of linear equations that represent the value of an individual tracer property in sediment as a function of the sum of the values of that tracer for each source multiplied by the unknown proportional contribution from each source. Solutions are obtained using optimisation techniques that minimise the sum of errors associated with the equations (Yu and Oldfield, 1989; Collins et al., 1997; Walden et al., 1997).
Multi-parameter sediment sourcefingerprinting techniques were initially developed in agricultural catchments, and sought to discrimi-nate pasture, cultivated and forest land uses as well as channel bank sources (Peart and Walling, 1986; Walling et al., 1993; Walling and Geomorphology 204 (2014) 177–191
⁎ Corresponding author.
E-mail address:hugh.smith@liverpool.ac.uk(H.G. Smith).
0169-555X/$–see front matter © 2013 Elsevier B.V. All rights reserved. http://dx.doi.org/10.1016/j.geomorph.2013.08.003
Contents lists available atScienceDirect
Geomorphology
Woodward, 1995). Other early approaches to determinefine sediment sources were based exclusively on selected properties such as fallout ra-dionuclides (Wallbrink and Murray, 1993; Wallbrink et al., 1998) or mineral magnetic measurements (Oldfield et al., 1979; Yu and Oldfield, 1989). The key difference between these early approaches was the a priori selection of specific tracer properties based on well-established source differences, in contrast to multi-parameter source
fingerprinting which relies on statistical selection of a subset of proper-ties to discriminate sources. There remains a notable divide in the liter-ature between the multi-parameterfingerprinting studies and those that use only pre-selected tracer properties, most commonly the fallout radionuclides137Cs and excess210Pb.
Since the initial studies there has been a rapid expansion in re-search output based on sediment sourcefingerprinting techniques (see reviews by Walling, 2005; Mukundan et al., 2012). Besides land use or channel bank sources, otherfingerprinting studies have focused on discriminating sources according to geological zones based on soil geochemical as well as spectral–colorimetric properties (e.g.Douglas et al., 2009; Evrard et al., 2011; D'Haen et al., 2012; Legout et al., 2013). Fingerprinting studies have also examined sedi-ment sources in urban environsedi-ments (Carter et al., 2003; Poleto et al., 2009), forest environments including harvest areas and roads (Motha et al., 2003), and in forest areas disturbed by wildfire, where most studies use fallout radionuclide tracers to discriminate hillslope and channel bank sources (e.g. Wilkinson et al., 2009; Smith et al., 2013).
However, source fingerprinting techniques continue to be most widely applied in agricultural catchments (e.g.Owens et al., 2000; Gruszowski et al., 2003; Stutter et al., 2009; Collins et al., 2010a; Martínez-Carreras et al., 2010b; Blake et al., 2012). This reflects demand from land management agencies for information on fine sediment sources and the need to target resources to reduce elevated sediment pollution from agriculture (Gellis and Walling, 2011). In this context, source discrimination continues to focus on land use, while recent stud-ies have sought to extend this to include sources such as damaged road verges, urban street dust and farm track surfaces (Collins et al., 2010a, 2012). With the demand for greater levels of detail and hence inclusion of additional sources related to highly specific landscape features, it is very important to consider the physical and chemical basis for source discrimination that underpins the entire multi-parameterfi ngerprint-ing method.
Recent studies tend to presentfine sediment sourcefingerprinting as a robust and highly transferable technique that can deliver accurate estimates of source apportionment with high precision in a range of catchment environments. However, there is a need for further investi-gation of the extent to which land use-based sources offine sediment within agricultural catchments can be reliably discriminated and appor-tioned. A critical assumption underpinning the widespread use of sourcefingerprinting in agricultural catchments is that land-use source signatures imprinted on catchment soils are decipherable from those due to other landscape factors affecting soil and sediment properties, such as differences in geology, soil type or previous land-use effects (e.g. historic mining). This key underlying assumption for discriminat-ing and apportiondiscriminat-ing land-use sources has not been adequately ac-knowledged or challenged in the literature to date.
In this study, we re-examine the application of thefine sediment sourcefingerprinting procedure to discriminate land use and channel bank sources in agricultural river catchments. The study focuses on the discrimination of pasture, cultivated and channel bank sources of suspended sediment. The objectives are (i) to identify the physical and chemical basis for source discrimination by tracer properties select-ed using thefingerprinting procedure in agricultural catchments, and (ii) to re-examine the treatment of tracer data for particle size and or-ganic matter effects. It is essential to establish that land use and channel bank source categories can be discriminated and apportioned with
con-fidence, given that these sources form part of allfingerprinting studies
in agricultural catchments. Additionally, because sourcefingerprinting produces proportional results, a large error in the estimated contribu-tion for one source must affect the results for one or more other sources. Therefore, it is very important that errors in source discrimination and apportionment are constrained, and preferably contextualised using
catchment sediment load data to assess source-specific mass
contributions.
2. Methods
2.1. Study catchments
The study was situated in the River Tamar, a predominantly agri-cultural catchment located in south-west England (Fig. 1). The river forms the main boundary between the counties of Devon and Corn-wall and drains south into the Tamar Estuary at Plymouth. All source soil and river sediment sampling were conducted above the tidal limit. River monitoring sites were situated at 7 locations comprising 6 sub-catchments nested within the main Tamar catchment (920 km2) upstream of the village of Gunnislake, the study
catch-ment outlet. The monitored sub-catchcatch-ments include the Rivers Carey (67 km2), Inny (97 km2), Kensey (38 km2), Lyd (219 km2),
Ottery (124 km2), and a second measurement site on the main
chan-nel of the Tamar in the upper catchment (Tamar Upper; 238 km2).
[image:2.595.305.547.346.718.2]The topography of the River Tamar is characterised by short, steep hillslopes in the lower and mid-catchment and lower relief, undulating
Fig. 1.River Tamar catchment with source soil and river sediment sampling locations displayed.
terrain in the upper catchment, where the maximum elevation is only 226 m. The highest elevation areas are located in the east and west of the catchment where the headwaters of the Rivers Inny (maximum 369 m) and Lyd (maximum 581 m) drain the margins of the granitic uplands of Bodmin Moor and Dartmoor, respectively. Most of the catchment is underlain byfine sedimentary rocks that include mudstones, shales and sandstones. However in the Inny and lower Tamar, there are small areas of extrusive igneous rocks (lavas and tuffs). Soils are predominantly loamy, with some peaty soils in upland areas. The extent offloodplain in the Tamar is limit-ed and confined by narrow steep-sided valleys and shallow bed-rock. The largestfloodplain area is located in the mid catchment, where all the main tributary rivers join the main channel with the exception of the Inny (Fig. 1).
The River Tamar at Gunnislake has a mean dailyflow of 22.4 m3s−1,
with a range in dailyflows from 0.58 to 482 m3s−1over the period from
1956 to 2012. Mean annual rainfall for the catchment is 1284 ± 156 mm based on 1971–2000 gridded rainfall data (1 × 1 km). There is a pro-nounced spatially variability in rainfall, with highest annual totals over the upland areas in the east and west. There is also pronounced seasonal-ity in annual rainfall and riverflows, with the highest discharge generally from November to March. During the 12-month monitoring period from September 2011 to the start of October 2012, mean dailyflow was 23.9 m3s−1and ranged from 4.5 to155 m3s−1. Flows were elevated
be-tween November 2011 and early February 2012 after which there was an extended spring dry period (March–April 2012) followed by an unsea-sonably wet late spring and summer that was characterised by frequent highflows between 40 and 100 m3s−1.
The 2007 UK Land Cover Map (Morton et al., 2011) indicated that for the Tamar catchment above Gunnislake, all types of grass-land accounted for 50% of the grass-land area, with 36% covered by arable land, and 11% by deciduous and coniferous woodlands. The propor-tion of land classified as arable is changeable in relation to seasons andfield rotation, such that many pasturefields may also be peri-odically cultivated. There are large numbers of mostly 19th Century abandoned metal mines in the southern part of the catchment, mainly in the area around Gunnislake, as well as in the Lyd, Inny and Kensey tributaries. The other sub-catchments are unaffected by mine drainage. Metal pollution from abandoned mines is a prob-lem in the lower catchment. Previous work has estimated mine point source contributions to downstream metal contaminant
fluxes and found thatN50% was unaccounted for by the surveyed point sources (Mighanetara et al., 2009).
2.2. Source and suspended sediment sampling
Catchment sources were classified as either surface soil divided according to pasture and cultivated land uses or sub-surface soil de-rived predominantly from channel banks. No gullies were observed in the catchments. Sub-surface drainage of agricultural land could contribute subsoil to streams, although previous work indicated drains are a delivery pathway for mostly topsoil-derived sediment (Foster et al., 2003; Chapman et al., 2005). Surface soil sampling lo-cations were selected from across the Tamar catchment based on the general criteria of (i) proximity and potential connectivity to streams, (ii) access, and (iii) possible evidence of erosion or degrada-tion of pasture sites. Due to analytical constraints on source sample numbers, it was not possible to collect a discrete set of source sam-ples for each sub-catchment. Instead, source samsam-ples collected from across the Tamar were pooled and used in un-mixing source contributions for each river sampling location. Sampling of pasture and cultivated sites was distributed across the entire catchment (Fig. 1) to capture potential variability infingerprint properties associated with differences in rainfall, geology and aspect within these two land use cat-egories. However, it should be noted that the geology of the catchment is
very uniform, with 94% of its area underlain by similar sedimentary rocks.
Surface soils under woodland were not sampled as part of the source characterisation. Initially, woodland soils were to be collected for analysis. However, following inspection of several woodland sites it was found that a plant litter layer 0–5 cm deep and comprised al-most entirely of organic material covered the soil. This made sam-pling of mineral surface soil that could be exposed to surface erosion impossible. Furthermore, there was no evidence of surface erosion in these woodland locations, which is supported by studies in the UK that show minimal erosion and sediment contributions from woodlands (Evans, 1990; Walling et al., 1999). Therefore, it was decided to focus the sampling effort on those land uses that cov-ered most of the catchment and represent a credible source of miner-al sediment.
Composite soil samples were collected from all sources. This includ-ed 18 composite samples from pasture areas, 12 composites for cultivat-ed areas and 20 composites from channel banks. For surface soils, a minimum of 10 individual samples were collected from 0 to 2 cm depth along transects at approximately 10 m intervals and combined in thefield to form a single composite sample. At some sites more indi-vidual samples were taken in order to collect material from a wider area. In total, 349 individual surface soil samples were collected from 30 loca-tions around the catchment.
For channel bank sampling, actively eroding channel reaches were selected for sampling following reconnaissance of the channels within each sub-catchment and along the main channel of the River Tamar. In total, 8 composite samples were taken from along the main channel and the remaining 12 were collected from tributary streams. Channel bank sampling involved collection of even scrapes of bank material from the bank top to base. This sampling protocol was based on the rec-ognition that over sufficient time banks will erode across the entire bank height, either by instantaneous collapse or non-synchronous lower and upper bank retreat through a combination of erosion by
flow scour and sub-aerial processes (Prosser et al., 2000; Couper and Maddock, 2001; Smith and Dragovich, 2008). A minimum of 10 scrapes were collected for each composite sample. Sampled banks varied in height between 0.5 and 1.5 m.
Suspended sediment was collected at the 7 river monitoring sites using in situ time-integrated samplers based on the design outlined by
Phillips et al. (2000). The samplers were made from polyvinylchloride (PVC) tubes 1 m in length and 0.11 m in diameter with sealed caps at both ends that contained 3 mm diameter inlet and outlet tubes. Water and suspended sediment pass through the narrow inlet tube and enter the PVC tube where the change in cross-sectional area promotes a reduction inflow velocity and sedimentation (Phillips et al., 2000). The samplers were installed in pairs at riffles andfixed to lengths of rebar that were hammered into the channel bed. Sampling intervals were approximately monthly, although this varied in relation to water level which sometimes limited site access. Suspended sediment sam-pling was undertaken over a 12-month period from mid-September 2011 until the start of October 2012 for all sites except the River Carey. At this site, sampling commenced in November 2011 and only 10 samples were collected monthly.
2.3. Laboratory analyses
Source soil samples were initially air-dried, gently disaggregated using a mortar and pestle and sieved tob63μm. It was necessary to oven-dry some wet soil samples at 40 °C. Water and sediment captured by the time-integrated samplers were removed from thefield in 20 l containers and stored in a cold room for 24 h. This allowed settling and extraction of most of the water by siphon. The remaining sediment-water mix was centrifuged at 3000 rpm for 20 min and the supernatant decanted. The sediment samples were freeze-dried for 48 h, then gently disaggregated and sieved tob63μm for analysis.
Soil and sediment samples were analysed for fallout radionuclides (137Cs, excess210Pb), geochemical constituents, total organic carbon
and particle size. Initially, all soil and most sediment samples were packed into 50 mm Petri dishes in preparation for gamma spectrometer analysis. Some low mass sediment samples were measured in 4 mm vials. The petri dishes and vials were sealed for 21 days to allow equili-bration between214Pb and its progenitor226Ra. Activity concentrations
of the radionuclides were measured using a low background EG&G Ortec planar (GMX50-83-LB-C-SMN-S) and well (GWL-170-15-S) HPGe gamma spectrometers at the Plymouth University Consolidated Radioisotope Facility. Total210Pb was measured by its gamma emissions
at 46.5 keV and its unsupported component calculated by subtraction of
226Ra activity, which was measured using214Pb gamma emissions at
295 and 352 keV.137Cs was determined by its gamma emissions at
662 keV (with correction for214Bi emissions). Count times were
typi-cally 24 h, although some low mass sediment samples were counted for 48 h. Analytical performance was assessed by inter-laboratory com-parison tests using reference materials supplied by the International Atomic Energy Agency.
Following gamma spectrometer measurements, all samples were unpacked and sub-sampled for analysis by X-Ray Fluorescence (XRF) using a Niton XL3T 950 He GOLDD+ XRF Analyser mounted in a labora-tory test stand with He gas purging to permit measurement of light ele-ments. Samples were analysed for major and minor elements (Mo, Nb, Zr, Sr, Rb, Bi, As, Se, Au, Pb, W, Zn, Cu, Re, Ta, Hf, Ni, Co, Fe, Mn, Cr, V, Ti, Ca, K, Ba, Sb, Sn, Cd, Pd, Ag, Al, P, Si, Cl, S and Mg). Only those elements returning measurements above the limit of detection have been employed in the analysis. P was also excluded on the basis of the risk of non-conservative behaviour during downstream transport (Granger et al., 2007).
The unpacked soil and sediment samples were further sub-sampled and measured for total organic carbon (TOC) by the difference between total carbon and inorganic carbon using a Skalar Primacs Carbon Analyser. The particle size distribution of the sieved samples was mea-sured using a Malvern 2000 series laser granulometer. Sub-samples were digested in hydrogen peroxide over 24 h to remove organic mat-ter and disaggregated in an ultrasonic bath prior to particle size analysis. Each sample was run in quintuplicate and the resulting data was checked for any large deviations from the average particle size distribu-tions. Particle size data were used to calculate the specific surface area (SSA, m2g−1) by assuming particle sphericity.
2.4. Sedimentfingerprinting procedure
The standard sediment sourcefingerprinting procedure is based on (i) statistical analysis of difference to identify a subset of tracer proper-ties that discriminate the target sediment sources followed by (ii) the use of multivariate mixing models comprised of a set of linear equations for each selected tracer property to estimate the proportional contribu-tions from each source (Yu and Oldfield, 1989; Collins et al., 1997; Walden et al., 1997). Tracer data often undergoes pre-treatment for par-ticle size and organic matter differences between source soils and sedi-ment. Uncertainty in source estimates is quantified using a Monte Carlo routine that repeatedly solves the mixing model using random samples drawn from probability distributions derived for source groups (Franks and Rowan, 2000).
2.4.1. Particle size and organic matter effects
Prior to the statistical analysis, tracer data is often pre-treated to ac-count for potential particle size or organic matter differences that could affect the comparison of tracer concentrations between source soils and sediment. Pre-treatment of data involves the use of correction factors applied to theb63μm fraction to account for differences in particle size (e.g.Collins et al., 1997; Gruszowski et al., 2003) and in some stud-ies for organic matter as well (e.g.Collins et al., 1997, 2010a, 2012). These corrections have been justified on the basis of (i) the preferential
adsorption of some tracer properties tofiner particles (Horowitz, 1991; He and Walling, 1996) and (ii) the potential for selective transport of
fines and organic matter which can become enriched in downstream sediment compared to source soils (Collins et al., 1997; Walling, 2005). As an alternative, a veryfine fraction (b10μm) may be extracted to minimise the particle size effect on tracer concentrations and avoid the need for particle size correction (e.g.Wallbrink et al., 2003; Smith et al., 2012). While this might be preferred over the use of correction factors, such a veryfine fraction may be less representative of the transported sediment (Koiter et al., 2013). Severalfingerprinting stud-ies have not corrected for particle size differences because analysis of particle size indicated no difference between source soils and sediment (Evrard et al., 2011, 2013), while others have not corrected for organic matter due to the risk of over-correction (Walling et al., 1999; Martínez-Carreras et al., 2010a).
The standard particle size and organic matter correction is based on the ratio of specific surface area (SSA) or total organic carbon (TOC) content of each individual sediment sample to the mean SSA or TOC of each source type multiplied by the mean tracer concentration for each source (Collins et al., 1997). Therefore, for each sediment sample, there is a set of corrected mean tracer concentrations for each source type to use in source un-mixing. This straightforward approach to par-ticle size and organic matter corrections relies on the assumption that a positive linear relationship exists between SSA or TOC and tracer con-centrations for all tracer properties used. There is evidence of a general positive relationship between SSA and various acid extractable metals (Horowitz and Elrick, 1987) and fallout radionuclides (He and Owens, 1995; He and Walling, 1996), reflecting the increasing adsorption po-tential of larger SSA (in m2g−1). However, it appears that these
rela-tionships are often non-linear and probably logarithmic in form, particularly over 1.0 m2g−1 (Horowitz, 1991; Russell et al., 2001).
Nonetheless, simple linear corrections may be a reasonable approxima-tion over narrow ranges in SSA. For larger ranges, such as in the study by
Russell et al. (2001)where SSA varied from 0.5 to 4.0 m2g−1, or where
the relationships between particle size and tracer properties are more complex (e.g.Foster et al., 1998), measurement of the specific relation-ships between particle size and individual tracer property concentra-tions will be required. In contrast to SSA, no clearly generalizable relationship is apparent for organic matter, with the relationship highly dependent on individual tracer properties and the type of organic mat-ter (Horowitz, 1991). Furthermore, SSA and organic matter content tend to exhibit a positive correlation (Horowitz and Elrick, 1987). As a result, correcting for both SSA and organic matter content could lead to significant over correction and errors in source apportionment.
In the present study, the relations between source soil and sediment SSA, TOC and tracer property concentrations were explored. Bi-plots of SSA versus TOC were used to examine the distribution of sediment from the 7 river monitoring sites relative to data for the three source categories. Bi-plots offer a simple visual means to qualitatively assess conservative behaviour in these two key variables. The strength and direction of linear relationships between individual tracer property concentrations and both SSA and TOC were measured using Pearson correlation coefficients for source soil and sediment datasets.
2.4.2. Statistical analysis for source discrimination
The range in tracer property concentrations in sediment relative to concentrations in source soils has not been specifically reported in sourcefingerprinting studies until recently (Martínez-Carreras et al., 2010a; Wilkinson et al., 2012). In contrast, source tracing stud-ies using mineral magnetic and fallout radionuclides have frequently provided such information in the form of bi-plots showing source
and sediment sample concentrations (e.g. Walden et al., 1997;
Wallbrink et al., 2003; Blake et al., 2006; Smith et al., 2011, 2012; Owens et al., 2012). While it is impractical to use bi-plots to examine the multiple tracer properties used in mostfingerprinting studies,
examination of the range of source and sediment tracer concen-trations is an important assessment of the conservative behaviour of each tracer property. In the present study, the range in source tracer concentrations was compared to the range in sediment concentrations for each river, with those tracer properties falling outside the range in source values removed from subsequent analysis.
Statistical analysis of tracer propertiesfirst involves using the non-parametric Kruskal–Wallis H test to identify those tracer properties that do not exhibit a significant difference between source categories (Collins and Walling, 2002). It tests the null hypothesis that tracer prop-erties exhibit no significant differences between source categories. Larg-er diffLarg-erences between categories result in an increase in theHstatistic. However, theHtest does not confirm differences between all possible paired combinations of source categories. Therefore, stepwise Discrimi-nant Function Analysis (DFA) is used to further assess the discriminatory power of those tracer properties that pass the Kruskal–WallisH test (Collins and Walling, 2002). The DFA identifies an optimum sourcefi n-gerprint that comprises the minimum number of tracer properties that provide the greatest discrimination between the analysed source mate-rials based on the minimisation of Wilks' lambda. The lambda value ap-proaches zero as the variability within source categories is reduced relative to the variability between categories based on the entry or re-moval of tracer properties from the analysis. The results of the DFA are used to examine the proportion of samples accurately classified into the correct source groups.
2.4.3. Source un-mixing and sensitivity analysis
The multivariate mixing model is based on a set of linear equations where each selected tracer property has an equation relating the tracer concentration in a sediment sample to the sum of the mean tracer con-centrations for each source multiplied by the respective unknown pro-portional source contributions. Solutions to the mixing model are obtained by using an optimisation procedure that selects values forPs
which minimises the sum of squares of the relative errors in the objec-tive function (f), as in Eq.(1):
f ¼X
n
i¼1 Ci−
Xm
s¼1 PsSsiZsOs
!! =Ci
( )2
Wi ð1Þ
whereCiis the concentration of tracer property (i) in the monthly
suspended sediment samples;Psis the optimized proportional
con-tribution from source (s); Ssiis the mean concentration of tracer
property (i) in source (s);Zsis the particle size andOsis the organic
matter correction factor for source (s); Wi is the tracer specific
weighting;nis the number of tracers andmis the number of sediment sources. In the present study, the particle size and organic matter correction factors were only used in a sensitivity analysis of source apportionment results.
The model is constrained by the requirements that proportional source contributions lie between 0 and 1 and the proportional source contributions sum to 1. The tracer-specific weighting was included so that the tracer properties with least variance exerted greater influence on mixing model solutions. It was calculated as the inverse of the square root of the variance of tracer data for each source that had been standardised by the respective source means (Collins et al., 1997). Fur-thermore, testing of the local optimisation procedure using multiple random start values resulted in no change compared to single solutions for un-mixing of monthly suspended sediments samples for all catch-ments, indicating that this local optimisation method was sufficient and use of global optimisation was unnecessary (see alsoCollins et al., 2010b; Wilkinson et al., 2012).
The model Goodness of Fit (GOF) was tested for every suspended sediment sample and each tracer property that formed part of the opti-mumfingerprint selected for each catchment. The GOF (%) was based
on the calculated relative difference between actual and modelled values (Motha et al., 2003), as in Eq.(2):
GOF¼ 1− Ci−
Xm
s¼1 PsSsi
!
=Ci
( )
100: ð2Þ
Uncertainty in source apportionment results was determined using a Monte Carlo sampling routine (cf.Franks and Rowan, 2000; Small et al., 2002). This procedure involved solving the mixing model based on random sampling of mean source tracer concentra-tions for 1000 iteraconcentra-tions. The mean values were represented by Student'stdistributions derived from the mean, standard deviation and sample number for each source sample group. Individual monthly sediment samples were represented by a single tracer con-centration. Proportional source estimates generated by the sampling routine were used to provide 95% confidence intervals for mean source contributions based on the 97.5 and 2.5 percentiles for each monthly sediment sample.
Sensitivity analysis of source apportionment results was performed by changing specific input terms to the mixing model related to differ-ent data treatmdiffer-ents. This analysis quantified the difference in estimates of proportional source contributions between test runs. Model runs used the optimum compositefingerprints (i.e. all tracer properties that were selected by the DFA) and the following inputs: (i) uncorrected mean source values, (ii) uncorrected median source values, (iii) mean source values corrected for SSA only and (iv) mean source values corrected for both SSA and TOC. Solutions to the mixing model were obtained by directly using the mean or medi-an values of the source tracer concentrations for each set of input conditions to isolate the effect of the change in inputs on mean monthly source apportionment results. Comparison of mean month-ly proportional source contributions based on the Monte Carlo sam-pling routine with solutions based directly on mean values of the tracer concentrations indicated a difference of only ± 0.01 for all catchments except the Carey, where the difference was 0.03.
3. Results and discussion
3.1. Testing particle size and organic matter corrections
Bi-plots show that differences in SSA and TOC between source soils may have a large effect on SSA and TOC characteristics in sediment from each of the river monitoring sites (Fig. 2). Kruskal–WallisHtests indicated that source category differences were significant for both SSA (H= 17.95;pb0.000) and TOC (H= 37.11;pb0.000). For the Tamar Upper, Ottery, Carey, and Tamar Gunnislake sites, SSA and TOC variations in suspended sediment could be entirely explained by source properties alone. For the Kensey, Lyd and Inny, there was clear evidence of TOC enrichment in some sediment samples compared to sources, which could result from erosion of areas of peaty soils in the headwaters of these three tributaries. The Inny exhibited a slight reduction in SSA, reflecting an increase in particle size relative to sources. Temporal changes in contributions from sources could also have an important ef-fect on the SSA and TOC content of suspended sediment samples. How-ever, in many previousfingerprinting studies the difference in particle size and organic matter content between sources and sediment samples has only been attributed to particle sorting and the enrichment offines and organic matter associated with downstream selective transport (e.g.Collins et al., 1997), rather than to differences between sources. As such, correcting tracer concentrations for each source group using the ratio of sediment-to-source SSA or TOC could alter the key relative differences in tracer concentrations between sources that form the basis for effective source discrimination.
As an illustrative example of the effect of corrections on surface– subsurface signals, mean sources values of 210Pb
catchment were 23, 30 and 55 Bq kg−1for channel bank, cultivated
and pasture sources, respectively. Applying the combined mean SSA and TOC correction factors (values in brackets) for the Tamar Upper site based on 12 monthly suspended sediment samples gave corrected mean source values of 47 (2.1), 28 (0.9) and 29 (0.5) Bq kg−1for channel bank, cultivated and pasture sources,
re-spectively. This completely altered the basis for source discrimina-tion using210Pb
exand produced corrected source values that were
not representative by inverting the210Pb
exsoil depth profile such
that the highest mean activity concentration occurred in the channel bank source which contained mostly sub-surface soil with low activ-ity. In another example, mean source values for Si were 293, 320 and 272 g kg−1for channel bank, cultivated and pasture sources. Follow-ing correction, mean values (with correction factors) were 887 (3.0), 437 (1.4) and 205 (0.8) g kg−1, respectively. Again, the relative
dif-ferences between sources were altered by using corrections. Nota-bly, the SSA and TOC correction factors employed here were within the range of factors previously used to correct data from equivalent source types (Collins et al., 1997).
To examine potential linear relationships with tracer property con-centrations in source soils and sediment, Pearson correlation coeffi -cients were computed for SSA (Table 1) and TOC (Table 2). These tables show that the occurrence of significant correlations was variable across tracer properties, source categories and sampled rivers for both SSA and TOC. No tracer properties exhibited significant correlations across all sources and sediment from all rivers for either SSA or TOC, al-though some properties did show pronounced trends. Nor were the sig-nificant correlations all positive, as might have been expected, given that SSA and TOC tracer corrections are based on this assumption. This analysis does not isolate the effect of SSA or TOC on tracer concentra-tions, which reduced the strength of correlations. However, it does allow the identification of trends across source and suspended sediment groups. For example, Zn, Mn, Fe, Rb, Sr, S and Ca showed significant pos-itive correlations with SSA for at least 4 of the 7 river monitoring sites
(Table 1). This was consistent with previous observations of the rela-tionship with SSA for Zn, Mn, and Fe (Horowitz and Elrick, 1987) as well as for Rb (Rawlins et al., 2010) in river sediment. In contrast, Si and Zr displayed significant negative correlations with SSA for most river sediments, while for Zr this also extended to all three source groups. The negative relationship for Si and Zr may reflect a mineral compositional control related to preferential association with the silt fraction (Cuven et al., 2010), and hence a negative relation to SSA. For TOC, consistent significant positive correlations existed with S, Ca, Zn and Fe, whereas there were significant negative correlations for Zr and Ti for 4 or more source and river sediment groups (Table 2). The positive relationships presumably reflected associations with organic matter and the formation of metal–organic complexes (Horowitz, 1991; House and Denison, 2002). In contrast, the mineral origins of Zr and Ti resulted in a negative relationship as increasing TOC reduces the miner-al fraction and therefore the concentration of these elements in the samples.
[image:6.595.40.547.52.334.2]The correlation analysis demonstrates that a positive linear rela-tionship between SSA or TOC and tracer concentrations cannot be assumed to apply uniformly to all the tracer properties examined in the present study. However, many sourcefingerprinting studies based on geochemical properties apply uniform SSA and TOC correc-tions without consideration of either the strength or direction of these relationships. As a result of the evidence indicating that (i) much of the variability in SSA and TOC can be explained by differ-ences between sources with noted exceptions and (ii) the inconsis-tency in the strength and direction of relationships between tracer concentrations and SSA and TOC, the tracer data employed in the subsequent analysis were not corrected. We considered that errors incurred through inappropriate corrections were more likely to ex-ceed those resulting from the use of uncorrected data. Furthermore, comparison of ranges in source and sediment tracer concentrations provided an additional control on conservative behaviour without the need for corrections.
Fig. 2.Plots of specific surface area (SSA) versus total organic carbon (TOC) for monthly suspended sediment samples collected from each river sampling site compared with grouped data for source soil samples collected across the entire Tamar catchment. Note the source data are the same in each plot as well as the differences in y-axis scales.
Table 1
Pearson correlation coefficients (r) and associatedpvalues for correlations between specific surface area (SSA) and tracer property concentrations for source soil and suspended sediment samples. Significant correlations are indicated in bold for both the 0.05 significance level (*) and the 0.01 level (**).
Tracer property Sources River sediment
Cultivated Channel banks Pasture Tamar Upper Ottery Carey Kensey Lyd Inny Tamar Gunnislake
r p r p r p r p r p r p r p r p r p r p
137
Cs 0.061 0.852 0.127 0.593 −0.416 0.086 0.417 0.177 −0.135 0.675 −0.512 0.130 0.249 0.434 0.508 0.092 0.422 0.171 0.261 0.413
210
Pbex 0.077 0.813 0.161 0.498 −0.550* 0.018 0.442 0.150 0.399 0.198 −0.051 0.889 0.471 0.122 0.289 0.363 0.149 0.645 −0.305 0.334
Ba 0.264 0.406 0.347 0.134 0.405 0.095 0.088 0.785 −0.208 0.518 0.116 0.749 −0.198 0.537 −0.482 0.112 −0.384 0.218 −0.248 0.437 Nb 0.177 0.582 −0.146 0.538 −0.328 0.183 −0.483 0.111 −0.381 0.222 −0.288 0.420 −0.235 0.463 −0.541 0.069 −0.777** 0.003 −0.657* 0.020 Zr −0.586* 0.045 −0.673** 0.001 −0.733** 0.001 −0.792** 0.002 −0.756** 0.004 −0.954** 0.000 0.011 0.972 −0.826** 0.001 −0.766** 0.004 −0.936** 0.000 Sr 0.432 0.161 −0.231 0.328 −0.072 0.776 0.492 0.105 0.766** 0.004 0.810** 0.005 −0.062 0.848 0.590* 0.044 −0.172 0.592 0.729** 0.007 Rb 0.384 0.218 0.598** 0.005 0.149 0.556 0.653* 0.021 0.449 0.143 0.899** 0.000 −0.011 0.974 0.855** 0.000 0.290 0.361 0.866** 0.000
Pb −0.146 0.651 0.191 0.419 0.290 0.243 0.754** 0.005 0.469 0.124 0.085 0.816 −0.261 0.413 0.171 0.596 0.121 0.708 0.526 0.079
Zn 0.246 0.440 0.181 0.445 −0.056 0.827 0.617* 0.033 0.794** 0.002 0.910** 0.000 0.450 0.142 0.217 0.499 0.845** 0.001 0.836** 0.001 Fe 0.120 0.711 0.385 0.094 0.336 0.172 0.655* 0.021 0.796** 0.002 0.934** 0.000 0.149 0.643 0.429 0.164 0.491 0.105 0.980** 0.000 Mn 0.609* 0.036 0.273 0.244 −0.016 0.948 0.668* 0.018 0.656* 0.020 0.929** 0.000 0.387 0.214 0.152 0.636 0.748** 0.005 0.900** 0.000 Cr 0.216 0.500 0.142 0.551 0.158 0.532 0.137 0.671 0.734** 0.007 0.473 0.168 −0.096 0.767 0.577* 0.049 0.665* 0.018 0.670* 0.017
V 0.335 0.287 0.450* 0.046 0.718** 0.001 0.259 0.415 0.513 0.088 0.503 0.139 −0.127 0.695 0.371 0.235 −0.231 0.470 0.358 0.253
Ti −0.163 0.612 −0.218 0.355 0.011 0.964 −0.407 0.189 −0.519 0.084 −0.499 0.142 0.058 0.857 −0.084 0.795 −0.750** 0.005 −0.765** 0.004 Ca 0.162 0.615 −0.263 0.262 −0.646** 0.004 0.641* 0.025 0.915** 0.000 0.736* 0.015 −0.144 0.655 0.267 0.401 0.657* 0.020 0.846** 0.001 K 0.413 0.182 0.653** 0.002 0.524* 0.025 0.573 0.052 0.366 0.242 0.856** 0.002 −0.190 0.553 0.539 0.070 −0.326 0.301 0.508 0.091 Al 0.084 0.795 0.218 0.355 0.700** 0.001 0.274 0.390 −0.030 0.927 0.820** 0.004 0.073 0.823 0.643* 0.024 −0.459 0.133 −0.483 0.112 Si 0.090 0.781 −0.203 0.391 −0.271 0.277 −0.814** 0.001 −0.622* 0.031 −0.917** 0.000 −0.209 0.514 −0.674* 0.016 −0.548 0.065 −0.862** 0.000 S −0.249 0.435 −0.005 0.983 −0.141 0.576 0.696* 0.012 0.867** 0.000 0.873** 0.001 0.346 0.271 0.320 0.310 0.800** 0.002 0.790** 0.002 Mg −0.221 0.490 −0.181 0.445 −0.160 0.526 0.529 0.077 0.133 0.679 0.699* 0.025 0.371 0.235 0.073 0.822 −0.345 0.273 −0.192 0.549 Counts (/20)
Sign. correl. 2 4 6 9 9 12 0 6 8 12
Pos. sign. correl. 1 3 2 7 7 10 0 4 5 8
18
3
H.
G.
Sm
it
h
,W.
H.
Bl
ak
e
/
Ge
om
or
p
h
o
lo
gy
2
0
4
(2
0
1
4
)
17
7
–
19
Table 2
Pearson correlation coefficients (r) and associatedpvalues for correlations between total organic carbon (TOC) and tracer property concentrations for source soil and suspended sediment samples. Significant correlations are indicated in bold for both the 0.05 significance level (*) and the 0.01 level (**).
Tracer property Sources River sediment
Cultivated Channel banks Pasture Tamar Upper Ottery Carey Kensey Lyd Inny Tamar Gunnislake
r p r p r p r p r p r p r p r p r p r p
137
Cs 0.765** 0.004 0.277 0.237 0.351 0.153 0.483 0.112 −0.401 0.196 −0.310 0.383 −0.603* 0.038 0.805** 0.002 0.592* 0.043 0.329 0.297
210
Pbex 0.620* 0.031 0.482* 0.032 0.524* 0.026 −0.086 0.791 0.269 0.398 0.123 0.735 −0.007 0.982 0.015 0.962 0.377 0.226 −0.667* 0.018
Ba −0.377 0.227 −0.100 0.675 −0.142 0.573 0.181 0.573 −0.130 0.686 0.230 0.523 −0.902** 0.000 −0.863** 0.000 −0.512 0.089 −0.667* 0.018 Nb 0.314 0.320 0.189 0.424 0.010 0.970 −0.701* 0.011 −0.159 0.622 −0.346 0.328 −0.128 0.692 −0.617* 0.033 −0.656* 0.020 −0.539 0.070 Zr 0.087 0.787 −0.167 0.481 −0.598** 0.009 −0.424 0.170 −0.120 0.711 −0.930** 0.000 −0.655* 0.021 −0.837** 0.001 −0.636* 0.026 −0.639* 0.025 Sr −0.127 0.694 0.019 0.936 −0.182 0.470 0.318 0.314 −0.019 0.954 0.719* 0.019 0.227 0.479 0.284 0.371 −0.216 0.501 0.461 0.131
Rb −0.319 0.313 0.057 0.812 0.344 0.162 0.257 0.420 −0.177 0.582 0.801** 0.005 −0.121 0.707 0.263 0.408 0.119 0.712 0.483 0.111
Pb 0.054 0.868 0.001 0.995 −0.019 0.939 0.361 0.249 0.468 0.125 −0.065 0.859 0.027 0.935 0.740** 0.006 0.384 0.218 0.331 0.293
Zn 0.088 0.785 0.249 0.290 0.501* 0.034 0.513 0.088 0.650* 0.022 0.870** 0.001 0.256 0.422 0.846** 0.001 0.500 0.098 0.459 0.133 Fe −0.410 0.185 0.238 0.313 0.574* 0.013 0.437 0.155 0.481 0.113 0.941** 0.000 0.850** 0.000 0.909** 0.000 0.424 0.170 0.700* 0.011
Mn 0.105 0.744 0.082 0.731 0.321 0.194 0.513 0.088 0.429 0.164 0.899** 0.000 0.432 0.161 0.887** 0.000 0.660* 0.019 0.564 0.056
Cr −0.336 0.285 0.212 0.368 0.362 0.140 0.280 0.378 0.207 0.518 0.539 0.108 −0.177 0.583 0.797** 0.002 0.204 0.524 0.413 0.182
V −0.333 0.291 0.204 0.388 0.462 0.053 0.035 0.914 0.289 0.363 0.609 0.061 −0.392 0.207 0.613* 0.034 −0.122 0.707 0.179 0.578
Ti −0.816** 0.001 0.238 0.312 0.091 0.720 −0.639* 0.025 −0.566 0.055 −0.703* 0.023 −0.814** 0.001 −0.360 0.250 −0.560 0.058 −0.559 0.059 Ca 0.522 0.082 0.389 0.090 −0.022 0.931 0.466 0.127 0.288 0.365 0.663* 0.037 0.611* 0.035 0.820** 0.001 0.727** 0.007 0.590* 0.043 K −0.379 0.224 0.279 0.234 0.436 0.070 0.224 0.484 −0.122 0.706 0.793** 0.006 −0.465 0.127 0.488 0.107 −0.442 0.150 0.253 0.428 Al −0.704* 0.011 0.328 0.158 0.310 0.210 0.150 0.641 −0.398 0.200 0.827** 0.003 −0.448 0.144 0.529 0.077 −0.350 0.265 −0.549 0.065 Si 0.302 0.340 −0.076 0.751 −0.677** 0.002 −0.412 0.184 −0.335 0.287 −0.902** 0.000 −0.925** 0.000 −0.523 0.081 −0.485 0.110 −0.472 0.122 S 0.875** 0.000 0.684** 0.001 0.789** 0.000 0.450 0.142 0.366 0.242 0.963** 0.000 0.963** 0.000 0.947** 0.000 0.673* 0.017 0.664* 0.019
Mg −0.126 0.696 0.187 0.431 0.152 0.546 0.261 0.412 0.174 0.589 0.643* 0.045 0.089 0.782 0.480 0.114 −0.494 0.103 −0.376 0.228
Count (/20)
Sign. correl. 5 2 6 2 1 13 8 12 6 6
Pos. sign. correl. 3 2 4 0 1 10 5 9 4 3
18
4
H.
G.
Sm
it
h
,W.
H.
Bl
ak
e
/
Ge
om
or
p
h
o
lo
gy
2
0
4
(2
0
1
4
)
17
7
–
19
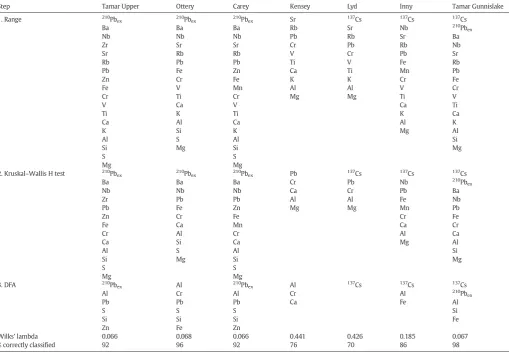
3.2. Tracer conservative behaviour and selection of optimum source fingerprints
The procedure for selection of the optimum sourcefingerprint for each river monitoring location in the Tamar catchment is summarised inTable 3, which lists the tracer properties included at each step. The comparison of the range in tracer concentrations for source and sedi-ment samples resulted in the exclusion of the largest number of proper-ties from the Rivers Kensey, Lyd and Inny. This probably reflects organic enrichment in some suspended sediment samples, which may be relat-ed to the presence of areas of peaty soil in the headwaters of these rivers. Furthermore, these catchments along with the lower Tamar catchment upstream of Gunnislake contain abandoned 19th Century metal mines. This probably accounts for exclusion of Fe, Mn and Zn due to mining contamination of river sediment.
The Kruskal–WallisHtest resulted in the exclusion of Sr, Rb, V, Ti and K for all rivers catchments. This includes 3 alkaline earth and alkali metals (Sr, K and Rb), which may have been expected to vary with soil depth as a function of weathering processes (Tyler, 2004). Examination of box-plots for these elements indicated poor discrimination between cultivated and channel bank soils. Both these sources involve mixing of surface and sub-surface soil, which appears to compromise the discrimination potential for these tracers. In addition, Ti occurs in silicate or oxide minerals that are typically highly resistant to weathering (Dawson et al., 1991; Cornu et al., 1999), which probably explains the poor dis-crimination between surface and sub-surface soils.
The DFA selected the optimum sourcefingerprints for each river catchment based on the tracer properties passing thefirst two steps. The optimumfingerprint comprises the minimum number of properties that provide the greatest discrimination between sources. For the Tamar Upper, Ottery, Carey and Tamar Gunnislake monitoring sites, apparently good source discrimination were achieved based on Wilks' lambdas of 0.066–0.068 and the percentage of correctly classified sources varied from 92 to 98% (Table 3). However, for the remaining Kensey, Lyd and Inny sites, source discrimination was less successful. For the Kensey and Inny, the optimumfingerprint comprised 3 tracer properties each and correctly classified sources in 76 and 86% of cases, respectively (Table 3). For the Lyd only one property passed the DFA (137Cs).
[image:9.595.51.561.392.745.2]The loss of tracer properties during the preceding steps for the Kensey, Lyd and Inny resulted in reduced source discriminatory power. It is apparent that factors specific to these catchments, namely the presence of peaty soils and mining contamination, probably affected the conservative behaviour of some tracers during downstream trans-port. These factors did not affect the other tributaries (Tamar Upper, Ottery and Carey). Sediment sampled at Tamar Gunnislake represents a mixture from all upstream tributaries. However, a sufficient number of tracer properties passed each step to provide reasonable source dis-crimination at this site. Evidently mixing and dilution of sediment from all tributaries lessened the impact of the factors affecting tracer conservative behaviour in several of the tributaries. These results em-phasise the importance of identifying non-conservative behaviour in tracer properties when selecting optimum sourcefingerprints. The con-servative behaviour of tracer properties has received comparatively
Table 3
Tracer properties included at each step in the sedimentfingerprint selection procedure using all source samples. Suspended sediment samples were only used to compare ranges in tracer property data between sources and sediment for each river catchment (step 1).
Step Tamar Upper Ottery Carey Kensey Lyd Inny Tamar Gunnislake
1. Range 210
Pbex 210Pbex 210Pbex Sr 137Cs 137Cs 137Cs
Ba Ba Ba Rb Sr Nb 210
Pbex
Nb Nb Nb Pb Rb Sr Ba
Zr Sr Sr Cr Pb Rb Nb
Sr Rb Rb V Cr Pb Sr
Rb Pb Pb Ti V Fe Rb
Pb Fe Zn Ca Ti Mn Pb
Zn Cr Fe K K Cr Fe
Fe V Mn Al Al V Cr
Cr Ti Cr Mg Mg Ti V
V Ca V Ca Ti
Ti K Ti K Ca
Ca Al Ca Al K
K Si K Mg Al
Al S Al Si
Si Mg Si Mg
S S
Mg Mg
2. Kruskal–Wallis H test 210
Pbex 210Pbex 210Pbex Pb 137Cs 137Cs 137Cs
Ba Ba Ba Cr Pb Nb 210
Pbex
Nb Nb Nb Ca Cr Pb Ba
Zr Pb Pb Al Al Fe Nb
Pb Fe Zn Mg Mg Mn Pb
Zn Cr Fe Cr Fe
Fe Ca Mn Ca Cr
Cr Al Cr Al Ca
Ca Si Ca Mg Al
Al S Al Si
Si Mg Si Mg
S S
Mg Mg
3. DFA 210
Pbex Al 210Pbex Al 137Cs 137Cs 137Cs
Al Cr Al Cr Al 210
Pbex
Pb Pb Pb Ca Fe Al
S S S Si
Si Si Si Fe
Zn Fe Zn
Wilks' lambda 0.066 0.068 0.066 0.441 0.426 0.185 0.067
% correctly classified 92 96 92 76 70 86 98
limited attention in previous studies, despite its importance for source
fingerprinting (Foster and Lees, 2000; Koiter et al., 2013).
3.3. Physical and chemical basis for source discrimination byfingerprint properties
Differences in tracer concentrations between the three sources
re-flect processes differentiating physical and chemical properties of sur-face and sub-sursur-face soils. Channel banks comprised mostly sub-soil material, with inclusion of some surface soil through sampling of the en-tire bank profile. In the Tamar catchment, the sampled bank heights ranged from 0.5 to 1.5 m. Cultivated soils included a mixture of surface and sub-surface soil that had been turned over by ploughing to an ap-proximate depth of 25 cm, whereas pasture soils should have included only surface soil, which was sampled to a depth of 2 cm.
Comparison of tracer properties selected by the statistical procedure for all rivers indicated general coherence in the relative differences be-tween sources for mean and median values (Table 4). Key exceptions were Al, where the mean value for cultivated was less than channel banks, but the reverse was true for medians. For Pb, the mean source value for cultivated exceeded pasture, but this was reversed for me-dians, while cultivated was less than pasture for mean Fe values, but was reversed for medians. In all cases the concentration differences be-tween these source pairs were small, and mean and median values were within uncertainty. However, this indicated that these tracers provided low discriminatory power between these source pairs.
Fallout radionuclides (137Cs,210Pb
ex) are effective sediment source
tracers because of their accumulation in the surface soil and tendency to strongly adsorb tofine particles (Wallbrink and Murray, 1993; He and Walling, 1996). Both radionuclides are gradually transferred down the soil profile by a combination of geochemical diffusion, biotur-bation and elluviation processes (Walling, 2003; Mabit et al., 2008). This results in distinct undisturbed soil depth profiles for these radionu-clides, which peak at or near the soil surface and decline exponentially with depth (Wallbrink et al., 1999). Cultivated soils tend to display a rel-atively uniform activity concentration to the depth of the mixed plough layer, with generally negligible levels below that depth (Walling, 2003).
These patterns were evident in measured137Cs and210Pb
exactivity
concentrations (Table 4). Minimum values occurred in channel bank soil, increased for cultivated soils and reached a maximum in pasture surface soils. Radionuclide concentrations were lower in channel bank samples because these comprised mostly sub-soil material containing negligible activity. Depending on the slope of the bank profile, some
direct contributions of210Pb
exmay have occurred through continuing
fallout, whereas for137Cs bomb-test fallout has ceased and there was
negligible fallout from the 1986 Chernobyl nuclear disaster in south-west England (Walling et al., 1989). In the sampled pasture soils, there was a large range in activity concentrations of 137Cs (7.4–
21.8 Bq kg−1) and210Pb
ex(27–106 Bq kg−1). Besides variability in
fall-out and surface soil redistribution, this probably also reflects previous cultivation of manyfields that were under pasture at the time of sam-pling. The cultivation effect will persist for137Cs in the absence of con-tinued fallout, whereas it will gradually reset for 210Pb
ex with
continuing fallout and down-profile transfer. However, the frequency offield rotation may prevent re-establishment of an undisturbed pas-ture profile. Therefore, fallout radionuclides are likely to provide re-duced precision in the discrimination of pasture versus cultivated surface soils in agricultural areas where pasturefields are periodically cultivated.
Soil geochemical properties may discriminate surface and sub-surface soil on the basis of differences resulting from weathering gradi-ents that vary with soil depth, surface soil contamination or through vegetation decomposition and nutrient cycling in surface soils. Higher concentrations of Al, Cr, Fe, and Zn observed in channel bank sources compared to cultivated or pasture soils could reflect the larger contribu-tion of less weathered sub-surface material, in the absence of a contam-ination signal in surface soils (Dawson et al., 1991; Tyler, 2004; Kříbek et al., 2010; Bini et al., 2011). Si may have been expected to follow a sim-ilar pattern. The lowest concentrations of Si occurred in pasture surface soils, whereas the highest occurred in cultivated soils, which is inconsis-tent with a purely depth-dependent weathering profile. In contrast, pasture soils had the highest concentrations of S and Ca, presumably reflecting the supply to surface soils by atmospheric deposition, vegeta-tion decomposivegeta-tion and nutrient cycling (Evans et al., 1997; Jobbágy and Jackson, 2001, 2004). S exhibited a significant positive relationship with TOC for all source soils (Table 3). Higher values of Pb occurred in pasture and cultivated soils than in channel banks. Differences were small but the higher Pb could reflect atmospheric deposition from an-thropogenic sources (Blake and Goulding, 2002).
[image:10.595.38.552.553.745.2]Principal components analysis (PCA) provides a useful means to an-alyse variance in multi-tracer datasets and reduce dimensionality (D'Haen et al., 2012). In the present study, we used PCA to examine trends in tracer properties selected by the DFA to form the optimum compositefingerprints (Table 3). Score and loading plots are shown for thefirst two principal components for each river monitoring site (excluding the River Lyd) inFig. 3. Combined, thefirst two components
Table 4
Mean and median values for the uncorrected tracer properties selected as part of the optimum compositefingerprint for each catchment. Means are reported with standard errors (SE) and medians with median absolute deviations (MAD). The units are Bq kg−1for the fallout radionuclides (137Cs and210Pb
ex) and mg kg−1for the other tracer properties.
Tracer property Channel bank (n = 20) Cultivated (n = 12) Pasture (n = 18)
137
Cs Mean (SE) 4.9 (0.3) 9.4 (0.6) 11.9 (0.9)
Median (MAD) 4.9 (1.0) 9.6 (1.5) 10.5 (1.9)
210
Pbex Mean (SE) 22.5 (1.5) 29.5 (2.4) 55.1 (4.3)
Median (MAD) 20.9 (3.4) 29.9 (6.2) 52.1 (8.3)
Al Mean (SE) 50,350 (1279) 46,752 (3264) 36,599 (1870)
Median (MAD) 49,118 (2359) 50,065 (6779) 38,193 (4583)
Ca Mean (SE) 2580 (221) 4784 (777) 5431 (590)
Median (MAD) 2404 (530) 4277 (1347) 4661 (882)
Cr Mean (SE) 174 (15) 124 (9.4) 141 (14)
Median (MAD) 157 (21) 129 (21) 130 (31)
Fe Mean (SE) 57,412 (2445) 38,565 (2736) 39,329 (2383)
Median (MAD) 56,918 (5206) 38,738 (3418) 37,310 (6745)
Pb Mean (SE) 113.0 (0.2) 117.0 (3.3) 114.2 (0.4)
Median (MAD) 112.9 (0.5) 113.6 (0.3) 114.5 (0.6)
S Mean (SE) 422 (34) 719 (95) 1473 (97)
Median (MAD) 383 (67) 700 (209) 1544 (254)
Si Mean (SE) 293,123 (3809) 319,961 (6672) 272,229 (7321)
Median (MAD) 291,957 (10867) 316,309 (7406) 270,204 (17624)
Zn Mean (SE) 123 (9.3) 60 (10) 63 (7.0)
Median (MAD) 123 (26) 46 (9.5) 56 (18)
account for between 69 and 91% of the total variance in the source
fingerprint data for the catchments. The PCA score plots highlight the better source discrimination achieved for Tamar Upper, Ottery, Carey and Tamar Gunnislake, in contrast to the Kensey and Inny which have fewer tracer properties. The score and loading plots can be used to examine which tracer properties exerted the largest effect on variance in the data. Thefirst principal component largely repre-sents the difference between channel bank and pasture sources. Dis-crimination between these two sources was dependent on the differences in concentrations of Al, Zn,210Pb
ex,137Cs, S and Ca
be-tween surface and sub-surface soil. The second component tends to capture the difference between pasture and cultivated sources, and
largely corresponds with discrimination by Si, which formed part of thefingerprint for all catchments inFig. 3except the Kensey and Inny. This presumably accounts for the poor discrimination of culti-vated sources for these two catchments.
[image:11.595.48.561.53.402.2]For the successful application of the sourcefingerprinting proce-dure, it is essential that the physical and chemical basis for source discrimination is considered. The results from the Tamar catchment show that difficulties may arise when attempting to discriminate surface soils according to pasture versus cultivated land uses. This can result from alternating land-use histories associated withfield rotation, such that the pasture and cultivated source signals become less distinct (Blake et al., 2012). Typically, channel bank and pasture
Fig. 3.Principal components analysis (PCA) score (left column) and loading (right column) plots of thefirst two principal components (PC1 and PC2) for six river sampling sites (excluding Lyd) in the Tamar catchment.
Table 5
Estimated mean proportional source contributions to monthly suspended sediment samples collected at 6 of the 7 river monitoring sites and the associated mean 95% confidence interval (CI) range and mean goodness offit (GOF) based on the Monte Carlo analysis.
Catchment Cultivated Channel banks Pasture Mean GOF
Meana
95% CI rangeb
Meana
95% CI rangeb
Meana
95% CI rangeb
Tamar Upper 0.01 0.00–0.05 0.52 0.43–0.60 0.47 0.39–0.55 88.4
Ottery 0.00 0.00–0.00 0.40 0.26–0.51 0.60 0.49–0.73 83.7
Carey 0.00 0.00–0.00 0.34 0.23–0.43 0.66 0.57–0.77 81.7
Kensey 0.27 0.00–0.77 0.22 0.07–0.38 0.52 0.02–0.91 79.3
Inny 0.01 0.00–0.16 0.58 0.47–0.67 0.41 0.23–0.51 86.5
Tamar Gunnislake 0.00 0.00–0.00 0.63 0.53–0.72 0.37 0.28–0.47 83.8
a
Suspended sediment load weighting of monthly proportional source contributions would improve accuracy of mean source apportionment results. However, load data was unavailable andflow data (as a surrogate for load) was only available at a few sites. Therefore, un-weighted mean source estimates based on un-mixing of the monthly suspended sed-iment samples are presented for comparison between the sites.
b
The 95% confidence interval ranges represent the mean of the upper and lower bounds for each monthly measurement interval.
[image:11.595.43.561.627.709.2]surface soils may be differentiated based on differences in the con-centration depth profiles of fallout radionuclides (surface elevated) and geochemical properties sensitive to weathering (surface deplet-ed). During source un-mixing, the cultivated source fingerprint could also resemble a mix of these two sources, unless additional properties can be found to distinguish the cultivated source. In the present study, Si provided this additional discrimination, but it did not pass the statistical selection procedure for all catchments.
3.4. Catchment source contributions and uncertainty
Proportional source contributions to monthly suspended sediment samples were estimated for the river monitoring locations across the River Tamar catchment. This excluded the River Lyd where only one tracer passed the statistical selection procedure (Table 3). Source un-mixing used all tracer properties that were selected by the DFA for each river catchment and the model goodness offit (GOF) was calculat-ed for each scalculat-ediment sample and tracer property.
Mean proportional contributions from pasture, cultivated and chan-nel bank sources varied across the six catchments over the 12 month monitoring period (Table 5). Cultivated sources were estimated to con-tribute an apparently minor amount of sediment to all rivers except the Kensey. However, the Kensey had the lowest mean GOF and the largest predicted uncertainty. Coupled with poor discrimination of cultivated sources by the Kenseyfingerprint (Table 3;Fig. 3), the source apportion-ment results for this catchapportion-ment should not be considered reliable. Like-wise, robust source apportionment for the Inny is unlikely due to poor discrimination of the cultivated source (Fig. 3), despite the higher GOF compared to most other sites. GOF should not be misinterpreted as indi-cating the accuracy of source apportionment results because it includes no information on the level of source discrimination achieved by select-ed tracer properties.
The remaining four catchments had mean GOF values of 82–88% and better source discrimination, as reflected in the DFA results and inclu-sion of Si in each compositefingerprint to distinguish cultivated sources. Nonetheless, the range in predicted upper and lower 95% confidence in-tervals for these catchments was from 0 to 0.25 with a mean of 0.14. Source apportionment results indicated that channel bank sources (0.63) dominated suspended sediment export for Tamar Gunnislake, whereas pasture sources (0.60–0.66) dominated in the Carey and Ottery catchments (Table 5). The Tamar Upper catchment received suspended
sediment primarily from channel banks and pasture sources in similar proportions, with an apparently negligible input from cultivated sources.
The absence of a cultivated source signal in the source apportion-ment results for the four catchapportion-ments was unexpected, given that the Tamar catchment contains a significant cultivated area, which includes maize and wheat. The 2007 land cover map indicated 36% of the catch-ment area was arable, while in 2000 the area of arable land was approx-imately 21%. This increase in arable land was almost entirely due to conversion from pasture. On the basis of these land-use data, it seems very plausible that the source un-mixing could have failed to capture a cultivated source input because (i) the rotation offields between pas-ture and cultivation contributed to reduced discrimination between current pasture and cultivatedfields and (ii) the potential for the culti-vated source signature to resemble a mix of pasture and channel bank inputs. Inclusion of Si partly addressed these issues, but it is only 1 tracer out of the 5 or 6 used in source un-mixing for these catchments.
[image:12.595.39.554.84.303.2]Previous published sourcefingerprinting work in the Tamar catch-ment provides a useful context and comparison for the present investi-gation. These studies focused on determining surface and sub-surface source contributions tofine sediment stored in gravels on the channel bed (Walling et al., 2003). Sediment sampling locations were located in the Inny, Ottery, Lyd and the upper main channel of the Tamar. A re-peat study byCollins et al. (2010c)used the same channel bed sampling locations with the aim of identifying the effect of riparian fencing on channel bank sediment contributions. Only mean source contributions were reported in both studies for the whole Tamar, with initial surface and sub-surface inputs of 0.69 and 0.31 (Walling et al., 2003) and subse-quent inputs of 0.84 and 0.16 (Collins et al., 2010c). Differences in the method and timing of sampling along with presentation of data hinder direct comparison of previous work with the present study. Nonethe-less, channel bank source contributions (0.40–0.52) for the Tamar Upper and Ottery sites are much higher than the overall Tamar mean value of 0.16 reported byCollins et al. (2010c), which is inconsistent with the claim that riparian fencing resulted in a meaningful reduction in channel bank sediment inputs (from 0.31 to 0.16). Attributing changes in proportional source contributions to the effect of catchment management actions or disturbances is tenuous in the absence of sedi-ment load data or an untreated control catchsedi-ment (Smith et al., 2011). The apparent reduction in proportional channel bank inputs in these previous studies could also be explained by an increase in hillslope
Table 6
Sensitivity analysis of the effect of changes to data treatment on mean monthly proportional source contributions for four of the river catchments that were selected on the basis of reasonable source discrimination (DFA and PCA) and model performance (GOF).
Run Description of inputs to mixing model
Tamar Upper Ottery Carey Tamar Gunnislake Max.
absolute difference Cultivated Channel
bank
Pasture Cultivated Channel bank
Pasture Cultivated Channel bank
Pasture Cultivated Channel bank
Pasture
Mean monthly proportional source contributions 1 Uncorrected tracers in
optimumfingerprint: mean source values
0.00 0.53 0.47 0.00 0.39 0.61 0.00 0.31 0.69 0.00 0.63 0.37
2 Uncorrected tracers in optimumfingerprint: median source values
0.00 0.49 0.51 0.00 0.40 0.60 0.00 0.28 0.72 0.00 0.56 0.44
3 Tracers in optimumfingerprint: mean source values with SSA correction only
0.00 0.52 0.48 0.00 0.37 0.63 0.11 0.26 0.63 0.08 0.57 0.35
4 Tracers in optimumfingerprint: mean source values with SSA and TOC corrections
0.02 0.37 0.61 0.00 0.17 0.83 0.00 0.17 0.83 0.00 0.18 0.82
Differences between mean monthly proportional source contributions 2-1 Mean vs. median source values
without corrections
0.00 −0.04 0.04 0.00 0.01 −0.01 0.00 −0.03 0.03 0.00 −0.07 0.07 0.07
3-1 Uncorrected vs. SSA corrected mean source values
0.00 −0.01 0.01 0.00 −0.02 0.02 0.11 −0.05 −0.06 0.08 −0.06 −0.02 0.11
4-1 Uncorrected vs. SSA and TOC corrected mean source values
0.02 −0.16 0.14 0.00 −0.22 0.22 0.00 −0.14 0.14 0.00 −0.45 0.45 0.45