Comparing litter dynamics of
Phragmites australis
and
Spartina alterniflora
in a sub-tropical Chinese estuary: contrasts in early and late decomposition
1
L.H. Zhanga C. Tonga ,* R. Marrsb T.E. Wanga W.J. Zhanga C.S. Zenga
a Centre of Wetlands in Sub-tropical Regions, Key Laboratory of Humid Sub-tropical
Eco-geographical Process of Ministry of Education, School of Geographical Sciences, Fujian
Normal University, Fuzhou 350007, China
b School of Environmental Sciences, University of Liverpool, Liverpool L69 3GP, UK
Abstract
Litter decomposition in emergent macrophytes can be considered a two-phased decomposition process (standing phase and then a surface one), but little is known about their relative importance. Here, we mimicked this two-phase process and examined the decomposition and nutrient dynamics of three structural components (leaves, flowers, stems) of two common emergent macrophytes in an experimental study in the Min River estuary, southeast China. The two species were Phragmites australis, a native species, and Spartina alterniflora an invasive one. Decomposition was slower in the standing phase compared to the surface phase for most structural components of both species. In the standing phase, the exponential breakdown rates (k-value) for all structural components of S. alterniflora were much greater than the corresponding values for P australis, whereas, in the surface phase, S. alterniflora mostlyhad lower k-values than P. australis. The k-values in different components of P. australis and S. alterniflora ranged from 0.00099 to 0.00157 d-1 and 0.00193 to 0.00384 d-1 in the standing phase respectively and from 0.00272 to 0.00966 d-1 and 0.00186 to 0.00879 d-1 in the surface phase for the two species respectively. Over the 210 day study, the litter carbon concentrations in three structural components of P. australis fluctuated considerably compared to S. alterniflora. The variations of nitrogen concentration in flower and stem litter in both species experienced a similar pattern throughout the experimental period, in the surface phase, although the nitrogen concentration increased both in the two species. Litter phosphorus concentration showed a completely different pattern between the two species throughout.
Keywords Aerial position decomposition· surface position decomposition· nitrogen
Introduction
Decomposition of plant litter and its consequences for litter accumulation are important components of ecosystem function, and as such, it must play a crucial role in the global carbon balance (Tuomi et al. 2009). Decomposition is the process through which organic matter is converted into forms that primary producers can re-use (Park and Cho 2003), and can potentially limit ecosystem productivity. It is, therefore, important to understand nutrient cycling through its complete pathway; from senescence of plant material to decaying plant detritus in the soil.
Wetlands represent the largest component of the terrestrial biological carbon pool (Dixon and Krankina 1995). In spite of this most decomposition studies have been performed in terrestrial systems, where the pre-dominance of aerobic conditions generally results in rapid decomposition of plant debris. In wetlands, however, decomposition occurs at a significantly lower rate, due to anaerobic conditions through the soil profile brought about by flooding at different frequencies and lengths of duration (Debusk and Reddy 2005). Past studies on litter decomposition in wetlands have been mainly focused at the soil surface (Liao et al. 2010; Guo et al. 2008; Song et al. 2011). However, for emergent macrophytes the abscission and collapse of leaf and culms to the sediment surface does not occur immediately after senescence/death, and considerable microbial colonization and subsequent mineralization of standing emergent macrophyte litter may occur before it arrives at the sediment surface (Kuehn and Suberkropp 1998). Little information is available on the relative importance of litter decomposition whilst it remains standing within the vegetation (spring- and early-summer period) relative to when it becomes incorporated into the surface vegetation (autumn- and-winter period) in wetlands.
2002), but environmental factors (temperature, soil moisture content, availability of nutrients) have also been shown to be important (Debusk and Reddy 2005). For estuarine marshes, the frequency and duration of inundation is a key environmental factor as it provides differential conditions of inundation with saline, brackish or fresh water. This frequent inundation will affect the temperature regimes the plants and decomposers experience in both water and air; and hence will affect decomposition in some way. In addition, emergent macrophytes are exposed to differential inundation duration; the lower parts of the stem are submerged for a greater period than the upper parts; and little is known about how decomposition varies with respect to stem height.
(S. alterniflora).
Methods
The study site was located at the Shanyutan wetland (Longitude, 119°34′12″–119°40′40″; Latitude, 26°00′36″–26°03′42″) on the Min River estuary, southeast China. The estuary has
typical semi-diurnal tides, a mean annual temperature of 19.6 oC, and a mean annual precipitation of 1346 mm. Within this wetland, two adjacent communities (25 m apart) were selected for litter collection and the decomposition experiment: one dominated by P. australis
and the other by S. alterniflora. The height range for both species is typically between 160–180 cm.
Sample collection and preparation
In December 2009, at the end of the growing season when natural senescence would start, standing dead litter of both P. australis and S. alterniflora were collected to provide the test material for evaluating litter decomposition and nutrient release rates. In the laboratory, these samples were first washed with filtered stream water and then with deionized water to remove sediment and invertebrates, and then separated into different plant structural components (flower, leaf and stem). The stem was further subdivided depending on the length of the standing dead stem, i.e. into 0-30, 30-80, 80-130, 130-180 cm sections; these were then cut into 10 cm long pieces. All material was then air-dried for several weeks and then dried to a constant weight at 70oC to ensure a constant starting material (following Kuehn et al. 1999;
two phases to reflect the standing and dead phases of decomposition as follows:
Phase 1: Standing-phase decomposition. On March 12, 2010, at the start of the growing season, 2 m tall canes were positioned in the centre position within each plant community. Litter-bags were tied to these canes at the positions within the height range of the natural standing dead litter. Litter-bags of each type were retrieved at 0 (no decomposition), 15, 30, 45, 60, 75 and 90 days.
Phase 2: Surface-phase decomposition. On June 12, 2010, mid-way through the growing season, the remaining litter-bags were transferred to random positions on the sediment-litter layer of the marsh. Litter bags of each type were periodically retrieved at 30 day intervals from the wetland, i.e. 120, 150, 180 and 210 days after the start of the experiment.
After retrieval and transfer to the laboratory the litter remaining in all bags was carefully separated, washed and dried as described above. Thereafter, the total carbon (TC), total nitrogen (TN) and total phosphorus (TP) concentrations were determined on each sample. The C and N contents of plants and litter were determined using a Vario EL III Elemental Analyzer
(analytical error ≤0.3%), while P concentrations of all litter samples were determined by molybdate-ascorbic acid colorimetry (digested by H2SO4-HClO4), P concentration was
measured colorimetrically at 700 nm after reaction with molybdenum blue(analytical error ≤
5 %) (Watanabe and Olsen 1965).
Statistical Analysis
Regression analysis (function ‘lm’, R Development Core Team, 2011) was used to assess the relationship across the entire experiments; here simple linear and second-order polynomial equations were fitted. The proportion of mass remaining at the end of the experiment (p210)
and the time for 95% of the starting litter dry mass to decompose were also calculated (t0.95)
(90-210 days) using the simple exponential model (eqn 1) :
loge(Lt/L0) =﹣kt eqn 1
where Lt is the litter dry mass remaining after t day decomposition, L0 is the litter dry mass at
the start of each phase, K is the decomposition rate or exponential breakdown coefficient and t is the duration (in days) of decomposition. For phase 2, L0 was set to the mean value of the
mass in the 90-day samples (end of Phase 1, start of Phase 2). An analysis of covariance was also performed to test for differences in k values (a) between the two phases for each plant part for each species, and (b) between the plant parts of each species over the entire period and in the Standing and Surface phases separately. Here the significant differences in k-slopes are reported.
Results
Dry mass remaining
There were clear differences between species and structural components throughout the experimental period (Fig. 1, Table 1). Over the entire period, decomposition was faster in flowers and leaves compared to stems. For flowers and leaves, the change in dry matter through time were similar in both species (Fig. 1); 25% of flower litter and 22% of leaf litter from P. australis remained at the end of the experiment compared to 27% and 16% for S.
alterniflora, respectively (Table 1). The amount of stem material remaining at the end of the experiment was slighter higher for P. australis (range 48-67%) compared to S. alterniflora (range 42-55%). The lowest part of the stem for both species had the slowest decomposition rate overall (Table 1).
Decomposition was slower in the standing phase for structural components of P. australis, although the flowers and leaves showed a faster rate than the stems, reducing dry matter to 78-80% compared to 87-90% for stems (Table 1). However, for S. alterniflora the dry matter loss in all components in the standing phase were significantly greater than for P. australis (F1, 10 = 33.86, P < 0.01), 67-72% for flowers and leaves and 68-82% in stems (Table 1).
Litter decomposition rate
These conclusions are borne out by the k-values for each species/structural component (Table 2a). In the standing phase, the k-value for all structural components of S. alterniflora is significantly larger than the corresponding value for P australis (F1, 10 = 28.36, P < 0.01). In the standing phase the rank order for P. australis was leaves > flower > stem (80-130 cm) > stem (130-180 cm) > stem (30-80 cm) > stem (0-30 cm), whereas for S. alterniflora the order changed slightly to stem (0-30 cm) > leaves > stem (30-80 cm) > stem (80-130 cm) >
In the surface phase, the k-values were much greater for the leaves and flowers of P. australis compared to the stems, and the rank order of stems was stem (80-130 cm) > stem (30-80 cm) > stem (130-180 cm) > stem (0-30 cm). In this second phase, the leaf and flower components of S. alterniflora had lower k-values than P. australis but they were in the same order of magnitude (Table 2a). K-values for the stems of S. alterniflora were largest in the tallest part of the stem (stem (130-180cm) and then reduced with height. Within the stem components, S. alterniflora had lower k-values in phase 2 than P. australis, apart from the 130-180 cm fraction. The k-values among plant parts of S. alterniflora were not significantly different from that of P. australis in the surface phase (P > 0.05).
For P. australis there were significantly faster decomposition rates in the Surface phase compared to the Standing phase for all plant parts and the stems combined (negative coefficients, all P < 0.001, Table 2a). S. alterniflora, on the other hand, showed similar responses for stem, leaf and one stem fragment (130-180 cm), but two other stem fragments showed significantly faster rates in the Standing phase (0-30cm and 30-80cm) (positive coefficients, all P<0.001, Table 2a). The stem fragments between 80-130 cm showed no significant difference in the two phases.
Results from the analysis of covariance illustrated importance differences between the two phases. Over the entire period there were significant between-species differences only for three of the stem sections (Table 2b) with faster decomposition for S. alterniflora compared to
P. australis (negative slope). However, when decomposition rate in the Standing phase were considered, all plant parts showed significant between-species negative differences in slopes. This indicates that S. alterniflora had a faster decomposition rate than P. australis (all P
faster than S. alterniflora; there were no significant difference for flowers, leaves or other stem fractions.
Dynamics of litter nutrient concentration
The best-fit relationships between elemental concentration (%) and time are shown in Table 3. During the 210 days decomposing period, the litter C concentrations in the three structural components of P. australis all showed a more fluctuating process compared with S. alterniflora. C concentrations in flower and stem litter of P. australis reached the minimum values at 150 d, and then increased thereafter. The C content decreased to 94 % of the initial value for P. australis flower litter after the standing phase, and then it increased to 109 % of initial value of phase 2 after 120 days surface decomposition (Fig. 2). C concentration in leaf litters of P. australis was significantly lower than other two components over the whole experimental period (F5, 60 = 8.20, P< 0.001). C concentrations in the S. alterniflora flower litter demonstrated little variation. However, C concentrations in its leaf litter showed a slow successive increase in the both phases 1. For the stem litter, C concentrations increased in phase 1 and then remained an almost unchangeable process in phase 2. C concentration in leaf litters of S. alterniflora was also significantly lower than other two components over whole
experimental period(F5, 60 = 18.68, P< 0.001). During the decomposition period, C
concentration of S. alterniflora litter was significantly higher than those of corresponding
components of P. australis(for all, P < 0.05).
phase compared to the surface phase, whereas for S. alterniflora, the leaf litter N concentration reduced in the standing phase, then increased during the surface phase (Fig. 3).
By the end of the experiment, the litter N concentration in the three structural components increased to between 112 and 199% of the initial value of phase 2 for P. australis, and between 171-234% for S. alterniflora, respectively. N concentration in stem litter of P. australis was significantly lower than other two components over the whole experimental
period(F5,60 = 102.59, P< 0.001). N concentration in stem litter of S. alterniflora was also
lowest in the three components over whole experimental period(F5,60 = 35.91, P < 0.001),
however there was no significant difference in different sections. We also found the flower litter of S. alterniflora had a lower N concentration than that of P. australis throughout the experiment (F1, 20 = 169.50, P < 0.001).
Litter P concentration showed a completely different change pattern between the two species (Fig. 4). There was a fall in litter P concentration for P. australis in the first 15 days, and then an increased in Phase 2. P concentration of S. alterniflora was slowly increased at first, and then decreased in the following decomposition phase, at 150 d, the P content fell to its lowest values.
Flower litter P concentration of P. australis was significantly greater than that in other
two components over the whole experimental period(F5,60 = 11.64, P< 0.001). For S.
alterniflora, flower and leaf litter P concentration were significantly higher than in stems (F5,60 = 73.96, P< 0.001). During decomposition, leaf litter P concentration in S. alterniflora
was significantly greater than that of P. australis (F1,20 =20.26, P< 0.001, but flower concentration was significantly lower (F1,20 = 6.85, P< 0.05).
Dynamics of C/P, N/P in the two species differ greatly (Fig. 5). C/P and N/P in P. australis
rose very quickly after 15 days, and decreased to 60 days but changed little thereafter. C/P in
S. alterniflora changed little in standing decay period but in Phase 2, C/P of S. alterniflora
litter increased until 150 d, and then decreased afterwards. C/N, C/P in the flower and leaf litter of both P. australis and S. alterniflora were significantly lower than stems during the whole decomposition (P < 0.01), but N/P in the three structural components was not significant different (P > 0.05). C/N in the flower and stem litter of P. australis was significantly lower than that in S. alterniflora during the decomposition (P< 0.01), but C/P and N/P in the leaf litter of P. australis were significantly greater than that in S. alterniflora (P
< 0.05).
Discussion
Data on litter decomposition rates show considerable variation in estuarine habitats (Windham
structural part (Hypothesis 2 accepted) and (c) vertical height above the soil surface (Hypothesis 3 accepted). Moreover, decomposition rate was related to the resource quality and specific (Hypothesis 4 and 5 accepted).
At present, there was no a consensus conclusion on whether the invasive species have the same impact on the litter decomposition rate in wetland ecosystems invaded. Invasive
Lythrum salicaria Linn and native Typha latifolia Linn in freshwater marsh in central New York State, had lost similar quantities of litter mass (20-25%) after 1 year (Welsch and Yavitt 2003), however, Vinton and Goergen (2006) found that the invasive Bromus inermis Leyss with a lower C/N ratio had a higher decomposition rate than native species Panicum virgatum
Linn in North America. In the United States, invasive P. australis initially decomposed more slowly (37-63% remaining) than those of native S. alterniflora (23-53% remaining), but after two years, decay was comparable (8-40% remaining for both species) (Windham et al. 2004). Our results indicated invasive species (S. alternifolia) had higher decomposition rates than native species (P. australis) in the standing decomposition, no difference in soil surfaces.The higher litter decomposition rate of introduce S. alternifolia may be caused by its ecophysiological properties. Liao et al. (2008) found that S. alternifolia had a significantly larger net primary production and total litter mass to the standing position than P. australis. Additionally, substantial epiphytic N2 fixation occurred in standing dead shoots of S. alternifolia, which attributed to a higher litter quality (i.e. higher N concentration), increased the rate of litter decay.The higher rates of S. alterniflora may be one reason for the success of this invasive species.
Standing versus surface decomposition
Valiela et al. (1985), for example, demonstrated a three-phased decomposition process after the litter collapsed to the sediment surface: (1) the early phase lasting less than a month when 5-40% of the litter was lost, (2) a slower phase lasting up to a year when an additional 40-70% may be lost. (3) a very low phase lasting an additional year after which as little as 10% remains. Our study confirmed considerable decomposition weight loss species in the standing phase for both species, i.e. before the material is transferred to the sediment surface. Growing evidence has established that litter is colonized and degraded by fungal assemblages that these microorganisms can contribute to plant litter decomposition before its entry into the aquatic environment (Kuehn and Suberkropp, 1998). Data also provided compelling evidence that microbial decomposition of plant litter occur in the aerial attached-dead phase in most wetlands (Kuehn et al. 2004). Moreover, humidity in the stands of coastal marshlands is high, microbial decomposers that have adapted to the moist conditions can relatively easily colonize the aerial litter (Liao et al. 2008). The decomposition rate in the standing phase was, however, slower than the surface phase for all three structural components (flowers, leaves and stems) tested here for both P. australis and S. alterniflora. One of the major constraints to decomposition rate is the moisture content and water availability (Sun et al. 2008), and clearly this will regulate microbial activities in the standing phase (Kuehn and Suberkropp 1998), invertebrate might also be lower (Ruppel et al. 2004; Cragg and Bardgett 2001). In this study, tidal water submerged the litter for ten to fifteen times during a month, periodic inundation can speed the decomposition rate of the materials on the sediment surface.
Decomposition rates of the different plant structural parts
of P. australis decayed somewhat (<20%) and leaves lost about 50% in the first six months. Samiaj and Bärlocher (1996) also found that S. alterniflora leaves in a saltmarsh of Canada lost over 60% of their mass in 4 months, which is similar to our findings. The higher initial N concentration (Fig. 3) and lower ratios of the initial C/N (Fig. 5) in flower and leaf than stems may explain the faster decomposition rate. The result is of fundamental importance for nutrient cycling in such estuarine habitats as clearly the decomposition flux of C and other nutrients will be a function of the pool size of each fraction × the decomposition constant for each fraction. C fluxes from the flowers, leaves and stems of P. australis were estimated to be 1.43, 1.24 and 0.83 mg g-1 d-1 respectively and for leaves and stems were lower than comparable rates for S. alterniflora (1.40, 1.44, 0.91 mg g-1 d-1). For the four stem sections the C fluxes were the litter loss flux of C from the stems was the mean of the litter loss flux of C from the four height strata (surface to top) were 0.59, 0.86, 1.02 and 0.85 mg g-1 d-1 for P. australis, compared to 0.85, 0.84, 0.91 and 1.05 mg g-1 d-1 for S. alterniflora. Irrespective, differences in breakdown patterns of flowers, leaves and stems suggested that they should be studied separately, data on comparable masses of each of the components is needed to develop a whole ecosystem budget.
The role of litter resource quality
than that of native species P. australis (17.2-114.0) during the standing phase (P<0.01). However, the decomposition rates of all three structural components of the invasive S. alterniflora were faster than the native P. australis. The differences may be explained by the dynamics of C/P and N/P. The values of C/P and N/P in P. australis litter increased quickly (C/P> 200; N/P> 16) in the first 15 days (Fig. 5). Brinson’s suggestion of a C/P ratio of 200 for litter to decompose completely (Brinson 1977), and thresholds of foliar N/P ratios were found to be < 14 for N limitation and > 16 for P limitation (Fenn et al. 1998; Tessier and Raynal 2003). Based on these thresholds it may be inferred that decomposition of P. australis
litter was limited by P supply. On the other hand, decomposition rates negative correlations with lignin content (Chimney and Pietro, 2006), the higher lignin concentration in the litter of
P. australis could account for its lower decomposition rates (Liao et al. 2008).
Biomass of P. australis litter which was only related to carbon concentration showed little change during the standing phase, but thereafter a rapid decline in the early stages of the surface phase followed by an increase. It is possible that the C losses were due to leaching from the litter on the sediment surface as has been demonstrated for many estuarine macrophytes where considerable amounts of labile DOC can be leached to the water column when submerged (Twilley et al. 1986). The later increase in C concentration may be associated with an increase the proportion of lignin in the remaining litter (Davis III et al. 2003), and lignin is much more recalcitrant than other structural polymers, such as hemicellulose and cellulose(Chimney and Pietro, 2006). The N concentration was also identified as significant for the flower fraction but essentially this element followed the same pattern as the C concentration.
leaves, declined through the standing phase followed by an increase to above starting values at the end of the process and stems increase throughout. Wrubleski et al. (1997) reported similar initial N responses during decomposition of macrophyte roots/rhizomes through leaching and mass loss and Köchy and Wilson (1997) suggested that nutrient immobilization/ loss depended on the litter quality (C/N and C/P) and nutrient availability in the surrounding environments. The loss of N from litter during early decomposition is likely a result of a higher initial N concentration and a lower initial C/N ratio (Parton et al. 2007), and our study suggested that N start to lost from the litter at C/N ratios of 16.6:1 to 39.9:1 (P. australis) and 24.7:1 to 64.3:1 (S. alterniflora) as decomposition proceeds, lower than the ratio reported in the forests in Canada (Moore et al. 2006). Microbial communities growing on dead litter surfaces may also contribute to N budgets via atmospheric nitrogen fixation (Moisander et al. 2005) and flooding increased microbial mineralization, may regenerate the immobilized nitrogen in the litter decay (Rice and Tenore 1981).
As the original litters had a large range in C/P ratios, the patterns of P loss or retention are more variable than for N (Moore et al. 2006). In Min River estuary, P concentration showed a fluctuating sinusoidal response for all three fractions with an increase or stasis during the standing phase followed by a decline and subsequent increase towards the end of the process.
Twilley et al. (1986)considered that high P leaching from estuarine macrophytes may be
activities, causing P to release from the litter at all times, which is different from our study. Underlying mechanisms and issues related to dynamic of P content during the decomposition of litter should be examined in future studies.
Conclusions
Acknowledgements
We thank Wei-qi Wang and Bao-xia Wang for field assistance. This work was financially supported by the National Science Foundation of China (Grant No: 31000262 and 41071148) and the Creative Team Program of Fujian Normal University. We would sincerely like to thank two anonymous reviewers for their valuable comments and suggestions, and especially the editor in chief of Prof. J. vermaat for his very valuable comments and careful corrections on our manuscript that have improved the manuscript greatly.
References
Álvarez,J.A., Bécares, E., 2006. Seasonal decomposition of Typha latifolia in a free-water surface constructed wetland. Ecol. Eng. 28, 99-105.
Berg, B., McClaugherty, C., 2008. Plant litter decomposition, humus formation, carbon sequestration. Springer, New York. 115-119.
Brinson, M.M., 1977. Decomposition and nutrient exchange of litter in an alluvial swamp forest. Ecol. 58, 601–609.
Chimney, M.J., Pietro, K.C., 2006. Decomposition of macrophytes litter in a subtropical constructed wetlands in south Florida (USA). Ecol. Eng. 27, 301–321.
Conner, W.H., Day, J.W., 1991. Leaf litter decomposition in three Louisiana freshwater forested wetland areas with different flooding regimes. Wetlands 11, 303–312.
Cragg, R.G., Bardgett, R.D., 2001. How changes in soil faunal diversity and composition within a trophic group influence decomposition processes. Soil Biol. & Biochem. 33, 2073–2081.
Debusk, W.F., Reddy, K.R., 2005. Litter decomposition and nutrient dynamics in a phosphorus enriched everglades marsh. Biogeochemistry 75, 217–240.
Deng, Z.F., An, S.X., Zhi, Y.B., Zhou, Z.F., Chen, L., Zhao, Z.J., 2006. Preliminary studies on invasive model and outbreak mechanism of exotic species, Spartina alterniflora (in Chinese). Acta Ecol. Sinica 26, 2678–2686.
Dixon, R.K., Krankina, O.N., 1995. Carbon sequestration in the biosphere: Springer, Berlin Heidelberg. 153-179.
Enríquez, S., Duarte, C.M., Sand-Jensen, K., 1993. Patterns in decomposition rates among photosynthetic organisms: the importance of detritus C:N:P content. Oecol. 94, 457–471. Fenn, M.E., Poth, M.A., Aber, J.D., Baron, J.S., Bormann, B.T., Johnson, D.W., Lemly, A.D.,
McNulty, S.G., Ryan, D.F., Stottlemyer, R., 1998. Nitrogen excess in North American ecosystems: predisposing factors, ecosystem responses, and management strategies. Ecol. Appl. 8, 706–733.
Gessner, M.O., 2000. Breakdown and nutrient dynamics of submerged Phragmites shoots in the littoral zone of a temperate hardwater lake. Aquat. Bot. 66, 9-20.
Guo, X.L., Lü, X.G., Tong, S.Z., Dai, G.H., 2008. Influence of environment and substrate quality on the decomposition of wetland plant root in the Sanjiang Plain, Northeast China. J. Envi. Sci. 20, 1445–1452.
Köchy, M., Wilson, S.D., 1997. Litter decomposition and nitrogen dynamics in Aspen forest and mixed-grass prairie. Ecol.78, 732–739.
Kuehn, K.A., Gessner, M.O., Wetzel, R.G., Suberkropp, K., 1999. Decomposition and CO2
evolution from standing litter of the emergent macrophyte Erianthus giganteus. Microb. Ecol. 38, 50–57.
Kuehn, K.A., Suberkropp, K., 1998. Decomposition of standing litter of the freshwater emergent macrophyte Juncus effusus. Fresh. Biol. 40, 717–727.
Lee, A.A., Bukaveckas, P.A., 2002. Surface water nutrient concentrations and litter decomposition rates in wetlands impacted by agriculture and mining activities. Aquat. Bot. 74, 273–285.
Liao, C.Z., Luo, Y.Q., Fang, C.M., Chen, J.K., Li, B., 2008. Litter pool sizes, decomposition, and nitrogen dynamics in Spartina alterniflora-invaded and native coastal marshlands of the Yangtze Estuary. Oecol. 156, 589–600.
Liao, C.Z., Tang, X.P., Cheng, X.L., Li, B., Luo, Y.Q., 2010. Nitrogen dynamics of aerial litter of exotic Spartina alterniflora and native Phragmites australis (in Chinese). Biodiv. Sci. 18, 631–637.
Moisander, P.H., Piehler, M.F., Paerl, H.W., 2005. Diversity and activity of epiphytic nitrogen-fixers on standing dead stems of the salt marsh grass Spartina alterniflora. Aquat. Microb. Ecol. 39, 271–279.
Moore, T.R., Trofymow, J.A., Prescott, C.E., Fyles, J., Titus, B.D., 2006. Patterns of carbon, nitrogen and phosphorus dynamics in decomposing foliar litter in Canadian forests. Ecosystems 9, 46–62.
Newell, S.Y., 1993. Decomposition of shoots of a salt-marsh grass: methodology and dynamics of microbial assemblages. Adv. Microb. Ecol. 13, 301–326.
Olson, J.S., 1963. Energy storage and the balance of producers and decomposers in ecological systems. Ecol. 44, 322–331.
Ozalp, M., Conner, W.H., Lockaby, B.G., 2007. Above-ground productivity and litter decomposition in a tidal freshwater forested wetland on Bull Island, SC, USA. Forest Ecol. & Manag. 245, 31–43.
different environments of the Paraná River River floodplain. Hydrobiologia 411, 45–51. Parton, W., Sliver, W.L., Burke, I.C., Grassens, L., Harmon, M.E., Currie, W.S., King, J.Y.,
Adair, E.C., Brandt, L.A., Hart, S.C., Fasth, B., 2007. Global-scale similarities in nitrogen release patterns during long-term decomposition. Science 315, 361–364.
Park, S., Cho, K.H., 2003. Nutrient leaching from leaf litter of emergent macrophyte (Zizania latifolia) and the effects of water temperature on the leaching process. Korean J. Biol. Sci. 7, 289–294.
R Development Core Team., 2011 R: A language and environment for statistical computing. R Foundation for Statistical Computing, Vienna, Austria.
Rice, D.L., Tenore, K.R., 1981. Dynamics of carbon and nitrogen during the decomposition of detritus derived from estuarine macrophytes. Estuarine, Coastal & Shelf Sci. 13, 681–690. Ruppel, R.E., Setty, K.E., Wu, M.Y., 2004. Decomposition rates of Typha spp. in northern
freshwater wetlands over a stream-marsh-peatland gradient. Scientia Discipulorum 1, 26–37.
Samiaji J, Bärlocher F. 1996. Geratology and decomposition of Spartina alterniflora Loisel in a New Brunswick saltmarsh. J. Exp. Mar. Bio. & Ecol.201, 233–252.
Schilling, E.B., Lockaby, B.G., 2006. Relationships between productivity and nutrient circulation within two contrasting southeastern US floodplain forests. Wetlands 26, 181–192.
Song, C.C., Liu, D.Y., Yang, G.S., Song, Y.Y., Mao, R., 2011. Effect of nitrogen addition on decomposition of Calamagrostis angustifolia litters from freshwater marshes of Northeast China. Ecol. Eng. 37, 1578–1582.
SPSS. 2012. Version 13.0. Statistical Program for Social Sciences, SPSS Inc.,Chicago, IL, USA.
Chinese). Env. Sci. 29, 2081–2093.
Sun, Z.G., Mou, X.J., Liu, J.S., 2012. Effects of flooding regimes on the decomposition and nutrient dynamics of Calamagrostis angustifolia litter in the Sanjiang Plain of China. Environ. Earth Sci. 66, 2235–2246.
Tessier, J.T., Raynal, D.J., 2003. Use of nitrogen to phosphorus ratios in plant tissue as an indicator of nutrient limitation and nitrogen saturation. J. Appld Ecol, 40, 523–534.
Tuomi, M., Thum, T., Järvinen, H., Fronzek, S., Berg, B., Harmon, M., Trofymow, J.A., Sevanto, S., Liski, J., 2009. Leaf litter decomposition - estimates of global variability based on Yasso07 model. Ecol. Model. 220, 3362–3371.
Twilley, R.R., Lugo, A.E., Patterson-Zucca, C., 1986. Litter production and turnover in basin mangrove forests in southwest Florida. Ecol. 67, 670–683.
Valiela, I., Teal, J.M., Allen, S.D., Etten, R.V., Goehringer, D., Volkmann, S., 1985. Decomposition in salt marsh ecosystems: the phases and major factors affecting disappearance of above-ground organic matter. J. Exp. Mar. Biol. & Ecol. 89, 29–54.
Vinton, M.A., Goergen, E.M., 2006. Plant-soil feedbacks contribute to the persistence of
Bromus inermis in tallgrass prairie. Ecosystems 9, 967–976.
Villar, C.A., de Cabo, L., Vaithiyanathan, P., Bonetto, C., 2001. Litter decomposition of emergent macrophytes in a floodplain marsh of the Lower Paraná River. Aquat. Bot. 70, 105–116.
Watanabe, F.S., Olsen, S.R., 1965. Test of an ascorbic acid method for determining phosphorous in water and NaHCO3 extracts from soil. Proc. Soil Sci. Soc. Am. 29,
677–678.
Welsch, M., Yavitt, J.B., 2003, Early stages of decay of Lythrum salicaria L. and Typha latifolia L. in a standing-dead position. Aquat. Bot. 75, 45–57.
emergent macrophyte roots and rhizomes in a northern prairie marsh. Aquat. Bot. 58, 121–134.
Windham, L., Weis, J.S., Weis, P., 2004. Metal dynamics of plant litter of Spartina alterniflora and Phragmites australis in metal-contaminated salt marshes. Part 1: Patterns of decomposition and metal uptake. Environ. Toxicol. & Chem. 23, 1520-1528.
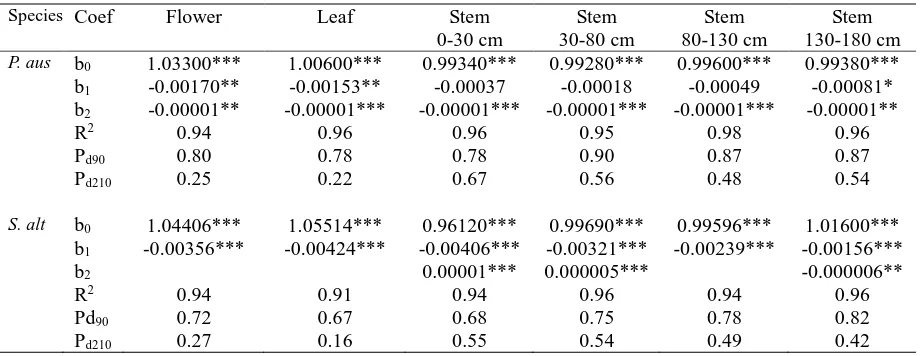
Table 1 Overall change in dry matter of different structural components of Phragmites australis (P. aus)
and Spartina alterniflora (S.alt) in the Min River estuary, south-east China – both the standing and surface phases of decomposition are combined. Dry matter was expressed as a proportion of the initial starting
mass. Parameters of the regression equations fitted in Fig. 1 are presented. In most cases a second-order
polynomial was used, but where the second-order term was not significant a simple linear regression was
used. The proportion of the initial mass left at the end the standing phase (P90) and at the end of the surface
phase (P210). Significance denoted: * = P<0.05, **= P<0.01, ***= P<0.001.
Species es
Coef Flower Leaf Stem
0-30 cm
Stem 30-80 cm
Stem 80-130 cm
Stem 130-180 cm
P. aus b0 1.03300*** 1.00600*** 0.99340*** 0.99280*** 0.99600*** 0.99380***
b1 -0.00170** -0.00153** -0.00037 -0.00018 -0.00049 -0.00081* b2 -0.00001** -0.00001*** -0.00001*** -0.00001*** -0.00001*** -0.00001**
R2 0.94 0.96 0.96 0.95 0.98 0.96
Pd90 0.80 0.78 0.78 0.90 0.87 0.87
Pd210 0.25 0.22 0.67 0.56 0.48 0.54
S. alt b0 1.04406*** 1.05514*** 0.96120*** 0.99690*** 0.99596*** 1.01600***
b1 -0.00356*** -0.00424*** -0.00406*** -0.00321*** -0.00239*** -0.00156***
b2 0.00001*** 0.000005*** -0.000006**
R2 0.94 0.91 0.94 0.96 0.94 0.96
Pd90 0.72 0.67 0.68 0.75 0.78 0.82
Table 2 (a)Decomposition constants (k, Olson 1963, i.e. loge (Lt/L0) =-kt) of different plant parts of Phragmites australis (P. aus) and Spartina alterniflora (S. alt) in the Min River estuary, south-east China. Constants for the standing (k1: 0-90 days)) and surface phases (k2:90-210 days) of the decomposition process are presented along with an analysis of covariance testing the differences between k-slopes for each plant part of each species. The mean value for day 90 was used as the starting value for the calculation of k2. (b) Results from analysis of covariance testing for differences in k between the species (Constant) and responses through time (Slope); this analysis was performed for both periods separately and combined. In these analyses Phragmites australis was the intercept. Significance is denoted: ns= P>0.05; **=P<0.01, ***=P<0.001.
(a)
Species Plant parts k1 k2 k1 statistical estimates k2statistical estimates Analysis of Covariance
SE t P Adj
R2
SE t P Adj R2 Differences
between slopes (k)
Adj R2
P.aus Flower 0.00146 0.00814 0.0003 -5.7180 <0.001*** 0.61 0.0004 -20.2380 <0.001*** 0.97 -0.00668*** 0.98 Leaf 0.00157 0.00966 0.0002 -8.3990 <0.001*** 0.78 0.0005 -17.5830 <0.001*** 0.96 -0.00809*** 0.98 Stem(0-30cm) 0.00099 0.00272 0.0001 -11.3200 <0.001*** 0.88 0.0003 -8.9190 <0.001*** 0.89 -0.00173*** 0.95 Stem(30-80cm) 0.00109 0.00422 0.0001 -14.2170 <0.001*** 0.91 0.0004 -10.6000 <0.001*** 0.89 -0.00312*** 0.94 Stem(80-130cm) 0.00133 0.00499 0.0002 -8.7870 <0.001*** 0.79 0.0003 -15.3350 <0.001*** 0.94 -0.00366*** 0.97 Stem(130-180cm) 0.00124 0.00400 0.0001 -11.8780 <0.001*** 0.92 0.0004 -8.9160 <0.001*** 0.90 -0.00276*** 0.96
Combined stems 0.00114 0.00397 0.00007 -15.4920 <0.001*** 0.98 0.0004 -9.8373 <0.001*** 0.97 -0.00282*** 0.90
S.alt Flower 0.00237 0.00772 0.0002 -15.0360 <0.001*** 0.92 0.0007 -10.9300 <0.001*** 0.89 -0.00534*** 0.96 Leaf 0.00330 0.00879 0.0005 -6.7680 <0.001*** 0.69 0.0009 -9.5320 <0.001*** 0.87 -0.00485*** 0.95 Stem(0-30cm) 0.00384 0.00186 0.0002 -16.0600 <0.001*** 0.93 0.0005 -3.9960 <0.01** 0.52 0.00198*** 0.91 Stem(30-80cm) 0.00300 0.00246 0.0002 -12.4170 <0.001*** 0.88 0.0003 -8.3720 <0.001*** 0.83 0.00054*** 0.96 Stem(80-130cm) 0.00261 0.00301 0.0002 -12.5470 <0.001*** 0.89 0.0005 -5.9470 <0.001*** 0.74 -0.00041ns 0.93 Stem(130-180cm) 0.00193 0.00475 0.0003 -7.31000 <0.001*** 0.72 0.0003 -13.8800 <0.001*** 0.95 -0.00282*** 0.97
Combined stems 0.00288 0.00300 0.0002 -12.5741 <0.001*** 0.97 0.0002 -12.8136 <0.001*** 0.98 -0.00001ns 0.88
(b)
Plant parts Combined over both phases Phase 1:Standing phase Phase 2: Surface phase Slopes Adj R2 Slopes Adj R2 Slopes Adj R2
Flower 0.00001ns 0.91 -0.00091** 0.83 -0.10215 0.93
Leaf -0.00146* 0.90 -0.00173** 0.72 -0.50702** 0.92
Stem(0-30cm) -0.00010*** 0.92 -0.00285*** 0.96 -0.42595ns 0.87
Stem(30-80cm) -0.00030ns 0.91 -0.00191*** 0.92 -0.42174*** 0.90
Stem(80-130cm) 0.000003ns 0.91 -0.001285*** 0.89 -0.39474*** 0.88
1
Table 3 Regression equations of the relationship between elemental concentration (%) and time for different
2
structural components of P. australis and S. alterniflora over a 210-day decomposition study in the Min Estuary,
3
south-east China. Relationships were tested up to third-order polynomials and are the equations fitted in Tab. 3;
4
significance coded: ns= no significant relationship (P>0.05) here the overall mean is presented, * = P<0.05; ** =
5
P<0.01; ***= P<0.001.
6 7
Elemental Fraction P. australis S. alterniflora
b0 b1 b2 b3 P b0 b1 b2 b3 P
C Flower 425.73 -7.013 46.062 32.310 0.28** 438.12 -0.043 - - 0.09*
Leaf 380.37 18.134 36.209 - 0.18* 400.19 0.143 - - 0.68***
Stem 380.37 18.134 36.209 14.206 0.19* 439.07 51.234 -48.409 31.132 0.55**
N Flower 22.77 -0.348 2.209 8.637 0.34*** 8.892 8.961 7.391 -6.990 0.61***
Leaf 12.60 21.936 7.090 - 0.84*** 12.08 10.220 8.891 - 0.74***
Stem 6.50 9.213 4.125 - 0.26*** 4.14 10.23 2.750 - 0.54***
P Flower 1.29 - - - ns 0.83 0.023 0.673 0.377 0.33***
Leaf 0.65 1.662 0.753 - 0.54*** 1.32 -0.754 0.103 0.840 0.55***
Stem 0.41 0.759 0.709 - 0.08** 0.34 -0.057 0.1203 0.610 0.39***
8 9 10 11
[image:28.595.62.530.148.276.2]14
Fig. 1. Change in litter mass through time as a proportion of the starting mass for different plant parts of
15
Phragmites australis and Spartina alterniflora over a 210-day decomposition study in the Min River estuary,
16
south-east China.
17 18
Fig. 2. Change in litter carbon concentration (mg·g-1) through time for different plant parts of Phragmites
19
australis and Spartina alterniflora over a 210-day decomposition study in the Min River estuary, south-east
20
China. Parameters for fitted equations are presented in Table 3.
21 22
Fig. 3. Change in litter nitrogen concentration (mg·g-1) through time for different plant parts of Phragmites
23
australis and Spartina alterniflora over a 210-day decomposition study in the Min River estuary, south-east
24
China. Parameters for fitted equations are presented in Table 3.
25 26
Fig. 4. Change in litter phosphorus concentration (mg·g-1) through time for different plant parts of Phragmites
27
australis and Spartina alterniflora over a 210-day decomposition study in the Min River estuary, south-east
28
China. Parameters for fitted equations are presented in Table 3.
29 30
Fig. 5. Changes in litter C:N, C:P and ratios through time for different plant parts of Phragmites australis and
31
Spartina alterniflora over a 210-day decomposition study in the Min River estuary, south-east China. For clarity
32
mean data are presented, S.E. values were mainly <15% of the mean but are presented in full in Supplementary
33
materials (Table 1-3). Key to plant parts: flowers = open circle, leaves = filled circles, stems (all fractions pooled
34
= filled squares).
62 63 64 65 66 67 68 69 70 71 72 73 74 75 76 77 78 79 80 81 82 83 84 85 86
0 50 100 150 200
0 .0 0 .2 0 .4 0 .6 0 .8 1 .0 Flower
0 50 100 150 200
0 .0 0 .2 0 .4 0 .6 0 .8 1 .0 Leaf
0 50 100 150 200
0 .0 0 .2 0 .4 0 .6 0 .8 1 .0 Stem: 0-30cm
0 50 100 150 200
0 .0 0 .2 0 .4 0 .6 0 .8 1 .0 Stem: 30-80cm
0 50 100 150 200
0 .0 0 .2 0 .4 0 .6 0 .8 1 .0 Stem: 80-130cm
0 50 100 150 200
0 .0 0 .2 0 .4 0 .6 0 .8 1 .0 Stem: 130-180cm Time (days)
P.australis S. alterniflorus
0 50 100 150 200
0 .0 0 .2 0 .4 0 .6 0 .8 1 .0 Flower
0 50 100 150 200
0 .0 0 .2 0 .4 0 .6 0 .8 1 .0 Leaf
0 50 100 150 200
0 .0 0 .2 0 .4 0 .6 0 .8 1 .0 Stem: 0-30cm
0 50 100 150 200
0 .0 0 .2 0 .4 0 .6 0 .8 1 .0 Stem: 30-80cm
0 50 100 150 200
0 .0 0 .2 0 .4 0 .6 0 .8 1 .0 Stem: 80-130cm
0 50 100 150 200
[image:30.595.91.549.85.330.2]m
g
g
-1
0 50 100 200
300
350
400
450
500
0 50 100 200
300
350
400
450
500
0 50 100 200
300
350
400
450
500
0 50 100 200
300
350
400
450
500
0 50 100 200
300
350
400
450
500
0 50 100 200
300 350 400 450 500 m g g -1 87 Fig. 2 88 89 90 91 92 93 94 95 96 97 98 99 100 101 102 103 104 105 106
(a) P. australis
(b) S. alterniflora Flower
Flower Leaf Stem
(a) P. australis
107
Fig. 3
108 109 110
(b) S. alterniflora
[image:32.595.62.474.100.494.2]111
Fig. 4
112 113 114 115 116 117 118
(a)P. australis Flower Leaf Stem
(b) S. alterniflora
[image:33.595.60.465.85.510.2]119 120 121 122 123 124 125 126 127 128 129 130 131 132 133 134 135 136 137 138 139 140 141 142 143 144 145 146 147 148 149 150 151 152 153 154 155 156 157 158 0 50 100 150 200
0 50 100 150 200
C :N r at io P.australis 0 50 100 150 200
0 50 100 150 200
S.alterniflora
0 2000 4000 6000
0 50 100 150 200
C :P r ati o 0 2000 4000 6000
0 50 100 150 200
0 50 100
0 50 100 150 200
N :P rati o 0 50 100
0 50 100 150 200
Time (days)
[image:34.595.86.426.107.545.2]