This is a repository copy of
Health economics of Colonix: A new diagnostic test in
colorectal cancer
.
White Rose Research Online URL for this paper:
http://eprints.whiterose.ac.uk/10903/
Monograph:
Whyte, S., Chilcott, J. and Headey, J. (2008) Health economics of Colonix: A new
diagnostic test in colorectal cancer. Discussion Paper. (Unpublished)
HEDS Discussion Paper 08/11
eprints@whiterose.ac.uk https://eprints.whiterose.ac.uk/
Reuse
Unless indicated otherwise, fulltext items are protected by copyright with all rights reserved. The copyright exception in section 29 of the Copyright, Designs and Patents Act 1988 allows the making of a single copy solely for the purpose of non-commercial research or private study within the limits of fair dealing. The publisher or other rights-holder may allow further reproduction and re-use of this version - refer to the White Rose Research Online record for this item. Where records identify the publisher as the copyright holder, users can verify any specific terms of use on the publisher’s website.
Takedown
If you consider content in White Rose Research Online to be in breach of UK law, please notify us by
HEDS Discussion Paper 08/11
Disclaimer:
This is a Discussion Paper produced and published by the Health Economics
and Decision Science (HEDS) Section at the School of Health and Related
Research (ScHARR), University of Sheffield. HEDS Discussion Papers are
intended to provide information and encourage discussion on a topic in
advance of formal publication. They represent only the views of the authors,
and do not necessarily reflect the views or approval of the sponsors.
White Rose Repository URL for this paper:
Once a version of Discussion Paper content is published in a peer-reviewed
journal, this typically supersedes the Discussion Paper and readers are invited
to cite the published version in preference to the original version.
Published paper
None.
H
H
e
e
a
a
l
l
t
t
h
h
E
E
c
c
o
o
n
n
o
o
m
m
i
i
c
c
s
s
a
a
n
n
d
d
D
D
e
e
c
c
i
i
s
s
i
i
o
o
n
n
S
S
c
c
i
i
e
e
n
n
c
c
e
e
D
D
i
i
s
s
c
c
u
u
s
s
s
s
i
i
o
o
n
n
P
P
a
a
p
p
e
e
r
r
S
S
e
e
r
r
i
i
e
e
s
s
No. 08/11
Health economics of Colonix: A new diagnostic test in
colorectal cancer
Sophie Whyte, Jim Chilcott, Jessica Headey
Corresponding author:
Sophie Whyte
Health Economics and Decision Science
School of Health and Related Research, University of Sheffield,
Regent Court, 30 Regent Street
Sheffield S1 4DA, UK
Telephone: 0114 222 0859
Fax: 0114 272 4095
Email: Sophie.Whyte@sheffield.ac.uk
This series is intended to promote discussion and to provide information about work
in progress. The views expressed in this series are those of the authors, and should not
be quoted without their permission. Comments are welcome, and should be sent to the
corresponding author.
Table of Contents
INTRODUCTION
2
METHODS
3
Model Structure 3
Diagram of model structure 6
Table 1 - Model inputs 7
Table 2 – Distributions used in the PSA 9
Patient pathways when Colonix test is negative 10
Colonix Trials 10
Colonix test characteristics 11
Other diagnostic test characteristics 12
Disease Prevalence age, etc 14
Duke’s stage distribution 14
Costs 14
Survival and Health related quality of life 15
RESULTS AND DISCUSSION
16
General Information on cost-effectiveness plane 16
Clinical and cost outcomes 18
Economic outcomes 18
Discussion 24
REFERENCES
26
SUMMARY
The Colonix test is used for the early detection / screening of colorectal cancer and other bowel diseases such as inflammatory bowel disease (IBD). An economic model has been constructed to estimate the cost-effectiveness of the use of the Colonix device as a pre-colonoscopy evaluation test in a primary care setting i.e. for patients presenting
symptomatically to their GP. The aim of using Colonix as a pre-colonoscopy test would be to avoid unnecessary colonoscopies as colonoscopy is costly, invasive and comes with a risk of perforation.
A cost effectiveness model was built in Treeage. The population consists of patients who have presented to their GP with distal colonic symptoms who were subsequently referred by their GP for endoscopic assessment. Essentially the Colonix test will help determine whether urgent colonoscopy or an extended observation period is preferable. The model calculates costs incurred and QALYs gained over a patient’s life-time. A life-time horizon was used as it is possible that a false negative test result could cause a delay in diagnosis which could compromise patient survival thus effecting QALY gains over a patient lifetime. The model includes diagnostic test costs and associated costs such as retests and treating bowel perforations due to colonoscopy and it includes colorectal cancer treatment costs. The model is populated with data relating to diagnostic test characteristics, disease prevalence,
diagnostic test costs, CRC treatments costs, health state utility values and CRC natural history.
The model output includes the incremental cost effectiveness ratio (ICER), net monetary benefit (NMB) and number of colonoscopies avoided. The model structure allows all parameters such as Colonix test characteristics, cost of Colonix, etc to be easily updated. With the current model assumptions (e.g. patients receiving a true negative Colonix test incur no additional diagnosis costs) the use of Colonix is cost-effective at a willingness to pay of £20K and has a NMB of just over £200 pounds per person. It will also result in around 60% less colonoscopies.
In constructing the model the importance of correctly representing the treatment pathways became evident. Further information relating to the diagnostic pathways for patients receiving a negative Colonix result is required to correctly model the economics. Specifically sensitivity analyses showed that the model results are highly dependent on the variable ‘cost of
additional diagnostics following a negative Colonix test’. This cost will be different for patients with different underlying conditions and this should be reflected in the modelling. Three potential courses of action are suggested:
1) Collect further subjective clinical judgement relating to diagnostic pathways following a negative Colonix result.
2) Examine what information of patient pathways is obtainable from existing Colonix trials – i.e. what subsequent diagnostic tests patients received following a negative result.
3) Undertake a randomized control trial (RCT) to directly compare the two fully defined alternative diagnostic pathways (one pathway to represent the existing situation and one to include Colonix).
INTRODUCTION
3
The largest cost as a proportion of the total cost of illness for bowel cancers is the cost of diagnosis which makes up 26% of the overall cost (YHEC report 2007). The diagnosis cost includes the cost of referral and diagnosis of all patients who present via a GP, A&E or from elsewhere in secondary care. A large proportion of the diagnosis cost is due to the cost of those patients in whom bowel cancer is suspected but who subsequently receive a negative diagnosis.
An economic model has been constructed to estimate the cost-effectiveness of the use of the Colonix device as a pre-colonoscopy evaluation test in a primary care setting i.e. for patients presenting symptomatically to their GP. The aim is to get Colonix approved for use in this patient group – and subsequently the aim would be to expand use to other groups. The aim of using Colonix as a pre-colonoscopy test would be to avoid unnecessary colonoscopies. Colonoscopy is costly, invasive and comes with a risk of perforation. Avoiding unnecessary colonoscopies would result in both cost and QALY savings.
Currently no pre-colonoscopy evaluation test is used, (although (Selvachandran 2002) describes a questionanaire and scoring system to predict CRC) so the economic evaluation will compare Colonix to no pre-colonoscopy test. The model structure is a decision tree which compares colonoscopy to Colonix test followed by colonoscopy if the Colonix test result is positive.
This document describes the model structure, key assumptions made, data sources and results. Areas where further research will be required to complete a NICE submission are identified in this report.
METHODS
Model Structure
The population consists of patients who have presented to their GP with distal colonic symptoms who were subsequently referred by their GP for endoscopic assessment. Essentially the Colonix test will help determine whether urgent colonoscopy or an extended observation period is preferable.
NHS guidelines describe how symptomatic patients can be classified into low risk or high risk when referred by their GP. Patients classified as high risk will be seen within 2 weeks.
The population considered here consists of patients deemed to be both high and low risk. The modelling does not include patients who present to their GP symptomatically but are not referred. The use of Colonix in this group of patients may be beneficial but is not currently modelled (to do this we would require prevalence information for patients who are not referred).
A symptomatic patient may have colorectal cancer or another colorectal condition such as inflammatory bowel disease(IBD), polyps, diverticulitis, small benign adenomatous polyps, hyperplastic polyps etc. As we are suggesting that Colonix be used in the whole group of symptomatic patients these other colorectal conditions must be considered. In the modelling we have split the symptomatic population into four groups: cancer, large polyps, IBD
(including diverticulosis complicated by inflammation) and other. Here other encompasses multiple disease states.
be perfectly justified since diverticulitis is often difficult to distinguish from cancer without colonoscopy+biopsy, and endoscopic removal of suspicious polyps is a commonly applied procedure.
As the aim of Colonix use is to avoid unnecessary colonoscopies it is important to differentiate between conditions which do and don’t require endoscopy. The modelling makes the
following assumptions:
Conditions requiring colonoscopy: • Cancer
• Large polyps
• IBD (including diverticulosis complicated by inflammation ie Diverticulitis)
Conditions not requiring colonoscopy:
• Small polyps (small benign adenomas, hyperplastic polyps)
• Diverticulosis (uncomplicated)
• Normal/other -conditions beyond the large bowel or functional disorders (e.g.
Irritable Bowel Syndrome).
The main purpose of the modelling is to quantify the benefits of avoided colonoscopies. The model calculates costs incurred and QALYs gained over a patients life-time. A life-time horizon was used as it is possible that a false negative test result could cause a delay in diagnosis which could compromise patient survival thus effecting QALY gains over a patient lifetime. The model includes diagnostic test costs and associated costs such as retests and treating bowel perforations due to colonoscopy and it includes colorectal cancer treatment costs. The model has been built in Treeage, a decision analysis software, which is accepted by NICE for submissions. A free trial version of Treeage Pro can be downloaded from
www.treeage.com/products/download.html and the model can be viewed using this trial version. The outline model structure is shown in figure 1.
Where available different diagnostic test characteristic values have been used for sensitivity to cancer, polyps and IBD. Test characteristics and prevalence values are used to predict numbers of true and false positive and negative diagnoses. The model uses different sensitivity values for different groups of colorectal conditions (cancer and large pre-cancerous polyps, and IBD).
If a patients Colonix test has heavy contamination it is assumed that a repeat test will be given. Colonix have not repeated any contaminated tests in the trials so we have no information on whether a repeat test is likely to be contaminated also. The model assumes that the repeat test will not be contaminated. It is also assumed that contamination is independent to the underlying disease state.
A patient undergoing colonoscopy may experience a complication such as bleeding or a bowel perforation which could require treatment or possibly be fatal. Of patients not experiencing a fatal bowel perforation there is a possibility that the colonoscopy will be incomplete. Currently we assume that of patients who receive an incomplete colonoscopy 60% have BE and 40% have CT colonography (personal communication – Ian Daniels) and that these subsequent tests are always adequate. We assume that patients, who survive perforation during colonoscopy have the same characteristics as the non-perforated patients. ( C Ferret will check the exact percentages for the JRH , Oxford for the last year)
5
We will assume that a delayed diagnosis will not effect IBD or diverticulosis treatment costs. It is assumed that the utility value for a symptomatic patient with undiagnosed IBD is lower than for a patient with a diagnosis. We assume that HRQOL will improve once a diagnosis is reached and a patient starts to receive treatment (Allen 2005)
The economic analysis assumes that future costs and QALYs are discounted at 3.5% per annum respectively, in line with current NICE recommendations.
The user defined inputs for the model are: Patient age
Colonix DNA decision threshold Willingness to pay threshold
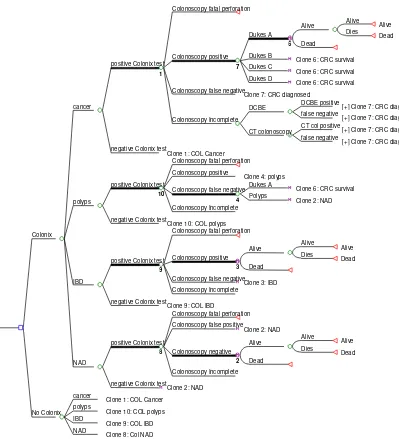
Diagram of model structure
[image:10.595.96.495.248.687.2]Figure 1 shows the decision tree structure of the model. The decision tree contains a lot of repeated subtrees so for simplicity 10 clones are used to describe the structure and these are labelled on the diagram. The structure after the colonoscopy incomplete node is displayed in the top (cancer) arm only (again to avoid repetition). For cancer patients (the top arm) the proportion of patients diagnosed in each Dukes stage changes if the patient receives a false negative and hence a delayed diagnosis. This is achieved using a Boolean variable which is set to 1 if the result is a false negative. So for clone 7: CRC diagnosed, the proportion of patients diagnosed in each Dukes stage will depend of whether a false negative and a delay in diagnosis has been received.
Figure 1: diagram of model structure
Colonoscopy fatal perforation
Alive Alive Dies Dead Alive Dead 6 Dukes A Dukes B
Clone 6: CRC survival Dukes C
Clone 6: CRC survival Dukes D
Clone 6: CRC survival
7
Colonoscopy positive
Colonoscopy false negative
Clone 7: CRC diagnosed DCBE positive
[+] Clone 7: CRC diagnosed false negative
[+] Clone 7: CRC diagnosed DCBE
CT col positive
[+] Clone 7: CRC diagnosed false negative
[+] Clone 7: CRC diagnosed CT colonoscopy
Colonoscopy Incomplete
1
positive Colonix test
negative Colonix test
Clone 1: COL Cancer cancer
Colonoscopy fatal perforation Colonoscopy positive
Clone 4: polyps Dukes A
Clone 6: CRC survival Polyps
Clone 2: NAD
4
Colonoscopy false negative
Colonoscopy Incomplete
10
positive Colonix test
negative Colonix test
Clone 10: COL polyps polyps
Colonoscopy fatal perforation
Alive Alive Dies Dead Alive Dead 3 Colonoscopy positive
Colonoscopy false negative
Clone 3: IBD Colonoscopy Incomplete
9
positive Colonix test
negative Colonix test
Clone 9: COL IBD IBD
Colonoscopy fatal perforation Colonoscopy false positive
Clone 2: NAD Alive Alive Dies Dead Alive Dead 2 Colonoscopy negative Colonoscopy Incomplete 8
positive Colonix test
negative Colonix test
Clone 2: NAD NAD
Colonix
cancer
Clone 1: COL Cancer polyps
Clone 10: COL polyps IBD
Clone 9: COL IBD NAD
7
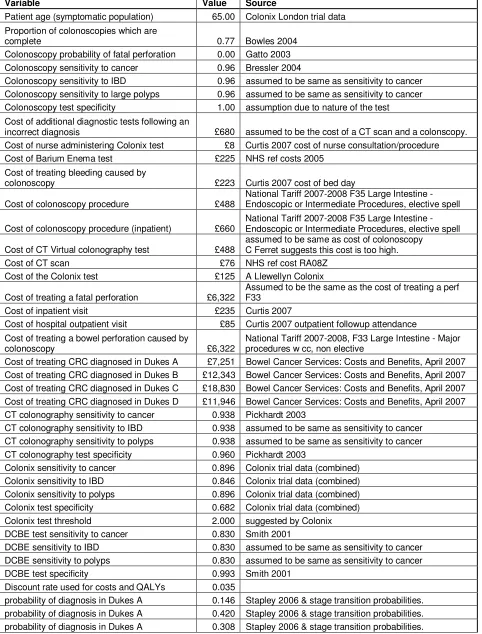
Table 1 - Model inputs
Variable Value Source
Patient age (symptomatic population) 65.00 Colonix London trial data Proportion of colonoscopies which are
complete 0.77 Bowles 2004
Colonoscopy probability of fatal perforation 0.00 Gatto 2003 Colonoscopy sensitivity to cancer 0.96 Bressler 2004
Colonoscopy sensitivity to IBD 0.96 assumed to be same as sensitivity to cancer Colonoscopy sensitivity to large polyps 0.96 assumed to be same as sensitivity to cancer Colonoscopy test specificity 1.00 assumption due to nature of the test Cost of additional diagnostic tests following an
incorrect diagnosis £680 assumed to be the cost of a CT scan and a colonscopy.
Cost of nurse administering Colonix test £8 Curtis 2007 cost of nurse consultation/procedure
Cost of Barium Enema test £225 NHS ref costs 2005
Cost of treating bleeding caused by
colonoscopy £223 Curtis 2007 cost of bed day
Cost of colonoscopy procedure £488
National Tariff 2007-2008 F35 Large Intestine - Endoscopic or Intermediate Procedures, elective spell
Cost of colonoscopy procedure (inpatient) £660
National Tariff 2007-2008 F35 Large Intestine - Endoscopic or Intermediate Procedures, elective spell
Cost of CT Virtual colonography test £488
assumed to be same as cost of colonoscopy C Ferret suggests this cost is too high.
Cost of CT scan £76 NHS ref cost RA08Z
Cost of the Colonix test £125 A Llewellyn Colonix
Cost of treating a fatal perforation £6,322
Assumed to be the same as the cost of treating a perf F33
Cost of inpatient visit £235 Curtis 2007
Cost of hospital outpatient visit £85 Curtis 2007 outpatient followup attendance Cost of treating a bowel perforation caused by
colonoscopy £6,322
National Tariff 2007-2008, F33 Large Intestine - Major procedures w cc, non elective
Cost of treating CRC diagnosed in Dukes A £7,251 Bowel Cancer Services: Costs and Benefits, April 2007 Cost of treating CRC diagnosed in Dukes B £12,343 Bowel Cancer Services: Costs and Benefits, April 2007 Cost of treating CRC diagnosed in Dukes C £18,830 Bowel Cancer Services: Costs and Benefits, April 2007 Cost of treating CRC diagnosed in Dukes D £11,946 Bowel Cancer Services: Costs and Benefits, April 2007 CT colonography sensitivity to cancer 0.938 Pickhardt 2003
CT colonography sensitivity to IBD 0.938 assumed to be same as sensitivity to cancer CT colonography sensitivity to polyps 0.938 assumed to be same as sensitivity to cancer CT colonography test specificity 0.960 Pickhardt 2003
Colonix sensitivity to cancer 0.896 Colonix trial data (combined)
Colonix sensitivity to IBD 0.846 Colonix trial data (combined)
Colonix sensitivity to polyps 0.896 Colonix trial data (combined)
Colonix test specificity 0.682 Colonix trial data (combined)
Colonix test threshold 2.000 suggested by Colonix
DCBE test sensitivity to cancer 0.830 Smith 2001
DCBE sensitivity to IBD 0.830 assumed to be same as sensitivity to cancer
DCBE sensitivity to polyps 0.830 assumed to be same as sensitivity to cancer
DCBE test specificity 0.993 Smith 2001
Discount rate used for costs and QALYs 0.035
probability of diagnosis in Dukes A 0.125 Stapley 2006 & stage transition probabilities. length of delay in diagnosis (years) due to a
false negative 0.115 personal communication Ian Daniels
CRC related mortality - Dukes A 0.037
Cancer research UK website 5 year survival. CRC related mortality is assumed to be constant over the first 5 years and 0 from years 6 onwards.
CRC related mortality - Dukes B 0.085 Cancer research UK website 5 year survival. CRC related mortality - Dukes C 0.176 Cancer research UK website 5 year survival. CRC related mortality - Dukes D 0.504 Cancer research UK website 5 year survival.
General yearly mortality 0.016 GAD life table ONS 2004-2006
Prevalence of cancer 0.057 Colonix London trial data
Prevalence of IBD 0.033 Colonix London trial data
Prevalence NAD 0.900 Colonix London trial data
Prevalence large polyps 0.010 Colonix London trial data
Probability that a patient receiving and
incomplete colonoscopy will have DCBE 0.600 personal communication Ian Daniels Yearly stage transition probability A to B 0.450 Tappenden 2007 ScHARR screening model Yearly stage transition probability B to C 0.541 Tappenden 2007 ScHARR screening model Yearly stage transition probability C to D 0.513 Tappenden 2007 ScHARR screening model Yearly stage transition probability high risk
polyps to A 0.021 Tappenden 2007 ScHARR screening model
Utility CRC diagnosed in Dukes A 0.740 Ness 1999
Utility CRC diagnosed in Dukes B 0.700 Ness 1999
Utility CRC diagnosed in Dukes C 0.500 Ness 1999
Utility CRC diagnosed in Dukes D 0.240 Ness 1999
Utility with IBD diagnosed 0.850 Allen 2005
Utility with IBD undiagnosed 0.650 Allen 2005
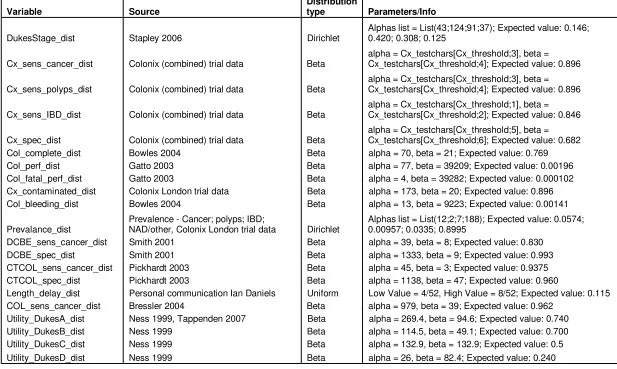
Table 2 – Distributions used in the PSA
Variable Source
Distribution
type Parameters/Info
DukesStage_dist Stapley 2006 Dirichlet
Alphas list = List(43;124;91;37); Expected value: 0.146; 0.420; 0.308; 0.125
Cx_sens_cancer_dist Colonix (combined) trial data Beta
alpha = Cx_testchars[Cx_threshold;3], beta = Cx_testchars[Cx_threshold;4]; Expected value: 0.896
Cx_sens_polyps_dist Colonix (combined) trial data Beta
alpha = Cx_testchars[Cx_threshold;3], beta = Cx_testchars[Cx_threshold;4]; Expected value: 0.896
Cx_sens_IBD_dist Colonix (combined) trial data Beta
alpha = Cx_testchars[Cx_threshold;1], beta = Cx_testchars[Cx_threshold;2]; Expected value: 0.846
Cx_spec_dist Colonix (combined) trial data Beta
alpha = Cx_testchars[Cx_threshold;5], beta = Cx_testchars[Cx_threshold;6]; Expected value: 0.682
Col_complete_dist Bowles 2004 Beta alpha = 70, beta = 21; Expected value: 0.769
Col_perf_dist Gatto 2003 Beta alpha = 77, beta = 39209; Expected value: 0.00196
Col_fatal_perf_dist Gatto 2003 Beta alpha = 4, beta = 39282; Expected value: 0.000102
Cx_contaminated_dist Colonix London trial data Beta alpha = 173, beta = 20; Expected value: 0.896
Col_bleeding_dist Bowles 2004 Beta alpha = 13, beta = 9223; Expected value: 0.00141
Prevalance_dist
Prevalence - Cancer; polyps; IBD;
NAD/other, Colonix London trial data Dirichlet
Alphas list = List(12;2;7;188); Expected value: 0.0574; 0.00957; 0.0335; 0.8995
DCBE_sens_cancer_dist Smith 2001 Beta alpha = 39, beta = 8; Expected value: 0.830
DCBE_spec_dist Smith 2001 Beta alpha = 1333, beta = 9; Expected value: 0.993
CTCOL_sens_cancer_dist Pickhardt 2003 Beta alpha = 45, beta = 3; Expected value: 0.9375
CTCOL_spec_dist Pickhardt 2003 Beta alpha = 1138, beta = 47; Expected value: 0.960
Length_delay_dist Personal communication Ian Daniels Uniform Low Value = 4/52, High Value = 8/52; Expected value: 0.115
COL_sens_cancer_dist Bressler 2004 Beta alpha = 979, beta = 39; Expected value: 0.962
Utility_DukesA_dist Ness 1999, Tappenden 2007 Beta alpha = 269.4, beta = 94.6; Expected value: 0.740
Utility_DukesB_dist Ness 1999 Beta alpha = 114.5, beta = 49.1; Expected value: 0.700
Utility_DukesC_dist Ness 1999 Beta alpha = 132.9, beta = 132.9; Expected value: 0.5
Patient pathways when Colonix test is negative
Further information is required to better understand the possible patient pathways when a negative Colonix test result is obtained.
All symptomatic patients receiving a negative Colonix will be referred to an outpatient clinic. If the patients symptoms persist then it is likely that further diagnostic tests will be performed. The model uses the same length of delay for false negative Colonix test as for a false negative colonoscopy, barium enema or CT colonography result. Clinical opinion suggests that the likely length of delay in diagnosis caused by a symptomatic patient receiving a false negative test result is 4-8 weeks (personal communication Ian Daniels). Hence we assume that all patients will be correctly diagnosed 4-8 weeks after receiving a false negative diagnosis. In the sensitivity analysis a uniform distribution with a low value of 4 weeks and a high value of 8 weeks was used.
It is important to model the costs and QALYs associated with being referred to an outpatient clinic. As the model stands the most cost effective strategy is to simply refer all patients to the outpatient clinic and not to colonoscopy them until further diagnostics have been performed. Hence it is important to gain further information about the possible patient pathways when a negative Colonix test result is obtained.
Colonix Trials
Detailed information about the trial protocols should be included as part of the NICE
submission. All questions in the QUADAS tool (see Appendix) should be answered and where the Colonix trial does not meet the QUADAS criteria the justification for this should be clearly explained.
The following four trials look at the use of the Colonix tool as a device for diagnosing colorectal cancer.
1) Guildford – symptomatic patients and cancer patients 2) Honiton – asymptomatic volunteers
3) Oxford – cancer patients 4) London – symptomatic patients
Information recorded for each study participant includes trial ID, age, sex, results of DNA analysis and cytological examination (if available), clinical diagnosis and pathology record (if available).
Precise details on the study populations should be provided, for example Does the
symptomatic population in the Colonix study consist of patients who have been referred by their GP? Also is there a definition of referral protocols that the GPs in the study use? – this would describe criteria which a patient will meet for entry into the study.
In the Honiton trial patients do not receive the reference standard (colonoscopy) as it is extremely difficult to have colonoscopies done in healthy volunteers. As there may be some “silent” conditions in this asymptomatic group, thus the performance of the test can be slightly underestimated.
11
Colonix test characteristics
The population we are considering here is a symptomatic population. If such a population is used to determine test characteristics then as the number of patients with cancer will be small this will lead to considerable uncertainty surrounding the test sensitivity values. For this reason information from all four trials has been combined to calculate test characteristics. It is possible that combining the data from several trials in this way could introduce bias so this should be looked into by considering the trial designs and protocols.
As it is thought that the Colonix test will have different characteristics for detecting different conditions separate sensitivity values are calculated for cancer, polyps, IBD. (A draw back of this approach is that the data sets will be smaller so there will be more uncertainty around test characteristic values).
The Colonix data records the following conditions:
dsnumtr finds
Colonoscopy required
0 NAD N
1 Diverticulosis N
2
Hyperplastic polyps (small benign polyps not related to
CRC) N
3 Small adenomatous polyps (less than 10mm) N 4 Large adenomatous polyps (10 mm and over) Y
5 CRC Y
6 Inflammatory conditions (except ulcerative colitis) Y 7 Inflammatory conditions (ulcerative colitis) Y 8 Malignancies (non-CRC) N 9 Familial Adenomatosis Coli (FAP) Y?
Combinations of several conditions:
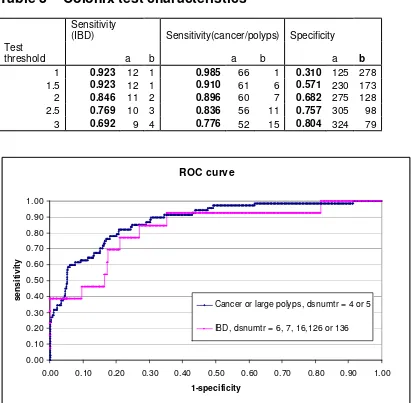
12 Diverticulosis and hyperplastic polyps N 13 Diverticulosis and small adenoma N 16 Diverticulosis and inflammation Diverticulitis Y 126 Diverticulosis, hyperplastic polyp(s), inflammation Y 136 Diverticulosis, small adenomatous polyp(s), inflammation Y As the number of patients with large polyps (dsnumtr=4) is only 3 in the data currently available we have chosen to combine large polyps and cancer for the purpose of calculating test sensitivity. With a larger data set separate sensitivities for cancer and large polyps could be calculated. The test characteristics of Colonix have been calculated from study results for a range of DNA test thresholds. A DNA threshold of 2 has been selected for the base case. The uncertainty surrounding the tests characteristics is modelled using a beta distribution with parameters a=TP, b= FN for sensitivity and a=TN, b=FP for specificity. We have used a beta distribution in the model as this constrains the test characteristics to be between 0 and 1. Examples of sensitivity and specificity values are given in table 3.
Table 3 – Colonix test characteristics
Sensitivity
(IBD) Sensitivity(cancer/polyps) Specificity Test
threshold a b a b a b
1 0.923 12 1 0.985 66 1 0.310 125 278 1.5 0.923 12 1 0.910 61 6 0.571 230 173 2 0.846 11 2 0.896 60 7 0.682 275 128 2.5 0.769 10 3 0.836 56 11 0.757 305 98 3 0.692 9 4 0.776 52 15 0.804 324 79
ROC curve
0.00 0.10 0.20 0.30 0.40 0.50 0.60 0.70 0.80 0.90 1.00
0.00 0.10 0.20 0.30 0.40 0.50 0.60 0.70 0.80 0.90 1.00
1-specificity
s
e
n
s
iti
v
ity
Cancer or large polyps, dsnumtr = 4 or 5
IBD, dsnumtr = 6, 7, 16,126 or 136
Other diagnostic test characteristics
A systematic review of test characteristics of diagnostic tests involved in the pathway of diagnosing colorectal cancer should be undertaken as part of the NICE submission. If results prove to be very sensitive to diagnostic test characteristics a more analytical
approach/Bayesian evidence synthesis may be appropriate.
Test characteristic values relating to diagnosis of IBD have not yet been researched. The model currently uses the same test characteristic values for sensitivity to IBD as for cancer. Estimates for the sensitivity and specificity of colonoscopy, barium enema and CT
colonography have been taken from the following published studies:
Colonoscopy
Colonoscopy is viewed as the ‘gold standard’ for diagnostic testing as it allows a complete visualisation of the bowel. However, it is an imperfect ‘gold standard’ as complete
13
Colonoscopies are considered to be complete when the caecum can be visualised and identified. An audit of several colonoscopy units in the UK showed that the average
completion rate was 76.9% (Bowles et al, 2004). Caecal intubation was reported in 76.9% of procedures. However, when identification of the ileocaecal valve or intubation of the terminal ileum were the only criteria used for successful colonoscopy, just 56.9% of procedures could be considered complete. The caecal intubation rate varied considerable depending on the experience of the colonoscopist – from 69.2% to 83.6%. The first round of the UK screening pilot reported 416 incomplete colonoscopies and 3700 complete, so a completion rate of 90% (Steele 2004). It was suggested (person communication Ian Daniels) that the screening data does not include patients with poor bowel preparation so it is better to use the results of the audit, i.e. 76.9%. In the sensitivity analysis a beta distribution was chosen with 95% CI’s approximately matching the range reported (69.2% to 83.6%).
Withdrawal time of the scope or equivalently length of duration of the exam is related to test sensitivity. Colonoscopist with mean withdrawal times of less than 6 minutes, those with mean withdrawal times of 6 minutes or more had higher rates of detection of any neoplasia (Barclay 2006).
Smith O’Dwyer 2001, N=1081, report a sensitivity rate of 97.5%,=36/37 for the detection of colorectal cancer and polyps over 10mm sensitivity. De Zwart et al (2001) gives a range 79%-100%, and Rex et al (1997) report a sensitivity rate of 95%. Bressler 2004, N=10,187, report a sensitivity of 96%. As the Bressler study was so large this value has been used as the mean and a beta distribution with CIs that include a miss rate of approximately 3% (suggested by Ian Daniels) has been used.
The other main outcomes reported in the colonoscopy literature were perforation and complication rates. These were reported in several studies including Ball et al (2004), De Zwart et al (2001), Thomas-Gibson et al (2002) and Bowles et al (2004).
Perforation rates were taken from (Gatto 2003) which reports a perforation rate of 0.2% and a fatal perforation rate of 0.01%. Bleeding following colonoscopy was taken from Bowles 2004 which reports 13/9223=0.14%.
Double contrast barium enema
Double Contrast Barium Enema (DCBE) is a common diagnostic method which allows the whole bowel to be visualised. It is generally not as sensitive as other methods, such as colonoscopy, but complication rates are typically lower.
The majority of the DCBE literature focused on sensitivity rates either for the identification of polyps over 10mm or cancer. In the literature, sensitivity rates are reported to range from 79% for radiologists in Booth et al (2005) to 97% in Law et al (1999). Other studies reported sensitivity rates in between, including Connolly et al (2002) 90.2%, Culpan et al (2002) 90.6%, Rex et al (1997) 83%, Smith et al (2001) 83% and Tawn et al (2005) 85.9%. Values reported in Smith O’Dwyer 2001, N=1389, sensitivity=83%=39/47, Specificity =99%=1-9/1342 have been used in the model.
Booth et al (2005) also indicated that double reporting may increase sensitivity rates of DCBE as the double reported sensitivity rates were up to 89% and this is consistent with other studies where DCBE are double reported such as Leslie et al (2002) and Law et al (1999) which report sensitivity rates of 93% and 97% respectively.
Computerized tomographic (CT) virtual colonoscopy
Computerized Tomographic (CT) virtual colonoscopy is a fairly new minimally invasive diagnostic procedure that generates a series of 2 and 3 dimensional images that allow for a full visualisation of the bowel. Recently accepted by the American Gastro Society. This procedure unlike conventional colonoscopy requires no intravenous sedatives to be administered and recovery times are much shorter.
96%(1138/1185). White 2008, N=150, reports that for cancers VC had a sensitivity and specificity of 100% and 99.2% respectively and for detecting polyps >10mm, VC had a sensitivity and specificity (per patient) of 91% and 99.2% respectfully.
The model uses the values from Pickhardt 2003 which is a large trial.
Disease Prevalence age, etc
The Colonix London trial (193 symptomatic patients at present but will be 500 when trial completes) is used to provide data on cancer, polyp and IBD prevalence in the symptomatic population. The mean patient age in the London trial was 65 with the majority of the patients aged between 50 and 80. We will obtain results for patient age equal to 55,65 and 75. The disease prevalence in the London trial is similar to that reported in Selvachandran 2002. The risk of cancer in a symptomatic patient is highly dependent on the symptoms experienced and on the setting (Thompson 2003). A range of values for prevalence should be considered in the sensitivity analysis.
Duke’s stage distribution
For cancer the model uses the Duke’s stage distribution on diagnosis to calculate survival and treatment costs for patients with CRC. The model includes any HRQOL decrements due to a delay in diagnosis for patients receiving a false negative Colonix/colonoscopy test result. For a group of patients with CRC who experience a delay in diagnosis the stage distribution will change; as some patients may progress. This is modelled using annual stage transition probabilities (Tappenden 2004) and the estimated length of delay in diagnosis.
Costs
The main costs included in the model are those related to diagnosis. Diagnosis costs include diagnostic tests/procedures, costs of complications such as bleeding/perforation caused by colonoscopy, and further diagnostics due to unsatisfactory tests such as contaminated Colonix or incomplete colonoscopies. As a delayed diagnosis may effect Duke’s stage distribution colorectal cancer treatment costs are also included.
The cost of a colonoscopy is taken from the NHS national tariff 2007-2008. We have used F35 - Large Intestine - Endoscopic or Intermediate Procedures, £488 elective spell tariff (<= 1 day), and £172 for each additional day. Approximately 10% of patients will receive
colonoscopy as an inpatient for medical or social reasons (e.g. heart problems, unfit, home alone) (personal communication Ian Daniels) so for these patients we have assumed the cost of colonoscopy is £488+£172=£660.
It is assumed that patients receiving an incomplete colonoscopy will then have a BE or CT colonography and that this will require a subsequent outpatient attendance. It is estimated that 60% of patients will have BE and 40% CT colonography (personal communication Ian Daniels). The cost of barium enema is (£225 NHS ref costs 2005). As we do not have a specific cost for CT colonography the model currently assumes that the cost is the same as for colonoscopy. The cost of treating a bowel perforation is assumed to be £6322 (Large Intestine - Major Procedures w cc, non-elective, NHS ref costs 2007-2008) and the cost of treating bleeding is assumed to be one hospital bed day £223 (Curtis 2007).
15
additional visit is likely to be involved (personal communication Ian Daniels). It thought that a GP will recommend a Colonix test and the patient will subsequently return and the test will be administered by a qualified nurse; the cost of a nurse consultation is £8 Curtis 2007. The model currently assumes that tests with heavy contamination will be repeated and the associated cost of this repeat test is included in the model. It is assumed that repeat tests will be satisfactory.
Cost of Colonix = (cost of test +cost of nurse admin)*(1+proportion of tests contaminated). (£125+£8)*(1+0.104)=£146.78
A dietary restriction could decrease the levels of contamination. Although dietary recommendations will be employed there is currently no data giving information on how dietary restrictions may affect the contamination rate so this had not been included in the modelling.
It is assumed that patients who receive a false negative diagnosis will incur additional
diagnosis costs. In the model this is currently set as the cost of a CT scan (£76 NHS ref costs 2007) and a colonoscopy. The model includes CRC treatment costs which are dependent on Duke’s stage on diagnosis (YHEC report 2007). The model includes any changes to
treatment costs due to a delay in diagnosis for patients receiving a false negative Colonix test result. For patients receiving a delay in diagnosis the stage distribution will change (as some patients may progress), hence mean treatment costs for this group are adjusted accordingly in the model.
Survival and Health related quality of life
For a NICE submission a systematic review of literature relating to utility values for CRC, IBD, and symptomatic patients would need to be undertaken.
For patients who do not have colorectal cancer yearly survival rates are taken from the ONS lifetables, and are dependent on age and sex. For patients without colorectal cancer a utility multiplier of 0.91 is used (Tappenden 2007 -references Ness 1999).
A proportion of patients will survive colorectal cancer and we have assumed that patients who survive to 5 years will not subsequently have metastatic recurrence. Survival in years 1-5 is assumed to be constant and dependent on stage. Stage dependent 5-year survival is taken from the cancer research uk website (see table below). It is assumed that survival in years 6 onwards is the same as for an average person of the same age.
Dukes' Stage modified
Approximate frequency at diagnosis
Approximate five-year survival A 11% 83% B 35% 64% C 26% 38%
D 29% 3%
Patients with high risk polyps will undergo a polypectomy and then undergo surveillance colonoscopy every 3 years until they have two consecutive negative results. It has been assumed that the life expectancy and utility for a patient who has had polyps removed is the same as for an average person of the same age.
effects of cancer treatment received, for example having part of their colon removed. It is assumed that a patient with a false negative test result who is experiencing a delay in diagnosis has the same utility as a patient who is diagnosed with colorectal cancer. For patient with IBD HRQOL is assumed to improve when a correct diagnosis is obtained.
RESULTS AND DISCUSSION
General Information on cost-effectiveness plane
It is most usual for a new health intervention to be associated with increased QALYs and increased costs compared to the baseline treatment. Such an intervention would be in the top right quadrant of the cost-effectiveness plane, see figure below, and is considered cost effective if the incremental cost effectiveness ratio (ICER) is less than the willingness to pay threshold (£20K-£30K in the UK).
An intervention associated with increased QALYS (effectiveness) and decreased costs (the bottom right quadrant) will always be considered cost effective. Similarly an intervention associated with decreased QALYS (effectiveness) and increased costs (the top left quadrant) will never be considered cost effective.
The final possibility (the bottom left quadrant) is an intervention which decreases both costs and QALYs. Calculating the ICER can be misleading in this case. As both incremental costs and QALYs are negative the ICER will be positive. An intervention in this bottom left quadrant is considered cost effective if the ICER is greater that the willingness to pay threshold. This is because a high ICER relates to a large cost saving and a small QALY decrement.
The incremental net monetary benefit (NMB) is a more illustrative result for interventions in this quadrant.
inc. NMB = willingness to pay threshold * incremental QALYs - incremental costs.
17
Cost-effectiveness plane
+
-Incremental Effectiveness, QALYs
+
-Intervention less effective and more costly
Incremental Cost, £s
Intervention more effective and less costly Intervention
less effective and less costly
Intervention more effective and more costly
Cost-effective region
Cost-effectiveness plane – showing lines of equal NMB
Willingness to pay threshold, lambda=£20K NMB=lambda*QALYs-Costs
+
-Incremental Effectiveness, QALYs
+
-Incremental Cost, £s
Cost-effective region
£20K
1 QALY
NMB=£0
NMB=£10K
+
£10K
Clinical and cost outcomes
The purpose of the following section is to present baseline results of the model. These results relate to a female population of age 65 and use a Colonix test threshold of 2. In this
population the number of colonoscopies avoided by using Colonix in 1000 symptomatic patients is 626.
No Colonix Colonix mean 95% CI mean 95% CI Number of colonoscopys (as initial
diagnostic or following positive Colonix) 1000 373.9 ( 327, 422)
Mean cost of diagnosis £619 (£584, £659) £389 (£354,£423) Mean cost of cancer treatment (per patient
with cancer) £13,653 £13,653
Number of inappropriate* colonoscopies 900 288
Number of patients obtaining a false
negative Colonix or Colonoscopy test result 5.9 17.3
Number of cancers detected (at initial
colonoscopy) 42.2 37.8
Cost per cancer detected £14,670 £10,288 Population = 1000
*inappropriate colonoscopies are assumed to be those performed in patients who do not have cancer, large polyps or IBD.
Economic outcomes
We performed a Monte Carlo simulation taking 10,000 samples and sampling from each of the distributions described in table 2. We present results of the probabilistic sensitivity analyses including the incremental cost effectiveness ratio (ICER) and incremental net monetary benefits (NMB). The model can calculate cost-effectivenes for a male or a female cohort using gender specific all-cause mortality data. The results presented here are for a female population but the results are very similar for a male population
Colonix No Colonix Incremental
Age Costs Eff. NMB Costs Eff. NMB Costs Eff. NMB
55 Mean £1,171 13.57 £270,214 £1,401 13.57 £269,990 -£229 -0.000263 £224
95% CI £782 13.26 £263,451 £1,022 13.26 £263,238 -£269 -0.001765 £234 £1,683 13.81 £275,437 £1,898 13.81 £275,190 -£191 0.001087 £213
65 Mean £1,166 10.24 £203,575 £1,396 10.24 £203,351 -£229 -0.000260 £224
19
75 Mean £1,168 6.75 £133,792 £1,397 6.75 £133,568 -£229 -0.000306 £223
95% CI £779 6.63 £130,835 £1,019 6.63 £130,648 -£269 -0.001216 £244 £1,665 6.84 £136,084 £1,874 6.84 £135,845 -£192 0.000432 £200 The following cost effectiveness acceptability curve (CEAC) and cost effectiveness scatter
plot relate to the PSA results for a patient of age 65. The willingness to pay threshold that may be used by NICE is £20K and the CEAC demonstrates that at this threshold there is little uncertainty around the decision that Colonix is the most economically attractive option. The scatter plot presents the cost and effectiveness results for each of the 10,000 samples of the PSA.
Acceptability Curve
Willingness to Pay
P
ro
p
o
rt
io
n
C
o
s
t-E
ff
e
c
ti
v
e
0K 50K 100K 150K 200K 1.0 0.9 0.8 0.7 0.6 0.5 0.4 0.3 0.2 0.1 0.0 Colonix No Colonix
CE Scatterplot
Effectiveness
C
o
s
t
We show one way sensitivity analyses of cost of Colonix test and the length of delay in diagnosis and Colonix test threshold. The first graph shows that Colonix test is cost effective if the test price is less that £375. The second graph (which uses the standard price of £125) shows that Colonix is the most cost effective if the the delay associated with a false negative diagnosis is less than 1.8 years.
Net Monetary Benefits
WTP = 20,000
Cost of the Colonix test
N
M
B
0.0 150.0 300.0 450.0 203.7K 203.7K 203.6K 203.6K 203.5K 203.5K 203.4K 203.4K 203.3K 203.3K 203.2K 203.2K 203.1K Colonix No Colonix
Threshold Value s:
Cost of the Colonix test = 375.2 EV = 203.3K
Net Monetary Benefits WTP = 20,000
length of delay in diagnosis (years) due to a false negative
N
M
B
0.0 1.0 2.0
203.6K 203.5K 203.5K 203.4K 203.4K 203.3K 203.3K 203.2K 203.2K 203.1K 203.1K 203.0K Colonix No Colonix
Thresho ld Value s:
length of delay in diagnosis (years) due to a false negative = 1.8 EV = 203.1K
21
Incremental Net Monetary Benefits
WTP = 20,000
Colonix test threshold
N
M
B
1.50 2.50 3.50 4.50 5.50 370.0
350.0 330.0 310.0 290.0 270.0 250.0 230.0 210.0 190.0 170.0
The following 2-way sensitivity analysis of the variables length of delay in diagnosis and Colonix test threshold is a strategy graph. The shading on the graph indicates which strategy (Colonix or no Colonix) is the most cost effective for each combination of test threshold and length of delay. As the Colonix test threshold increases the test is less sensitive so there are more false negative diagnosis and hence more patient who receive a delay in diagnosis. For higher test thresholds the length of delay for which Colonix is the most cost effective is shorter.
Net Monetary Benefit (wtp=20000.) Sensitivity Analysis on
Colonix test threshold and length of delay in diagnosis (years) due to a false negative
Colonix test threshold
th o f d e la y i n d ia g n o s is ( y e a rs ) d u e t o a f a ls e n e g a t
1.50 2.50 3.50 4.50 5.50 2.0 1.8 1.6 1.4 1.2 1.0 0.8 0.6 0.4 0.2 0.0 Colonix No Colonix
The following graph was calculated for a length of delay in diagnosis of 1 year as an example. It shows that the test threshold with highest net monetary benefit is 2 (although test threshold increments of 0.5 have been used). For Colonix test thresholds above 2.7 the most cost effective strategy is no Colonix in this case.
Net Monetary Benefits
WTP = 20,000
Colonix test threshold
N
M
B
1.50 2.50 3.50 4.50 5.50 203.4K 203.3K 203.3K 203.2K 203.2K 203.1K 203.1K 203.0K 203.0K Colonix No Colonix
Threshold Value s:
23
the model assumes that patients receiving a negative colonix result and whose underlying condition is NAD will not incur any further diagnostics costs. This assumption is unrealistic and informed opinions on the likely diagnostics such patients may receive when referred to an outpatient clinic are required to construct an accurate model.
Ne t M onetary Benefits WTP = 20,000
ost of additional diagnostics for patients with NAD and negative Colonix
N
M
B
0.0 300.0 600.0 900.0 203.6K
203.6K 203.5K 203.5K 203.4K 203.4K 203.3K 203.3K 203.2K 203.2K 203.1K 203.1K 203.0K 203.0K
Colonix No Colonix
Threshold Value s:
Discussion
The results calculated here use a length of delay in diagnosis following a false negative test result of 4-8 weeks and a cost of additional diagnostics following a false negative of £76(=cost of CT scan). The results show that Colonix is more cost-effective than a strategy of no
Colonix. The two strategies have very similar effectiveness but Colonix results in a cost saving of approximately £229 per patient.
The main concerns with regard to the economics of Colonix
The diagnostic pathways followed and diagnosis costs involved when a patient is referred to an outpatient clinic following a false negative need further research.
The economic case for Colonix arises from the ability to avoid unnecessary colonoscopies therefore reducing cost and increasing efficient application of the current constrained colonoscopy services. If a patient who receives a negative Colonix result subsequently receives a colonoscopy then that advantage is lost. Therefore in order to demonstrate the benefit of Colonix it is necessary to demonstrate that a feasible and effective alternative diagnostic pathway exists for people who receive a negative result. This information is not collected in the current studies.
The 2-way sensitivity analysis of the variables length of delay in diagnosis and Colonix test threshold explored this issue. Recall that as the Colonix test threshold increases the test is less sensitive so there are more false negative diagnosis and hence more patient who receive a delay in diagnosis. For higher test thresholds the length of delay for which Colonix is the most cost effective is shorter.
To take this issue forward we suggest three potential courses of action:
1) Collect further subjective clinical judgement relating to diagnostic pathways following a negative Colonix result.
2) Examine what information of patient pathways is obtainable from existing Colonix trials – i.e. what subsequent diagnostic tests patients received following a negative result.
3) Undertake a randomized control trial (RCT) to directly compare the two fully defined alternative diagnostic pathways (one pathway to represent the existing situation and one to include Colonix).
Colonix Test threshold
In a symptomatic population Colonix should be used as an exclusion test. It is important to ensure that cancer patients are identified by Colonix test.
It is important to have a high negative predictive value, i.e. the test must be highly sensitive and not miss any cancer patients.
In a screening populationthe emphasis would be on not having too many false positive results. It is important to avoid colonoscopies in healthy people. Hence the test needs to have a high specificity or equivalently a high positive predictive value.
Hence the optimal test characteristics will be different for these different populations. It will be appropriate to use a different threshold for the colonix test in these different populations. Calculating the most cost-effective Colonix test threshold should help to inform this decision.
Length of delay in diagnosis
25
IBD delay in diagnosis
The model currently assumed that IBD treatment costs and survival are not effected by a delay in diagnosis. Validation of this assumption should be obtained.
C Ferret will search on this issue
Compliance Rate
Due to its invasive nature colonoscopy has quite a low compliance rate – (80% Steele 2004 screening trial). It is thought that Colonix will have much better patient acceptability than colonoscopy and also that colonoscopy compliance rates may be higher after a positive Colonix result. As there is no information on Colonix compliance we have chosen to exclude the issue of compliance from our modelling.
Disutility associated with colonoscopy
Colonoscopy is an invasive procedure which requires prior bowel preparation and sedation during the procedure. For some patients the procedure is likely to cause anxiety. The disutility associated with colonoscopy is greater than that associated with the Colonix test but there is no evidence to prove this. For this reason this disutility has not been included in the modelling. A disutility corresponding to 1 day would be equal to 1/352 = 0.00274
Morbidity associated with treating perforations
The Surgical and Clinical Adhesions Research (SCAR) and SCAR-2 studies demonstrated that the burden of adhesions following lower abdominal surgery is considerable (Parker 2005). Patients undergoing lower abdominal surgery(excluding appendicectomy) had a 5% risk of readmission directly related to adhesions in the 5 years following surgery. This risk has not been included in the modelling.
Further work relating to NICE submission
To produce a NICE submission in line with the guidance laid down in nice methods of appraisal the following would need to be undertaken:
• A review of test characteristics of diagnostic tests involved in the pathway of diagnosing colorectal cancer. CT colonography, DCBE, CT scans possibly, etc
• Systematic review of QOL data etc.
• Obtain external validation of assumptions in the model structure
• Detailed description of the Colonix clinical trials
References
Allen E et al, The Evaluation of Rectal Bleeding in Adults: A Cost-effectiveness Analysis Comparing Four Diagnostic Strategies. J Gen Intern Med. 2005, January; 20(1): 81–90 Atkin WS. Single flexible sigmoidoscopy screening to prevent colorectal cancer: baseline findings of a UK multicentre randomised trial. The Lancet, 2002; (359) pp. 1291-300.
Barclay RL, Vicari JJ, Doughty AS, Johanson JF, Greenlaw RL.
Colonoscopic withdrawal times and adenoma detection during screening colonoscopy. N Engl J Med. 2006 Dec 14;355(24):2533-41.
C J A Bowles, R Leicester, C Romaya, E Swarbrick, C B Williams and O Epstein, A
prospective study of colonoscopy practice in the UK today: are we adequately prepared for national colorectal cancer screening tomorrow? Gut 2004;53;277-283
BNF55 British National Formulary, http://www.bnf.org/bnf/bnf/current/104945.htm Bressler B, Paszat L, Vinden C, He J, Li C, Rabeneck L. Colonoscopic miss rates for colorectal cancer. A population based analysis. Gastrointestinal Endoscopy, 2004; (59):AB110.
Cancer Research UK, http://info.cancerresearchuk.org/cancerstats/types/bowel/?a=5441,
2008
Curtis L. (2007) Unit Costs of Health Social Care. PSSRU, University of Kent, Canterbury. Gatto NM, Frucht H, Sundararajan V, Jacobson JS, Grann VR, Neugut AI. Risk of perforation after colonoscopy and sigmoidoscopy: A population-based study. Journal of the National Cancer Institute, 2003;(95) pp. 230-6.
Ness, R.M.1; Holmes, A.M.; Klein, R.; Dittus, R. Utility valuations for outcome states of colorectal cancer . The American Journal of Gastroenterology, Volume 94, Number 6, 1 June 1999 , pp. 1650-1657(8)
National Cancer Guidance Steering Group. Improving outcomes in colorectal cancer management. 2004. London, National Institute for Clinical Excellence.
Department of Health. NHS Reference Costs, 2005. Office of National Statistics Cancer Statistics Registrations, 2005.
Parker MC
,
Wilson MS,
Menzies D,
Sunderland G,
Clark DN,
Knight AD,
Crowe AM;
Surgical and Clinical Adhesions Research (SCAR) Group. The SCAR-3 study: 5-year adhesion-related readmission risk following lower abdominal surgical procedures. Colorectal Dis. 2005 Nov;7(6):551-8.
Selvachandran SN, Hodder RJ, Ballal MS, Jones P, Cade D, Prediction of colorectal cancer by a patient consultation questionnaire and scoring system: a prospective study, The Lancet Col: 360 July 27 2002, www.thelancet.com.
Smith G A, O’Dwyer P J, Sensitivity of double contrast barium enema and colonoscopy for the detection of colorectal neoplasms, Surgical Endoscopy, 2001, (15), pp. 649-652.
27
screening options for colorectal cancer Report to the English Bowel Screening Working Group. September, 2004.
Paul Tappenden, James Chilcott, Simon Eggington,Hannah Sakai, Jonathon Karnon,
Julietta Patnick. Option appraisal of population-based colorectal cancer screening programmes in England, Gut 2007;56:677-684
White TJ, Avery GR, Kennan N, Syed AM, Hartley JE, Monson JR.Virtual Colonoscopy versus Conventional colonoscopy in patients at high risk of colorectal cancer- a prospective trial of 150 patients. Colorectal Dis. 2008 May 3. [Epub ahead of print]
Appendix
NICE guidance on diagnostic technologies
Diagnostic technologies can be used in different ways (for example, for disease identification, monitoring of disease progression and treatment, assessment of disease prognosis, or initial screening) and this should be reflected in the evidence submitted to the Institute.
Evidence for the appraisal of diagnostic technologies should normally incorporate evidence on the accuracy of the diagnostic technology. It is also important to incorporate the predicted changes in health outcomes and costs as a result of treatment decisions based on the test result.
The general principles guiding the assessment of the clinical and cost effectiveness of diagnostic technologies should be the same as for other technologies. However, particular consideration of the methods of analysis may be required, especially in relation to evidence synthesis. Evidence for the effectiveness of diagnostic technologies should include the costs and outcomes for people whose test results lead to an incorrect diagnosis as well as those who are correctly diagnosed.
As for other technologies, RCTs have the potential to capture the pathway of care involving diagnostic technologies, but their feasibility and availability may be limited. Other study designs should be assessed on the basis of their fitness for purpose, taking into consideration the aim of the study (for example, to evaluate outcomes, or to evaluate sensitivity and
specificity) and the purpose of the diagnostic technology.
Prevalence – Thompson 2003
The high prevalence of rectal bleeding,7 8 changes in bowel habit,9 and abdominal pain10 in the community relative to the incidence of bowel cancer means that most patients with these symptoms are at very low risk of cancer. Many of these symptoms are transient or cause no alarm, and over 80% of patients do not seek medical advice.7–11 Of those who do, only 40-50% are referred to hospital.7 8 The risk of cancer in patients with rectal bleeding, for example, varies from 1:700 in the community8 to 1:30 in primary care,12 and 1:16 in a hospital surgical clinic.13 This means that 97% of patients seen in primary care with rectal bleeding do not have cancer.
As abdominal pain and change in bowel habit are more common than rectal bleeding,14 they will have even lower predictive values for cancer.
Formulae used in calculations
Together with sensitivity and specificity for Colonix/colonoscopy the cancer risk is used to predict the number of false positive, true positive, false negative and true negative results using the following equations:
test sens=True positives/disease test spec=true negatives/disease free True positive=test sens * disease True negative=test spec * (1-disease) False negative=(1-test sens) * disease False positive=(1-test spec) * (1-disease) Here disease = the disease prevalence in the population (could be cancer/polyp/IBD prevalence).
QUADAS tool
Was the spectrum of patients representative of the patients who will receive the test in practice? Were selection criteria clearly described?
Is colonoscopy likely to correctly classify the target condition?
29
or diagnosis?
Did patients receive the same colonoscopy regardless of the Colonix test result?
Was colonoscopy independent of the Colonix test (i.e. the Colonix test did not form part of
colonoscopy)?
Was the execution of the Colonix test described in sufficient detail to permit replication of the test? Was the execution of colonoscopy described in sufficient detail to permit its replication?
Were the Colonix test results interpreted without knowledge of the results of colonoscopy? Were colonoscopy results interpreted without knowledge of the results of the Colonix test?
Were the clinical data available when test results were interpreted as would be available when the test is used in practice?