This is a repository copy of Long Distance Business Travel and Mode Choice: The Results of Two Surveys of Business Travellers..
White Rose Research Online URL for this paper: http://eprints.whiterose.ac.uk/2341/
Monograph:
Fowkes, A.S., Johnson, I. and Marks, P. (1985) Long Distance Business Travel and Mode Choice: The Results of Two Surveys of Business Travellers. Working Paper. Institute of Transport Studies, University of Leeds , Leeds, UK.
Working Paper 211
eprints@whiterose.ac.uk https://eprints.whiterose.ac.uk/ Reuse
See Attached Takedown
If you consider content in White Rose Research Online to be in breach of UK law, please notify us by
White Rose Research Online
http://eprints.whiterose.ac.uk/
Institute of Transport Studies University of Leeds
This is an ITS Working Paper produced and published by the University of Leeds. ITS Working Papers are intended to provide information and encourage discussion on a topic in advance of formal publication. They represent only the views of the authors, and do not necessarily reflect the views or approval of the sponsors.
White Rose Repository URL for this paper: http://eprints.whiterose.ac.uk/2341/
Published paper
Fowkes, A.S. Johnson, I., Marks, P. (1985) Long Distance Business Travel and Mode Choice: The Results of Two Surveys of Business Travellers. Institute of Transport Studies, University of Leeds, Working Paper 211
..~
~ m r k i a j
-paper - 211 September 1985KING DISTANCE BSINESS TRAVEL AND MODE CHOICE:
THE RESULTS OF 'IWO SURVEYS OF BUSINESS TRAVELLERS
A S Fowkes; I Johnson and P Marks
I T S Working Papers are intended t o provide
information and encourage discussion on a topic i n
advance of a formal publication. ?Aey represent
the views of t h e authors and do not necessarily
A S FYXNES;
I
JOHNSON' a d P MARICS (September 1985)Loxq
Distance Wlsiness Travel and W e Oloice: The Results of Tvm Surveys of Business Travellers. Wrkhq-Paper-211; Institute for T r a n q g r t Studies; University of Leeds.This reprt contains a descriptive analysis of tw KK
sanples of lcmg distance business travellers. Each
sample m e d
the
same mailback quesitonnaire -.hi&asked for detailed inforination a b u t a recent long
distance business t r i p and a limited amnmt of socio-econanic data
£ran
each responaent. In particular; questions were asked about reasons forchoice of the main travel rode and the alternative mjdes available to the respondent. In both s q l e s it
was £ound that the main factors influencing mde
choices were jburneytime and a convenient s t a r t time;
w i t h the ability to work en route being a significant factor for rail travellers. Ocmpany travel ~ o l i c i e s
The p-se of this paper is to describe
the
results of twosurveys of business travellers. The same questionnaire was used
in each survey: however; the survey samples were drawn
differently. The two samples ccmprise the following groups of
travellers :
(1) R e s p d e n t s to British R a i l ' s East Cbast Main Line Survey
who were making a business t r i p and indicated they would be
willing to take part i n a f o l l m up survey. I n i t i a l
results £ran this survey were f i r s t reported
in
Johnson andFowkes (1984). We draw heavily £ran that paper, which i s
m w superseded by the present p a p .
(2) Bnployees of organisations situated either i n Greater Lcndon
or EJorth East -land. These business travellers were
contacted via their employer who was a respondent to our
e a r l i e r survey of organisatloris' travel policies. Results
of this survey are r e p r t e d in W e s and bhrks (1985).
Ebr corwenience; we shall refer to the sample of East -st Main
Line respondents as
the
ECML sample and. the respndents t o theorganisation based survey as the O H sample. Results
fmn
eachsample w i l l be presented together and. any similarities o r
differences ccmnented a.
An h p r t a n t objective of the tm surveys was to gain a better
rmlerstanaing of how d e choice decisions are made for business
travel. Thus questions were asked about:
( i) wfio makes these d e choice decisions
-
the traveller; t h ek l o y e r o r sane canbination of the tm?
( i i ) what factors influence d e choice am3
Imw
these factors aretraded off against each other?
I n connection w i t h the l a t t e r ; respndents were asked to answer a
s e t of questions in vhich they had to state t h e i r preference £or
travel by a i r ; f i r s t class rail; second class r a i l and car.
Respondents were presented w i t h different travel time and cost
attributes £or each of these modes and were asked to rank modes
i n order of preference. Anatpis of this data yields estimates
of values of business travel
time
savings i n tenns of thewillingness of the r e s p a t to pay for these savings. 'Ihe
derivation of these values w i l l £om the content of a l a t e r
paper. Here we report that data £ran the surveys which gives a
general description of business travellers and the nature of
journeys they make; an3 describes
Imw
mode choice decisions a r emade by business travellers and t h e i r employers.
*
We are grateful t o Dr Qwis Xash for helpful -ents one a r l i e r drafts of this paper.
2. ~ R O U N D M T H E S U R V E Y S
ITS began this research in March 1983 with funding frcm the
Science and Eragineering Research Cbuncil. The project arose
partly out of our awn interest in Business Travel and partly as
an offshcot t o the Department of Wansport's Value of Time
Project, in d c h we are also taking part. ?he particular
interest in Business Traveller's Value of Time arises because it
has conventionally been assuned to approximate the wage rate,
rather
than
-quarter of the wage rate as assuned for non-business travellers. If confirmed; this muld lead to travel-
tim+saving inves.tment schemes being favoured where; all else
equal, there i s a high proprtion of business travellers mrq
the beneficiaries.
The paroject i s directed by Professor Ken Gwilliam and Dr Chris
!3ash; whilst Dr Ian Johnscn; Dr ltmy Fbwkes and Ms P h i l l i p Marks
have been employed to organise the surveys and analyse the
results; respechvely. Mrs Judith Ellison has done m s t o f iihe
organisational work concerned with
the
East Coast B i n LineSurvey; while FDS (Market Research) Ltd were contracted t o carry
out the canpany based surveys.
An earlier wpblishea Mte Johnson and Nash (1983) set out our
i n i t i a l thoughts concerning our data requirements and original
survey methodology. In
the
event we have ccaducted three surveysas follows:
1. A telephone survey of sane 300 organisations i n order to
determine their travel policies; particularly a s these
affect mcde choice decisions. (See Ebvkes and i%rks (1985)
for Yne results of t h i s survey)
;
2. A self-canpletion questionnaire distributed by agreeable
organisations contacted i n 1 ) W e to staff who had
mdertaken business journeys of
over
50 miles i n the l a s tmonth. This questionnaire sought to see how the idividual was affected by h i s organisation's travel policy; as well as
obtaining information concerning a recent business t r i p , and
as- a hypothetical stated preference question a i c h muld
pennit inferences to be drawn a b u t the r e s m e n t ' s vdlue
of business travel time.
3. A self-canpletion questionnaire (almost) identical to that
i n (2) abcve; sent to respondenks to BR'S 1983 =st -st
Win Line (ECML) Survey m e then making a business t r i p
and indicated their willingness to be £urther interviewed by
3. SURVEY DESIGN
(i) East Bast Main Line Survey
In total; 820 names and addresses were abstracted £ran the MML
questionnaires; and we ackmwledge the help of British R a i l and
Transnark i n facilitating this. We were given to understand
that Transnark had already remwed a 10% sample of the canpleted
questionnaires for d i n g themselves; and t3mt further b d l e s
were a t various sections of BR which had claimed an interest i n
this or that train. Qch t r a i n had its own blndle; w i t h
separate bundles for each of the survey days. We avoided
weekend responses fran services because we were only after
business travellers. We concentrated on the morning and evening
trains between Kings moss and Scotland; Newastle; Yorkshire and
Hmkerside; i n b t h directions. Naturally there were problems;
not aided by the questionnaire storage office having no
artificial. light and it being January. Sane journey purp3se
answers were ambiguous; sane names and addresses were illegible;
and sane addresses were overseas and so outside our scope.
Clearly we should be very w a r y of claiming that our respondents
are a representative selection of MML business travellers. The
following p i n t s s b u l d be borne i n mind:
1. Initial contacts will be weighted by the frequency an
individual makes an MML t r i p . As each t r i p was different
( i f only on accomt of date) many people f i l l e d in more than
one ECML questicnnaire. EBwever; it is unlikely that everybody will have done this; so respn-dents to the EICMT,
survey w i l l p e b b l y be l e s s weighted towards regular
travellers than the sample originally approached.
2. Scme trains were so crowded that people may have been
'missed' by the survey staff.
..
3. Sane pmportion of those approached w i l l have refused t o
answer the questionnaire for various reasons &ich may be
important f o r our purpses
-
e ;g. a businessman too busyworking a t his seat;
or
taking b r a f a s t .4. Sane p m p r t i o n of those answering the questionnaire will
have wroqly indicated that Ehey were making a bminess
t r i p . We canpurded this by including sane respondents who
aid not indicate they wsre making a bwiness t r i p but vhere
other answers gave us to understand that they were likely t o
make business journeys.
5. Sane business travellers canpleting the EtBL £om will have
been mwillirg t o be further sumeyed;
6. Sane of those willing to be hrther surveyed w i l l
nevertheless have been unwilling t o provide t h e . means for
this to be done; namely provide name and address.
7. Sane names and addresses were illegible; overseas; or just
8. About 50% of the questionnaires we sent out were returned
canpleted. %%is included the effect of sending reninders
-.
to
about half of the addresses.As
we pstedout
thequestionnaires
in
tranches over time; it is not easy tocanpute the effectiveness of the reninders.
The questionnaire used is given
in
Appendix 1. These wereposted out to o ~ e r 820 addresses; wether with a FREEPOST
envelope dm* February 1984. This yielded a final sanple of
411 usable questionnaires of v h i c h 92% reprtd
on
business tripsmade in the first
4
m t h s of 1984.(ii) The Ckganisation Based Sample
The individual self canpletion questionnaire was answered by a
second group of business travellers w h were contacted at their
place of employment. Their employers were respdents
to our
canpny survey tho said they were will% to distribute
questionnaires to employees. The
method
of distributing thequestionnaires was left up
to
the employer; as we were advisedthat to do atherwise muld be impractical. Of the
questionnaires sent out to employers
442;
fran 110 employers;were returned adequate1.y canpleted for analysis. AS we do not
know how many questionnaires were distributed
by
employers; it isnot pssible to cannent m the respse rate or say a n y t h i q
definitive about reqgnse bias.
Survey fonns w e distributed
to
employersin
mch 1984 and; aswith the sample; 92% of business trips described by
respondents taok place in the first £our months of 1984.
Data describing the location size; itdustrial classificaticm and
travel policies of the organisations errploying the respndents to
the s w e y are given
in
I\ppendix 2. In brief; 60% of theseorganisations were sited
in
R~rth
Eist Ehgland; the rest beingin
Greater Lo&; and -it organisations (80%) belonged to the
private rather than the public sector. have1 policies of the
organisations varied w i t h 50% describing the policies as
iru3rna.l; 40% formal and the remainkg 10% said
they
hadno
travel policy.
In
suranary; the ECML sample is expected to be biasedi
n
favour offrequent business travellers and travellers who use rail rather
than ofher d e s . In ccmtxast
the
ORGhT sample should notcontain
any
modalbias.
The
question of whether each sample;or
both
samples canbind; can besaid
to be rmesentative ofbusiness travel
in
the U.K. as a whole hasnot
yet been exdned.Hsever; we
to
explore this issue later; using results £ranBefore we begin t o discuss the d e choice and business t r i p data
it i s desirable that the reader have sane view of the general
characteristics of the population we are dealing with; namely
business travellers. Since, seniority in the organisation and
the individual' s occupation may have a major inauence on mode
&ice decisions; we present information about the i n ~ n e s of
responaents; their occupational classificaticn; frequemy of
business travel and hours of mrk. The distribution of i n m e
for each sanple is given in Table I*. We were pleasantly
surprised in that both samples less than 2% of r e s m e n t s did
not answer the incane questicm; h u g h we must accept the
possibility that athers may have misreprted their income for
various reasons.
The
ECML sanple has a greater proportion ofrespondents reportkg high incanes than the ORChl sample. In
particular; 25% of the ECML sample canpared with 15% of the 0-
s q l e earned over &20;000 p r annm. Median incanes
for
thetwo samples are S14.375 p.a., for the MML data and S13,125 for
the 0W;N data. =er; the mean incane £Or the KML sample i s
S16;200 p.a. canpared with a mean h e of £14;800 p.a. for the
ORCN sample.
Fs has already been mentioned we expcted ECML resprdents to be
more frequent business travellers than ORGN responaents. This
i s confirmed by the data in Table 2 wkich gives respodents'
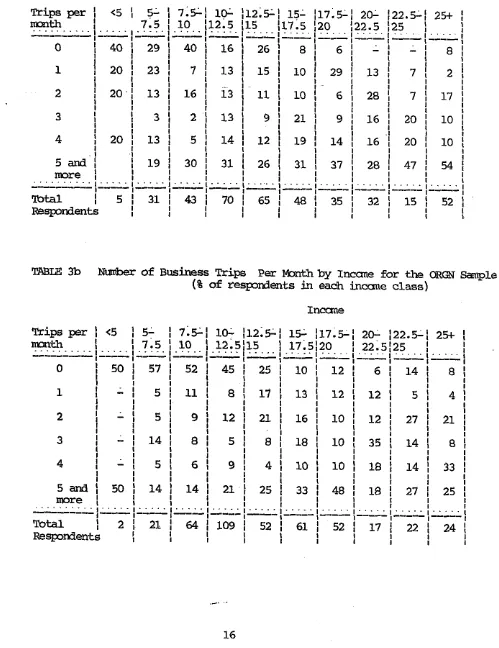
average monthly rate of business trip. Tabulating t r i p s per
m t h against incane shows there is a positive correlation
between t r i p £requay and incane (Xzstatistic i s significant a t
the
5%
level.) (See Tables 3a and 3b). lhus differences in theincane distributims for the two smples could be caused by
differences i n sampling prcceduces
.
For; as mentioned in theprevious secticm; we expected fcequentbusiness travellers to be
over-represented i n the KML sample.
Respondents were asked t o categorise their occupatim as one of
managerial; professional; secretarial; technical; manual or
other. Table 4a that wer 80% of responaents ( i n h-rth
samples) classified thanselves as having either managerial or
professional occupations; altbugh the MML data include a
greater proportion of professionals. James; Marshall and Waters
(1979) £om3 in their survey of r a i l and air business travellers
making journeys between London an3 Eewastle; that a high
proportion of professionals were university and other non-schaol
teachers. The 1- propxtion of professionals in the ORW
simple maybe because the establiskments which agreed t o answer
our organisation survey did m t include any educational
institutions. Table 4b gives mean inccmes for each occupaticm.
N o t surprisingly; managerial and professional staff have the
highest incane.?.. Because so f e w respanaents f a l l into the
secretarial; clerical; manml and other occupation groups these
OCcupaticns w i l l be amalgamated into a single
-
cj€her categary;throughout the rest of the paper.
Table 5 shows lmm respardents view their hours of mrk. 39% of
the ECML and 52% of the O H sample work fixed hours inplying
that approximately half of a l l respondents work flexible hours.
Respotdents were asked a series of questions about their
mst
recent long distance business trip. They were told that by long
distance we
meant
journeys of over 50 miles. Fran theinformation prwided w have evidence of the canplexity of
business trips; their purp3se; the md.e of travel
and
use oftravel
time.
As expected the main travel w e used £a the reprted t r i p
differed between the tm samples. MML responnents r e p r t e d a
rrmch higher p m p r t i o n of trips by rail (69% versus 38% in the
ORW sample; Table 6a) and correspandingly analler of
trips by car and a i r . In the KlML sample r a i l was the most
ccmonly used travel mile; whilst car travel was mst cannon in
the
O W sample. M y 1 ECML respndent and EO ORGN respondentstravelled by coach
an
the reported trip. W e r ; regardless ofthe main travel mde used; respndents i n
both
samples almostalways used the same mode on the outward and return stages of
their t r i p (Tables 6b
and
6c).
M *und a significant correlation beteen resmndent's i n a n e
and the main travel made used on the reported journey. In both
samples respondents with higher
incanes
are m r e likely to travelby a i r . Travel by either t r a i n or car is less clearly related
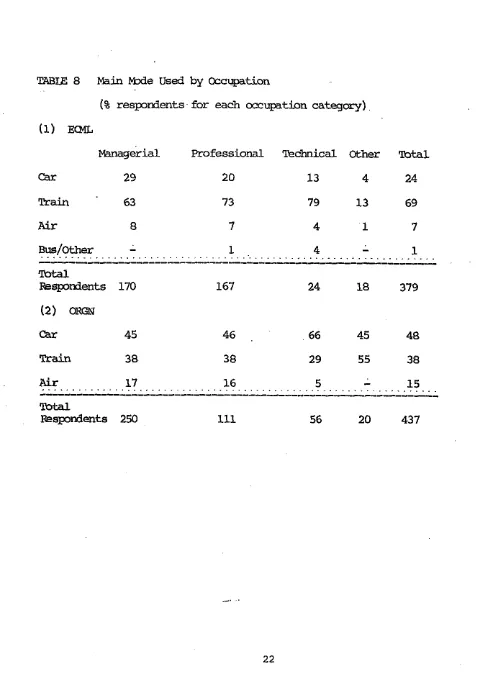
to incane (Table 7). W e used also appears
t o
be related t ow u p a t i o n ; with managerial and professional staff being rmre
likely t o use a i r than other staff (Table 8 ) . As with incane;
the incidence of car and txain use i s m r e equally spread across
the samples.
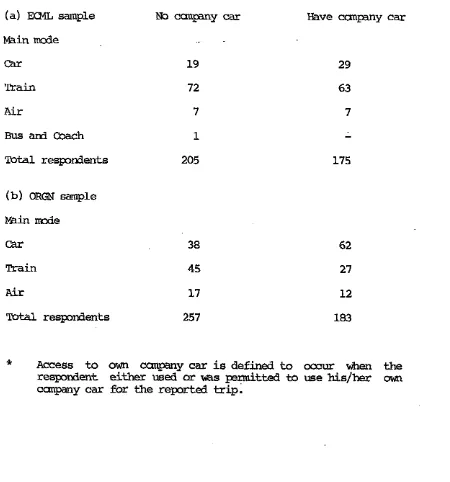
It might be expcted that respondents with their m canpny car
muld be more likely to have travelled by car on the reparted
business trip. moss-tabulatjng main mde used against access to
cwn
canpany car (this includes people who either used their awnocmpany car or vjho muld have been m t t e d to use their m
canpany car) sl.aws that ORGN respandents with their
awn
ccmpanycar were m e likely to have travelled by
car;
hereas this isnot the case £or MEIL responaents. (See Table 9) The l a t t e r i s
most probably because of the rodal. bias (towards rail) in the
MML sample; caused by the -ling procedure.
Table 10 slows the types of car used by car travellers. Each
sample has dlrost the sane distribution 05 car types; w i t h
approximately half the respondents u s i q a canpany
car
andfurther quarter using their own car. Using the standard errors
given in Table 10; one finds that the proportions of respklents
using a particular category of car i n each sample are
not
We asked respndents to give information, about each meeting
attended on t h e i r
most
recent business t r i p . Up t o 3 meetitqswere coded for each individml and only 7% of the MML sample and
8% of the ORGN sample attended 3 o r more meetings (Table 11).
Unfortunately the purpose of meetings attended by 28% of the OR@
sample was not reported. Only 1% of the MML respondents did
not reprt meeting p m p s e . To ccmpare the tm samples we have
remxred the 'purpose unspecified' data and the ranaining
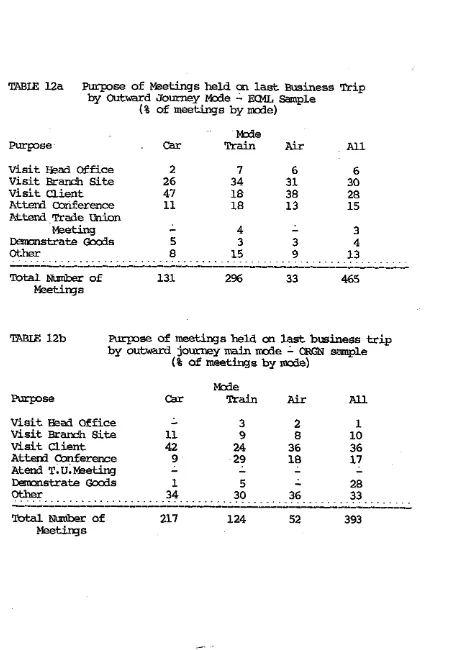
respsnses are given m Tables 12a and 12b. Over one third of
the MML respondents attended meetings related to internal
canpany business (i .e. visited the head office or branch s i t e )
.
Tnis p r q r t i o n f a l l s t o about one tenth in the ORGX sample &ere meetings are more l i k e l y t o involve either visiting a c l i e n t or
be for sane other putlpse. lhose travellers visiting a client
were more likely to travel by car; rather than by t r a i n o r a i r .
Travel to conferences; the head office and to demonstrate goods
was more likely
t o
be by gain. The d a l s p l i t was more wenfor other journey putlpsrs.
Despite the differences we have f o w l i n the distribution of mode
used and p q s e of business travel for the 2 sanples; their
distributions of nights away w e very similar. (Tables 13a and
13b). Approximately half of each sample were making day t r i p s
and air travellers; who probably travel greater distances than
travellers using other modes; were more likely t o be making t r i p e
last* more than one night. Nearly 208; of respondents Mnbined
2 o r more meetings i n t h e sane t r i p (Table 11). Tkis and the
nature of sane of the meetings; for example; conferences and the
inclusion of sane overseas travel; explain the considerable
length of time scme respndents were away
frm
their office.7
ofthe
ECML and 32 of the ORGN respondents reported an overseasbusiness t r i p . Oarrparing the data in Table 13c with that i n
Tables 13a and 13b
sbws;
as expected; overseas t r i p s involvedmore nights away. In addition; we note that 70% of the E3L and
a l l
the
O M werseas t r i p s were made by air.Tables 14a and 14b report meals taken i n the course of: the
business t r i p . ECML respondents;
on
a l l modes; were more likely.
to have eaten either a lack o r a meal than O W reqmndents;
h j h fewer of t h e former ate a m a i n m e a l other than breakfast;
This probably r e f l e c t s the earlier starting times of the M'ML
respondents (see below)
.
Tne s d question in our swgr asked travellers to give
d e t a i l s of each s w e of t h e i r reported business t r i p including
for each stage; the start time; a q i v a l time; means of travel;
and where they travelled t o
and
fran. This question was poorlyanswered; primarily because the questionnaire instructions did
not make it clear that data for the whole of the business t r i p
was required. Many people only gave details for d a t appeared to
be the f i r s t haLf of t h e i r business t r i p . Nevertheless; data on
journey start time is recwerable for most respondents. % i s
As we are interested in the amount of travel done outside normal
working burs the data is gr0Upea i n naMower time b a s outside
the
'
m ~ m a l . mrking hours' of 9.30 1 5.00 pn..
(Approximately3/4 of each sample nonually arrived a t m r k %ween 0.800 and
09.30 and a similar proportion l e e w r k betwen 17.00 and
19.00)
.
MML respondents started their journeys slightly earlierthan the O X N resp3ndents; thDugh i n both samples over half the respondents started the reported business t r i p before 08.00 (68%
in MML ard 55% i n oRGN): that is outside 'normal' working
hours.
To gauge whether our respondents used their travel time
productively or not; we asked how much of this time they spent
wrking and whether this work could have been done quicker or
slower in the office. Before reporting the answers to these
questions we note Ensher' s ( 1977) finding frcm a survey of a i r
travellers that:
'employees did not w i s h to create an impression that they do
not work during their travel time; and definitely not an
iupression that the work undertaken is not a s pcductive a s
the m r k undertaken a t the office i n an equivalent a u n t of
time'
.
%is suggests answers to questions about work i n
the
course oftravel may w e r s t a t e the m u n t of time spent mrking and
its relative efficiency. This dmuld be borne in mind vhen
interpreting our results.
As expcted a high p r o p x t b n (over 80%) of car travellers did no
mrk i n the course of travel; alhough those who did work spent
a t least half an hour w k i n g . Wain travellers m e moat likely
(in bath
samples) to have worked on the outward and returnt r i p s (Tables 16a
and
16b; 17aa d
17b). Of those *aVellers vhor e p r t e d -king; t r a i n travellers vmrked
x
longest.Travellers making day t r i p s were more likely to have worked than
those making loi-ger t r i p s . Also; people were l e s s likely t o wmk
on the return than on the outward journey.
%st travellers thDught the work they did en route would have
taken about the same length of t i m e i n the office (Tables 18a and
18b). In the KML sample 27% of respmdents thought they worked
slawer on-vehicle
than
in the office and 12% thought they wrkedfaster. Similarly
in
the ORGN smnple a b u t twice a s manyrespondents t i b u g t s they mrked slower rather
than
faster than i nthe office (13% and 6%; respectively). People vjho said they
mrked faster vlnilst trave1lh-q wuld have pres-ly been
interrupted more often when working a t the office. w e r ; we
remind the reader our results may contain a bias towards
werstatanent of the prcductivity of work done i n the course of
travel; because of the reswndent's desire to appear to be using
travel time prcductively.
About 90% of respm?ents travelled to and frcm their meetings
that the time the traveller spent mrking might be influenced by
the n&r of colleagues accanpying him/her. In f a c t a s the
data in Table 20 show; time spent mrking varies very l i t t l e
according to wfiether the traveller i s accanpanied o r not.
Next consider the effects of speeding up business travel on
the t r a v e l l e r ' s use of time. To do this we asked repondents t h a t
they muld do i f their l a s t business t r i p could have been
scheduled t o start 30 minutes; 60 minutes and 90 minutes l a t e r
than originally planned. OpsxGended respnses were allowed and
this prdmed s m e quite canplex answers vhich m e not easy to
tabulate. Also; a sizeable n&r of respondents missed the
p i n t of the question
am3
respnded with replies such as ' I woulds e t out l a t e r ' or ' I muld catch a l a t e r t r a i n ' . Tables 21a and
21b include only people tho gave answers close to one of the 5
l i s t e d responses: stay i n bed; have a meal; work; do danestic
tasks and do nothing.
Given our e a i l i e r finding at most journey start times were
before nonnal wxk start times; one muld expect
time
savings of30 and; possibly
also;
60 minutes to be used £or mnlworkp-ses. The data c o n f b s this; w i t h l e s s than one third of
both samples reporting they muld w x k i f their meeting started
30 minutes l a t e r than originally scheduled. m e fraction who
would m r k increases a s the delay i n in s t a r t time of the
meeting increases. Also; as the delay increases andller
proportions of people rep* d o h nothing and stayins i n bed.
The proportions of respondents r e p r t i n g having a meal o r doing
danestic task is f a i r l y insensitive to the meeting start time.
We conclude £ran this evidence that for many travellers business
travel
time;
a tthe
margin; substitutes for leisure a c t i v i t i e srather than work. Canparing the data for the two smples
shaus
that resp3ndents
to
the oRGN survey w e more likely;fhan
theEXML,respandents t o w m k i f themeeting timewasdelayed. It
i s
possible this r e f l e c t s the earlier starting
times
of the MMLrespndents
.
Lastly i n this sectionwe r-rt on the cost information given
£or the r e p r t e d journey. We asked £or information on travel and
ofwr costs incurred;, a d
also
for the value of reimbursementpaid by the enployer.
No
explanation was sowht for anydifferences between costs incurred & r e h h u r s e m ~ t levels. In
t h e discussion below we
*us
only on t o t a l costs.Allowing a margin
£or
r-rting error of+/:
S ;
67% of the EtMLsample and 69% of the ORGN sample reported having all costs fully
reimbursed by their emplwr. For the remining respndents
there does m t appear t o be any systenatic
bias
towards eitherunder or over claiming for expnses
able
22).
Underclaiming for expenses m y have cane h u t because sane t r i p
costs were incurred £or personal a d not business reasons.
Exever; it is also lpssible the data here is misleading. I f the
employer had not directly reimbursed the traveller for; say;
paid);
then it is possible the cost of this ticket wuld berecorded as a travel cost but not as part of the anphyer's
rehbursement of costs. In this case the traveller wuld appear
tobe urderclaiming for expenses.
Evidence in support of this m j e c t u r e
mnes
fran the nunber ofresponaents who
relprt
mn-zero travel costs and zero levels ofreimbursement.
Tnis
pattern of costs and reimbursement wasreported by 8% of the EXMt S W l e and 3% of the ORGN sample. I n
addition 4% of the I3CML sample and 2% of the ORCN sample reported
mn-zero other costs and zero reinhursement for these costs. ~t
i s likely sane travellers have mt reported
-
a1costs paid by the employer for&ir
business t r i p .'Overclaiming' of expenses could be the result of organisation
reinbursanent practices such a s paying expenses a t a fixed rate
(w.
a car mileage rate; the cost of a given N l i c trans-mode) and letting the ixdividual choose the t r a n s p r t mode.
&never; we did m t find any significant correlation bebeen mode
used and 'overclakning' of expenses in either of the 2 s q l e s .
Of course; we cannot discomt
the
possibility t h a t sanetravellers are actually overclaiming for expenses. I f those
people vho w e werccrnpsated for travel expenses were added to
tlaose Gno received f u l l canpensation
we
get that over 80% of eachsample were a t least fully canpensated for their t r i p exmnses.
Ran this it seems safe
t o
conclude that employers generally payfor all costs associated w i t h business travel; Needless to say;
there i s likely
to
be a bias i n our data against r e p r t i n guverclaims
.
A priori one would expect employers to p y for a l l the
costs
ofbusiness travel. That our data include
a
sizeable nmber ofrespondents either over or derclaiming
an
these costs throwsdoubt on the r e l i a b i l i t y of the reported cost data. This may
l i m i t planned used of the data for revealed peference analysis
of mode c b i c e decisions.
6 ; MODE CHOICE
A major objective of this study is
to
gain a better mderstandingof the ways i n which mode c b i c e decisicns are made for business
travel. Respondents m e ; therefiore; asked for reasons vhy they
chose their main mode of travel. Onpny palicy was l i s t e d as a
possible reason here so as to a l l o w for the p s s i b i l i t y that the
individual did not have a £ree choice of travel made. As the
reasons given for mode choice differ by mode used
w
discuss
theresults for each mide separately.
Gkf-k-taD&lefs. Qnvenient start
time
was the mst emmn reason (in both 8amples: Tables 23a and 23b) given for travel by car.The next mst important reason was shart journey
time.
12% ofthe MML
am3
29% of E h ORChT car travellers used the car becauseit was c-y policy. n u s mst car travellers chose this nn3e
h p r t a n t factor influencing ncde choice; but rather were asked
to indicate whether their male was chosen because it was the
cheapest £or the t r i p they were makirq; f i e car was the cheapest
mode for 16% and 23% of the ECML and ORGN samples; respectively.
Air' travellers: These travellers flew to and fran their meetings
because of the short journey time and mvenient start time of
flights. Very few a i r travellers were constrained by canpany
policy when deciding on their means of travel. This is probably
because a i r travellers typically have high incanes and so are
likely to hold important p s i t i o n s within their organisations.
W~in-t?%DellWS; Over one third of each sanple reported
ckasing to travel by train because of the convenient start time;
short journey time and being able to wxk on the journey. It
should be recalled that train travellers rep& doing more mrk
than people travelling by other mdes (Tables 17a; 17b). The tm
samples differ in the imprtance of canpny travel policy i n
determining lrade choice w i t h 18% and 33% of the MMt and ORGX
samples; respectively; using the train fjor this reason.
Thking the results £or all mcdes together we find that
convenience of start time and h r t journey time were the mst
h p r t a n t determinants of mcde choice although; as has already
been mentioned; canncrt rule out the imprtance of cost
because this would only be mentioned i f the chosen mcde was the
cheapest. (Xlr results do suggest; howwer; that canpany lplicy
does m t in general dictate M e choices for business trips.
Tnis does not; of course; mean c a n p y policy has no influence on
mcde choice for it may limit the s e t of alternatives available to
the business traveller. We ~ Q W consider this issue further.
We asked respodents which modes they muld have been pennitted
to use on their reported journey. The responses are tabulated
against the &e used i n Tables 24a and 24b; A anall percentage
of travellers reprted mt being allowed to use the mode they
travelled cn. A possible explanation for this may be that they
bere paying the extra travel exFenses themselves so as to use a
preferred mode. The data £or both samples sW:
(i) Almost a l l travellers muld be prmitted to travel by
train. A snaller fraction of ORGN; as canpared with
ECML; resmndents reprted being all- to use r a i l
travel. This is; in part; because there are more
overseas ( a i r ) travellers in the ORcX sample (see the
footnate to Table 24b). We were not able t o fird an
explanation for the difference between the 2 samples i n
the fraction of car travellers pennitted to use r a i l .
This s not related to differences in either the
n-r of meetiqs; their lccaticn; or the ownership of
a canpany car.
( ii) Train users are more likely
to
he allowed to travel by(iii) A l l travellers are least likely to he permitted to
travel by coach; presunahly because it is a
conparatively slow means of travel.
( iv) Relatively mall proportions of a i r travellers are
all& t o we either car or r a i l travel for the
reported trip. This may be because employers wanted
these employees to minimise travel time.
In Tables 25 and 26 we have tabulated permitted modes against
incane and occupation, respctively. Access t o a i r and 1st class
r a i l travel rises nuticeably with incane. Managerial and
professional staff have better access to a i r and first class r a i l
travel rhan other classes of employees. For the remaining
occupation groups access to car and rail (1st and 2nd class)
travel i s r 0 ~ h l . y the same.
In our view the mst h p r t a n t p i n t made by the data in W l e s
25 and 26 i s that access t o travel mocles deperds on the
traveller's inccme and occupation. Additional information about
mcde choice sets was gathered by asking respondents for their
best alternative mde for making the reprted t r i p (Tables 27a
and 27b). 11% and 19% of the ECML and ORCN samples;
respectively; reported they had no best alternative. Tnis was - % -
m s t often the case for car users in the MML sample and, car and
air users i n the ORGN sample. That car u s e r s were most likely to
have
no
alternative means of getting to their destination ispresunably because the limitations of the public transport
network
(ie.
its
d l e r size and more rigid departuretimes).
The lack of alternatives for a i r travellers in the CWGN sanple i s
largely explained by psople travelling overseas. 82% of a i r
travellers reporting no best alternative here were travelling
Overseas.
Tables 28a and 2% show Hhether the best dlternative to the d e
used was i n the traveller's choice set. Almost a l l respondents
whD minated either the car or tlze train as their best
alternative were permitted to use these mcdes. ThDse who chose
air as their best alternative fared less w e l l ; with 72% and 59%
in the MMt an3 ORGN samples respectively being allowed to travel
by air.
Respodents whose best alternative m s car were asked w h i c h types
of car they wuld use. Respmses £or the 2 sanples were very
similar (Table 29) w i t h ; in both cases; 41% of respndents be-
able to use their
own
canpany car and nearly 5Q% having access toa private car. (Note these 2 categories are m t rmrtually
exclusive.) Inspection of the standard errors given in Table 29
shows
that the proportions of respondents w i t h access to a particular catqcay of car are not significantly different ( a tthe 5% level)
in
thetwo
samples.Focussing briefly on the choice between car and r a i l travel we
found; £or both samples;
m
significant difference in the nm%ersamples) t r a i n travellers were far m e likely than car
travellers to have meetings in London (difference significant a t
the 5% level) and attended significantly f e w r meetings than car
travellers. I n the ORGX; but not the E W ; smple t r a i n
travellers (Table 30)
;
were accanpanied by more colleagues thancar travellers. These results suggest that i n addition to the
reasons for mode choice l i s t e d i n m l e s 23a and 23b one could
add meeting( s) locaticm; the n-r of meetings t o be attended
and p s s i b l y also the n-r of p p l e travelling to these
meeting( s)
.
This paper has had the limited aim of providing a detailed
descriptive analysis of the tm surveys i n question
-
overallconclusions £ran the study w i l l be r-rted separately.
The tabulated results shw that we have a very special s e t of
respondents. Our
tw
samples of business travellers arepredaninantly cunprised of managers and professional people w i t h
ahme average incanes. We wish t o en@asise again that we have
tnt yet explored whether the two samples are representative of
business travellers as a *le i n the rmnited Kingdon.
The majority of business t r i p s reported involved setting off
before 8.30 and attending a single meeting w i t h a client or for
internal canpany business. The main factors influencing choice
of mode for the t r i p s e e journey time and a convenient
departure time; w i t h the a b i l i t y to work en route being a
significant factor for r a i l travellers. F a i l was m r e likely to
be used for journeys to Londan;
and
l e s s likely tobe used whentw or more meetings were involved.
Canpany travel policies appeared t o be a significant influence on
mode choice only in a minority of cases; altlnuggh generally only
more senior people were permitted t o use a i r ; and sane car uses
were not permitted the alternative of rail;
Both the early departure time
and
the fact that respondents r e ~ r t e d that l e s s than half of the t h e released by a postulatedl a t e r departure
time
w u l d be used for work suggest t h a t aconsiderable proprtion of business travel time i s a t the expnse
of leisure time. Moreover r a i l users tended t o work
cn
averagearound one hour on the outward journey and £or half an hour on
the return. Both these factors suggest that the simple 'wage
rate' approach t o valuing business travel time savings is
inappropriate for these sorts of journeys.
On our questionnaire there are further questions; the replies of
which are not reported i n this ppr. Analysis of these questins
(in particular; questions 2; 13-16; 19) is currently undermy and
results w i l l be reported i n subsequent papers; where we shall
also bring together this ani the evidence on the factors
influencing mode choice and the value of travel time for business
TABLE 1 Reported Salary (per annm)
Range
Less than £S;OOO £5;00l
-
27;500 £7; 501 1 21O;OOO £10;001-
£l2;500£12; 501
-
215;OOO £15; 001-
217;
500 217;501-
E20;OOO &20;001-
f22;SOO £22;501-
£25;000 Over 225; 000TOixL
TABLE 2 Average Rate of Business Trips
M'ML
Respondents %
Less than one per month 67 17
One per month 50 13
mopermonth
Three per month
Four per m t h
Five or more
ORGN
[image:19.605.78.557.151.816.2]TABLE 3a Mnnber of Business Trips Per Wnth by Incane for me
E61L Sample (% of respdents in each incane class)
Incarte (£OOO/annm)
TABIE 3b
N m h rof
Business Trips Per Y m t h by Incane for the O l x m Sample(% of respmlents i n each incane class) Ineane
Trips per
1
<5 )5-
mth I
. . . . , . , . . . I
I
7.5---
I-:--
I
---
0
f
501
57I I
I I
1
1 - 1
55 and
I
501
14mre
I
. . . . I . " . . I . . .
I
1---
1----
[image:20.613.52.551.153.801.2]TABLE 4a Occupation Category
category
Managerial Professional Secretarial Clerical Technical.
Manual
Other
Not given
TABIE 4b &an Incane for Different Occupatiom
Managerial
Professional.
Secretarial
Clerical
Technical
Manual
Other
T o t a l
I n m e
(%Iiiwlim)
ECML ORGN
18; 600 16; 200
15;lOO 14;700
11; 300 12; 100
9;lOO 8;800
12; 900 10; 600
6;400 6;400
W I E 5 Nature of hbrk I-Iows
KML
ReswfYlents
-
8Fixed hours 149 39
Flexitime 100 26
Work as required 128 33
Other 10 3
- - -
T o t a l 387
ORGN
Responaents
-
%225 52
116 27 90 21
TABLE 6a Nain %ans of Travel for 011t-d Journeys
(% of respoIrlents)
Car 23 48
Train Bus-Coach
Air ..~ 7 15
[image:24.628.83.484.106.291.2] [image:24.628.73.511.309.787.2]. . .
...
T o t a l Res?g.ondents 41 1 442
TABLE 6b b5ait-1 Means of Travel for Gutward and Return Journeys
for the ECML Sample
Return
I
Outward . . . Car h a i n BusiBach Air
I
TatalI " ' " ' ~ ' I
---
I
Car 86 2 1 0
I
89i
Train 6 251 0 4 261
I
1
Bus~Coach 0 0 1 0
I
I
1
I
Air 0 1 0 27
!
28i
. . .
- _ _ _ _ - - - _ - - - _ _ _ - - - ~ - - - ~ ~ ' - ' ' ' _
I
---
T o t a l 92 254 2 31
I
379TABIE 6c Wiin t4ans of Travel for (kttvmrd and Wturn Journeys for & ORGW m l e
Return Car Train Air lbtal
Outward . . .
...
Car 206 4 1 211
Air 1 4 59 64
...
. - - - -..-
'IIABIE 7 Main kbde Used (Outward) by Incane (8 of reslpndents in each i n m e group) Incane (£OOO/annun)
( 1 ) ECML
1
< 5 1 5 -I
7.5:; 10- 112.5-1 15- 117.5-1 20- 122.5-1 25+ I ~ o t a l /I
1
7.5
1
10I
12.51151
17.51201
22.5125 I I I. . . . . . . . . . . . . . . . . . . . . . . . .
---
1-
----
I I I I I . . _ . _ I I---, - . . . .I
. . . I . . . II
----
I ---I--- I--- II ----I
----
I---
I---
ICar I I 20
;-;TI
21I
33I
11I
311
12I
201
47I
31I
24I
I
I
I II I
I I I I I I I I I I I I I I I
I
Train
I
7 7 1 7 4 ! 6 6 1 7 9 1 6 1 1 7 3 1 8 0 : 4 0 1 5 0 1 6 8 1I
I I II I
I I I
I
I I I II
I I I I I IAir
I 'I
-
4 1 5 1 2 1 8 1 8 1 1 2 1 - II I I I I 1 3 1 1 9 1 7 1
I
I
!
I
I II
I I I 1I . I . I
' I
Bus and
I
-
I
-
I-
I-
1 2 1-
- I I 3 1 1 1I- I
I !
I I I I I I I 1 1 :
-
. . .I
II
I I I II
I II
I. . . I
--_-__
1 . . .1-
--
1----1----1----1 I " ' I----I---)IL--;-II-l I---
' . " - ITotal
1
51
261
42I
67I
621
49I
33I
30I
151
48I
377j
Respndents
I
I
I
I
I
I I I I I I I II
I ICar ! 50
I
Air I I
TABLE 8 Main M e Used by Occupation
(% r e s p d e n t s for each occupation category)
m g & i a l Professional. Technical other 'Ibtal
Car 29 20 13 4 24
Train 63 73 79 13 69
Air
8 7 4 1 74
[image:26.619.49.528.158.835.2]~us/Other . . .
-
1-
1...
Total
Iksp3tdents 170 167 24 18 379
Train
38 38 29 55 38Air
. . . 17 16 5-
15...
Total
TABLE 9 Main m e Used by &cess to (Xrm Osmpany Qr*
(% of respondents with/without canpany car)
(a) ECML sample -WY Illve
c a n m y
carMain lMde
Qr 19 29
Train 72 63
Air 7 7
Bus a d Ccach 1
-
Total respndents 205 175
(b) ORGN smrrple !&in mode
Car
Wain
?sir
Total respordents
*
Access toown
Canpany car i s defined to occur when the respandent either used or was wnnitted to use his/hero m
[image:27.611.81.531.198.680.2]W L E 10 Cakegory of Car Used by Reqnndents Us* Car h r
Outward Journey
ECML
o m
Respndents % Respondents % s.e.(%)*
Car passerger 10 11 28 13 (1.9)
pool car 2 2 7 3 (1.0)
Hire car 4 4 10 5 (1.2)
*
In this c o l m standard errors ( 6 ; e ; )for
the ~ o p r t i o n ofrespondents using each categmy of
car
are given. These standard errors are ccmpuked; assuningboth
samples cane£ran
the same ppulatim; withthe
foxmula:TABLE 11 N i m b x of Meetings Attended m Rep3rted Business Trips
N m h r of Meeengs ECML Sample ORGN M p l e
Respsndmts - % ReS@rldt?ntB
-
%1 324 81 351 81
2 48 12 45 10
3 or more 30 7 36 8
[image:29.611.72.566.219.813.2]TABLE 12a Purpose of Meetings held on last b i n e s s Trip by Outward Journey Mode
-
ECML Sample( % of meetings by mode)
Mode
.
Car
Train Air A l lV i s i t &ad O f f i c e 2 7 6 6 V i s i t Branch Site 26 34 31 30 V i s i t c l i e n t 47 18 38 28 A t t e r d Coriference 11 18 13 15 A t t e n d , Wade mion
*eting
-
4-
3Dancnstrate Gccds 5 3 3 4
[image:30.616.73.527.111.761.2]Other . . . 8 15 9 13
...
Total
m&er
of 1312%
33 465Meethqs
TABLE 12b puTp3se of meetings held on last bwiness trip by outward journey main mcde L sample
(% of m e e t i n g s by male)
Mode
Car R a i n A i r A l l
V i s i t Bad O f f i c e
-
3 2 1 V i s i t Branch S i t e 11 9 8 10V i s i t Client 42 24 36 36
Attend Conference 9 29 18
-
17Atend T.U. Meeting
-
-
-
Demonstrate Gods 1 5
-
28Other
. . . 34 30 36 33TABLE 13a M m h r of Nights on Last Trip; Broken
Cown by Main ECML sample
(% of those r e s w i n g )
Nights away Car Train Air All m e s None
1 2 3 4
5 6-7 8-14 15 or more
TABLE 13b N m h r of Nights Spent Away on Last Trip; Broken
E n m
by &in Mdle (outward.) OR^ Sample(% of those responding)
Nights away Car Train Air A l l n-cdes
None
1
2
3
4
[image:31.611.61.520.60.809.2]?aBIE 14a *als Taken
(mt
mutually exclusive): EXML Sample (% respondents for each mcde)Percentages
Car out
Car return
Train out Train return
Air out Air return
All mcdes out All mcdes return
[image:32.628.56.566.87.816.2]Snacks O t h e r & None only Breakfast m e a l
TABLE 14b Mals Taken (not mutually exclusive)
ORGN Sionple (% respndents £or each mcde)
Snacks Other main
None only Breakfast meal
Car out Car Return
Wain out
Train
Return
Air
Cut
A k
ReturnTABLE 15 Journey Start Times
(% Respondents)
1830
-
2359 2 101 1- - - - - -
mta1
-
-
[image:33.613.67.500.137.574.2]TABIE
16aTime
Spent Fkrking %lst Travelling;Broken
~XWI byM e
-
ECML Sample (% respondents by mcde)(NB. excludes one matorist claiming 300 mins
out
and500 mins return. )
Minutes Wrked ,
&an
£or&se Overall W e Mne 1-25 30-55 60-110 1 2 W m k i m Mean
Qr
out
807
12 1 0 29 6Car return 82 6 10 1 1 26 6
Train out 23 4 18 40 15 72 55
Train return 43 10 19 20 8 57 33
Air out 38 , 8 23 23 8 52 32
Air return 50 11 18 14 7 51 25
All d e s
out
38 5 17 30 10 68 42All mcdes
return 53 9 17 15 6 54 25
WE3 16b Time spent
w w
Whilst Travelling; ~roken ~ 3 w n by M d e ORCN Sample ( % respordents by male)Minutes worked Mean
for
OverallW e tlmse mean
Nme 1125 30-55 60-110 1 2 W waking (mins) (mins)
. . .
...
DuW 86 6 5 1 2 54 8
Car Return 88 4 4 2 2 54 7
Train Cut 34 15 19 13 19 81 53
Train Return 6 16 21 8 63 32
Air Cut 42 28 17 5 8 56 33
Air
Return 54 5 2 10 3 50 23All lvbaes a t 60 12 12 " '6 10 71 28
All M e s 68 5 12 10 5 58 19
?aBIE 17a Time Spent Wrking Whilst Travelling cm Cay Trips;
Broken
mwn
7
M e-
MML W p l e (% r e s p r d e n t smrking
W
modeMinutes Wrked Mean for Overall
those mean
-king (mins)
W e . . . None 1-25 30-55 60-110 12Ot (rnins)
...
C a r out 73 11 1 4 2 0 - 30 8
74 1 0 12 2 2 42 11
Train out 20 6 18 45 11 66 53
Train return 29 13 23 22 3 48 29
Air
out 25 1 3 25 37 0 43 32Air return 5.0 0 25 13 13 63 31
All mdes out 32 7 17 35 8 62 42
A l l modes return 48 12 20 17 3 48 25
NB; The s i z e of the r sample was orily 8 r e s p d e n t s .
TAEUE 1% Time Spent Wrking Whilst Travelling on Cay Trips;
Broken JDm by W e CRGN W p l e (% r e s p d e n t s
mrking by mrde)
Minutes frJorked Mean for Overall
those Mean
mrking (mins) W e . . . Eone 1-25 30155 60-110 12Ot (mins)
...
Car out 89 4 4 3 1 42 4.6
Car return 88 4 5 1 2 52 6
Train out 24 4 15 40 17 76 57
Train return 39 8 21 24 8 48 35
Air out 46 14 27 9 5 40 22
Air return 62 1 4 1 9 5 0 57 13
A l l d e s out 61 5 11 17 7 65 25
A l l modes 68 7 12 9 4 35 16
.-, ..
TABIE 18a Difkrence i n Time Taken to do Work on Journey and Time Taken in Office
-
EXML SampleSame work takes longer in office 47 1 2
Same work done quicker in office 104 27
Same work done in similar time 240 61
Time taken on journey (mins) Time taken i n office ( m i n s )
Range
-
FL;?an-
wan121BIE 18b Difference Between Time Taken to do Work on Journey
and Time 'I51ken Office
-
ORGiS SampleSame work takes l o v e r in office Same wrk done quicker in office
Same wark done in similar time
Time taken on journey (mins)
E%E
-
Meall
1-29 15
30-59 34.6
60-119 79.2
12Dt 180.5
Time taken i n office (mins)
mars
TABLE 19a Size of Travelling Groq
-
KML Sample(% of respondents for each mde)
Mode . . . .
Car out 64 28 6 2 0
Qr return 64 24 9 2 0
Train o u t 78 17 4 2 0
Train return 73 20 4 2 1
Air
o u t 68 25 4 4 0Air return 57 33 3 7 0
All modes o u t 74 20 4 2 0
AL1 males return 70 21 5 2 1
TABLE 19b Size of Travelling Group
-
ORGN Sample ( 8 of reS~0ndentS fbr each mode)I h h r of people
Car out
C a r return h a i n out
Wain return
Air out
Air return
All modes out
[image:37.611.56.508.111.812.2]TAEKE 20 Minutes hbrked by NLlmber of mileages
(% respondents by nunber of collexjues)
Minutes W3rked
Nb . . . Oolleagues None 1129 3049 60-119 120+
....
...
(a) outward
Alone 39 13 26 18 5
Alme 53 22 14 8 3
1 or more 52 18 15 14 2
2; ORGN Sample
Minutes hbrked
&I . . . Cnlleaguss Ncme 1-29 30159 60-119 1204-
I---Y_---
(a) outward
Alone 61 11 11 13 4
W I E 21a Use of Time i f the Business Trip Cbuld Ihve Been %scheduled to Start Later
-
EM,
m p l e(NB These figmes are prcentages of those
respmdents who gave me of the l i s t e d r e s p s e s as their main reply.)
If meeting were to start
.
. .
hh r e s p s e 30 m i n later 60 min later 90 m i n later...
Stay
in
bed Have a msalDo danestic tasks Wrk
Do rathing
Stay i n bed Have a meal
Do danestic tasks
Mrk
Do rathing
A l l Trips 46
4
Day Trip