White Rose Research Online URL for this paper:
http://eprints.whiterose.ac.uk/144706/
Version: Published Version
Article:
Hadfield, L.J. and Crowther, P.A. (2006) How extreme are the Wolf-Rayet clusters in NGC
3125? Monthly Notices of the Royal Astronomical Society, 368 (4). pp. 1822-1832. ISSN
0035-8711
https://doi.org/10.1111/j.1365-2966.2006.10245.x
This article has been accepted for publication in Monthly Notices of the Royal Astronomical
Society © 2006 The Authors. Journal compilation © 2006 RAS. Published by Oxford
University Press on behalf of the Royal Astronomical Society. All rights reserved
[email protected]
https://eprints.whiterose.ac.uk/
Reuse
Items deposited in White Rose Research Online are protected by copyright, with all rights reserved unless
indicated otherwise. They may be downloaded and/or printed for private study, or other acts as permitted by
national copyright laws. The publisher or other rights holders may allow further reproduction and re-use of
the full text version. This is indicated by the licence information on the White Rose Research Online record
for the item.
Takedown
If you consider content in White Rose Research Online to be in breach of UK law, please notify us by
How extreme are the Wolf–Rayet clusters in NGC 3125?
⋆
L. J. Hadfield
†
and P. A. Crowther
Department of Physics and Astronomy, The University of Sheffield, Sheffield S3 7RH
Accepted 2006 February 27. Received 2006 February 21; in original form 2006 January 6
A B S T R A C T
We reinvestigate the massive stellar content of the irregular dwarf galaxy NGC 3125 (Tol 3) us-ing Very Large Telescope (VLT)/FORS1 imagus-ing and spectroscopy, plus archival VLT/ISAAC, Hubble Space Telescope(HST)/FOC andHST/STIS data sets. FORS1 narrow-band imaging confirms that the NGC 3125-A and -B knots represent the primary sites of Wolf–Rayet (WR)
stars, whilstHST imaging reveals that both regions host two clusters. Both clusters within
region A host WR stars (A1 and A2), for which the optically fainter cluster A2 is heavily reddened. It is not clear which cluster within region B hosts WR stars. Nebular properties are in good agreement with previous studies and infer a Large Magellanic Cloud (LMC) like
metallicity of log(O/H)+12∼8.3. LMC template mid-type WN and early-type WC spectra are
matched to the observed blue and red WR bumps of A1 and B, permitting the contribution of WC stars to the blue bump to be quantified. From our FORS1 spectroscopy, we obtain
N(WN5–6:WC4)=105:20,∼55:0 and 40:20 for the clusters A1, A2 and B1+2, respectively.
Our results are a factor of∼3 lower than previously reported by optical studies as a result
of a lower Hα/Hβ derived interstellar reddening. Using Starburst99 theoretical energy
distri-butions to estimate O star populations for each cluster, we findN(WR)/N(O)=0.2 for A1
and 0.1 for A2 and the clusters within region B. From Hαnarrow-band imaging, the O star
content of the Giant HIIregions A and B is found to be a factor of 5–10 times higher than
that derived spectroscopically for the ultraviolet (UV)/optically bright clusters, suggesting that NGC 3125 hosts optically obscured young massive clusters, further supported by VLT/ISAAC
K-band imaging. ArchivalHST/STIS UV spectroscopy confirms the low interstellar reddening
towards A1, for which we have determined a Small Magellanic Cloud (SMC) extinction law
for NGC 3125, in preference to an LMC or starburst law. We obtainN(WN5–6)=110 from
the slit loss corrected HeIIλ1640 line flux. This is in excellent agreement with optical results,
although it is a factor of 35 times lower than that inferred from the same data set by Chandar, Leitherer & Tremonti. The discrepancy is due to an anomalously high interstellar reddening derived from their use of the generic starburst extinction law. Highly discrepant stellar popula-tions may result in spatially resolved star-forming regions from UV and optical studies through the use of different extinction laws.
Key words: stars: Wolf–Rayet – galaxies: individual: NGC 3125.
1 I N T R O D U C T I O N
In order to understand galaxy formation and evolution, we need to be able to accurately map the star formation history of the Universe (Madau, Ferguson & Dickinson 1996). Central to this topic are
⋆Based on observations made with ESO telescopes at the Paranal
Obser-vatory under programme ID 074.B-0108 and with archival ESO VLT and NASA/ESAHubble Space Telescopedata, obtained from the ESO/ST-ECF Science Archive Facility.
†E-mail: [email protected]
starburst galaxies, a class of objects which display characteristics associated with massive, violent bursts of star formation. In the local Universe only a handful of starburst galaxies are responsible for a quarter of the entire high-mass star formation (Heckman 1998). We need to be able to understand nearby starbursts if we are to interpret the observations of distant star-forming regions e.g. Lyman break galaxies (LBGs, Steidel et al. 1996).
A subset of these galaxies are called ‘Wolf–Rayet (WR) galaxies’, since their integrated spectra display the broad-emission signatures associated with WR stars; the highly evolved descendants of the most massive O stars. Spanning a wide variety of morphological types, WR galaxies are observed in a wide variety of environments
D
o
w
n
lo
a
d
e
d
fro
m
h
ttp
s:
//a
ca
d
e
mi
c.
o
u
p
.co
m/
mn
ra
s/
a
rt
icl
e
-a
b
st
ra
ct
/3
6
8
/4
/1
8
2
2
/1
1
5
8
5
7
7
b
y
U
n
ive
rsi
ty
o
f S
h
e
ffi
e
ld
u
se
r
o
n
0
8
A
p
ri
l 2
0
1
on a local (D<100 Mpc) scale and out to high redshift. WR stars
are exclusively associated with young stellar populations (∼5 Myr),
so WR galaxies represent an excellent diagnostic of recent star formation.
Recently, Shapley et al. (2003) demonstrated that the
compos-ite spectrum ofz∼3 LBGs displayed broad HeIIλ1640 emission
consistent with the presence of WR stars. The recent ultraviolet (UV)Hubble Space Telescope(HST)/STIS spectral survey of local
starburst galaxies (Chandar et al. 2004) revealed weak HeIIλ1640
emission in most cases. Of the 18 galaxies included in their survey, the super star cluster NGC 3125-1 (alias NGC 3125-A in Vacca &
Conti 1992) showed the most prominent HeIIλ1640 emission.
NGC 3125 (Tol 3) is a nearby (D=11.5 Mpc–Schaerer, Contini &
Pindao 1999) blue compact dwarf galaxy. Observations have shown that the galaxy is dominated by a central starburst region which consists of two main emission knots, NGC 3125-A and -B. From UV spectroscopy, Chandar et al. (2004) estimated a WR population
of∼5000 and N(WR)/N(O)1 for NGC 3125-A. The latter is
completely unexpected for the Large Magellanic Cloud (LMC) like metallicity of NGC 3125. In contrast, optical studies of NGC
3125-A infer a WR population of only∼500 andN(WR)/N(O)∼0.1, an
order of magnitude lower. WR populations in other nearby galaxies common to optical and UV surveys are found to be consistent to within a factor of 2. If NGC 3125-A is a local analogue for LBGs, it is necessary to reconcile optical and UV line techniques for this galaxy.
Here we reinvestigate the WR population of NGC 3125,
us-ing new Very Large Telescope (VLT)/FORS1 imaging and
spec-troscopy, supplemented by archival VLT/ISAAC imaging andHST
imaging and spectroscopy. This paper is organized as follows: VLT
and HST observations of NGC 3125 are discussed in Section 2.
Section 3 describes nebular properties derived for the two WR clus-ters using optical diagnostics. In Section 4, WR and O star
popu-lations for each cluster are estimated using VLT/FORS1 imaging
and spectroscopy. In addition, the WR population of NGC 3125-A
is estimated from UVHST/STIS spectroscopy. Finally, we draw
our conclusions in Section 6.
2 O B S E RVAT I O N S A N D DATA R E D U C T I O N
We have observed NGC 3125 with the ESO VLT UT2 (Kueyen) and
Focal Reduced/Low dispersion Spectrograph #1 (FORS1), a 2048×
2046 pixel Tektronix detector. Observations were made using the
high-resolution collimator which covers a 3.4×3.4 arcmin2field
of view, with a plate scale of 0.1 arcsec pixel−1. Photometric
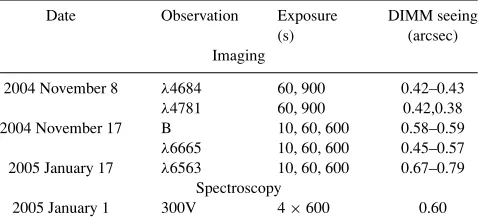
[image:3.612.56.295.627.739.2]ob-servations of NGC 3125 were acquired during 2004 November and 2005 January, with spectroscopic data following in 2005 February. Details of the observations, including the Differential Image Motion Monitor (DIMM) seeing can be found in Table 1.
Table 1. VLT/FORS1 observation log for NGC 3125.
Date Observation Exposure DIMM seeing
(s) (arcsec)
Imaging
2004 November 8 λ4684 60, 900 0.42–0.43
λ4781 60, 900 0.42,0.38
2004 November 17 B 10, 60, 600 0.58–0.59
λ6665 10, 60, 600 0.45–0.57
2005 January 17 λ6563 10, 60, 600 0.67–0.79
Spectroscopy
2005 January 1 300V 4×600 0.60
To supplement VLT/FORS1 observations, we have retrieved
VLT/ISAAC imaging and HST imaging and spectroscopy of
NGC 3125 from the ESO/ST-ECF archive.
2.1 VLT imaging
FORS1 was used to obtain narrow-band images centred onλ4684
and λ4781 [full width at half-maximum (FWHM) = 66 and
68 Å respectively). Theλ4684 filter coincides with the strong NIII
(λ4640 Å), CIII(λ4650 Å), and HeII(λ4686 Å) WR emission lines,
whereas theλ4781 samples a wavelength region relatively free from
emission, providing a measure of the continuum level. In addition,
narrow-band on- and off-Hαimages (λ6563, 6665 Å, FWHM=
61, 65 Å) were acquired along with broad-band B images. Images were reduced following standard reduction procedures
(i.e debiased, flat-field corrected and cosmic-ray cleaned) usingIRAF
andSTARLINKpackages. We present continuum, net Hαimages and
netλ4684 images obtained with FORS1 in Fig. 1.
The optical appearance of NGC 3125 is that of an amorphous elliptical (Schaerer et al. 1999), dominated by a bright central
star-burst. In Fig. 1(a), we present aB-band image of the central
star-burst region taken in excellent seeing conditions (∼0.6 arcsec). The
continuum emission is dominated by two emission knots A and B (Vacca & Conti 1992). A corresponds to the slightly brighter knot
and is located∼10 arcsec to the north-west of B. In the image, knot
A appears to be partially resolved into two components, whereas knot B does not. Several fainter emission knots appear to link the two dominant regions.
Fig. 1(b) shows the VLT/FORS1 net Hαimage of the central
starburst. Nebular emission is concentrated on the two principal knots with region A extending 300 pc and region B 200 pc. This
large size and Hαluminosities of 3.2×1040and 2.0×1040erg s−1
for A and B, respectively (see Section 4.2.2), indicate that A and B
are typical of extragalactic Giant HIIregions which host multiple
stellar clusters (Kennicutt 1984).
We have searched for characteristic WR signatures NGC 3125 by
subtracting theλ4871 image from theλ4684 image, which is shown
in Fig. 1(c). Regions A and B are clearly identified as the primary hosts of WR stars. Region A contains a fainter emission component
∼0.4 arcsec to the west of the main source. This fainter component
contributes∼15 per cent of the totalλ4684 emission.
Photometry of knots A and B was performed using the aperture
photometry packagePHOTwithinIRAF. Instrumental zero points were
derived by observing LTT3864 (B=12.7) and GD108 (B=13.3)
spectrophotometric standard stars.
Magnitudes for source A include the fainter component to the
W of the knot. We find mλ4686 = 17.0 ± 0.1 and mλ4781 =
17.2± 0.1. Photometric uncertainties have been estimated from
background variations, contamination by nearby emission sources and the aperture size. An extremely close emission knot to the north-west of source B made aperture photometry more difficult, reflected
by larger photometric uncertainties, for which we derivemλ4686and
mλ4781magnitudes of 17.5±0.2 and 17.7±0.2, respectively.
To complement our imaging data set, we have retrieved archival VLT/ISAAC images obtained on 2002 April 18 under excellent
seeing conditions of FWHM∼0.4 arcsec. These observations
com-prise broad-bandKs imaging (five on-source plus two off-source
exposures of 5 s) taken using the Short-Wave mode (Rockwell–
Hawaii detector, plate-scale=0.148 arcsec pixel−1). Images were
calibrated relative to the Two-Micron All-Sky Survey (2MASS)
source 10063237−2956190 (Ks=15.0 mag) which was present in
this 2.5×2.5-arcmin2field.
D
o
w
n
lo
a
d
e
d
fro
m
h
ttp
s:
//a
ca
d
e
mi
c.
o
u
p
.co
m/
mn
ra
s/
a
rt
icl
e
-a
b
st
ra
ct
/3
6
8
/4
/1
8
2
2
/1
1
5
8
5
7
7
b
y
U
n
ive
rsi
ty
o
f S
h
e
ffi
e
ld
u
se
r
o
n
0
8
A
p
ri
l 2
0
1
Figure 1. 15×15-arcsec2VLT/FORS1 and VLT/ISAAC archival images of NGC 3125. For our assumed distance 11.5 Mpc, the physical region illustrated
equates to 750×750 pc. (a) Bessell B image showing the morphology of the central starburst. Regions A and B have been marked along with the slit position of spectroscopic observations. (b) High-contrast, net Hαimage. (c) Difference betweenλ4684 andλ4871 filters, showing HeIIλ4686/CIIIλ4650 emission. (d) Archival VLT/ISAACKsimage of NGC 3125. North is up and east is to the left-hand side on all images.
In contrast to optical images, Fig. 1(d) shows that in the
near-IR, knot A is much brighter than B, withKs=14.5 and 16.1 mag,
respectively. In addition to the optically dominant sources, there are two bright knots to the north-west of B, with a combined magnitude
ofKs=15.0 mag. These are again more prominent than in optical
images, suggesting the presence of partially obscured star-forming regions. We will return to this in Section 4.2.2.
2.2 VLT spectroscopy
Spectroscopic observations of NGC 3125 were undertaken on 2005 February 1 using FORS1 and the high-resolution collimator in
seeing conditions of ∼0.6 arcsec. Spectra were acquired using a
0.8- arcsec slit and 300V grism centred along the two main emission
knots (PA= −124◦; see Fig. 1c). The extracted spectra covered a
wavelength range of 3300–8600 Å with a dispersion of 2.6 Å pixel−1
and resolution of∼15 Å (as measured from comparison arc lines).
Data were prepared and processed using standard techniques and
IRAFandSTARLINKpackages i.e. bias subtracted, flat-field corrected, extracted and flux/wavelength calibrated. Care was taken during the extraction process to ensure neighbouring emission knots did not contaminate the aperture or the background subtraction. The spec-trophotometric standard Feige 66 was observed in order to relatively flux calibrate the spectra.
Absolute flux calibration was achieved by comparing
synthetic-filter photometry (λc = 4684, FWHM = 66 Å) to λ4684
D
o
w
n
lo
a
d
e
d
fro
m
h
ttp
s:
//a
ca
d
e
mi
c.
o
u
p
.co
m/
mn
ra
s/
a
rt
icl
e
-a
b
st
ra
ct
/3
6
8
/4
/1
8
2
2
/1
1
5
8
5
7
7
b
y
U
n
ive
rsi
ty
o
f S
h
e
ffi
e
ld
u
se
r
o
n
0
8
A
p
ri
l 2
0
1
4000 4500 5000 5500 6000 6500 7000 Wavelength (A)
-15.5 -15.0 -14.5 -14.0
Log Flux (erg s
-1 cm -2 A -1)
B A
HeII(4686)
CIV(5808)
NIV(4058)
[image:5.612.57.293.61.231.2]NIII(4640) /CIII(4650)
Figure 2. VLT/FORS1 optical spectra of NGC 3125-A and B. Spectra have been velocity corrected (Vr=865 km s−1, Lauberts & Valentijn 1989) and
WR emission features have been marked.
photometry. We derive a slit-correction factor of 1.3±0.2 for knot
A, which dominates the accuracy of our final flux-calibrated spectra. An identical correction factor is found for knot B. We expect our
absolute flux calibration to be correct to∼15 per cent. Extracted
spectra of NGC 3125-A and B are shown in Fig. 2, in which the
principal WR emission features are identified, including weak NIV
λ4058.
2.3 HSTimaging
To complement our FORS1 data set, we have retrieved archival
HST images, including a STIS/LONG PASS acquisition image
(t=40 s,λc=7200 Å) from programme GO 9036 (P.I. C. Leitherer)
of region A and a FOC/F220W1 image (t=500 s,λ
c=2280 Å)
from programme GO 4800 (P.I. P. Conti) of the central starburst region.
The STIS/LONG PASS acquisition image resolves region A
into two clusters, separated by∼0.5′′or 25 pc at the distance of
NGC 3125 (upper panel of Fig. 3). We designate these two compo-nents A1 and A2, with A1 corresponding to the brighter of the pair to the east. The components have FWHM of 0.17 and 0.13 arcsec,
and a flux ratio ofFA1/FA2∼1.9 at 7200 Å, although an absolute
flux calibration was not possible.
In theHST/FOC F220W image A1 is bright whereas A2 is barely
detected, with FA1(F220W)/FA2(F220W) ∼ 10 (lower panel of
Fig. 3). Assuming that A1 and A2 possess comparable intrinsic en-ergy distributions – which is reasonable since both clusters host WR stars (Section 2.1) – A2 must suffer from significantly higher
ex-tinction. Aperture photometry revealsFA1(F220W)=(1.1±0.2)×
10−15erg s−1cm−1andF
A2(F220W)3×10⁻¹⁶erg s−1cm−1.
TheHST/FOC image also resolves region B into two
compo-nents (Fig. 4) – B1 and B2, with the brighter component, B1 to the
south-east with FB1(F220W)/FB2(F220W)∼ 1.2. It is not clear
which cluster within region B hosts the WR population since these are spatially unresolved in our VLT/FORS1 imaging. High spatial resolution optical imaging is not yet available. It was not possi-ble to perform aperture photometry on B1 and B2 individually in these pre-COSTAR images, we therefore derive a total UV flux of
(1.6±0.2)×10−16erg s−1cm−1for region B.
[image:5.612.350.524.63.373.2]1FOC/F220W image is pre-COSTAR.
Figure 3. 1×1-arcsec2(50×50 pc) STIS/Long Pass acquisition (the top
panel) and pre-COSTARHST/FOC F220W (the bottom panel) images of regions A. The two clusters A1 and A2 are marked. North is up and east is to left-hand side.
Figure 4. 1×1-arcsec2 (50× 50 pc) pre-COSTARHST/FOC F220W
(λc =2280 Å) image of region B. North is up and east is to left-hand
side.
2.4 HSTspectroscopy
ArchivalHST/STIS spectroscopy of region NGC 3125-A1 (Chandar
et al. 2004) was obtained in programme GO 9036 (P.I. C. Leitherer) and comprised two exposures with the G140L grat-ing [far-ultraviolet (FUV)-MAMA detector], of duration 1050 and 2925 s, plus one exposure with the 230L grating [near-ultraviolet
(NUV)-MAMA detector] using the 52×0.2-arcsec2slit. The STIS
MAMA detectors have a plate scale of 0.024 arcsec pixel−1. Spectra
D
o
w
n
lo
a
d
e
d
fro
m
h
ttp
s:
//a
ca
d
e
mi
c.
o
u
p
.co
m/
mn
ra
s/
a
rt
icl
e
-a
b
st
ra
ct
/3
6
8
/4
/1
8
2
2
/1
1
5
8
5
7
7
b
y
U
n
ive
rsi
ty
o
f S
h
e
ffi
e
ld
u
se
r
o
n
0
8
A
p
ri
l 2
0
1
[image:5.612.348.526.436.595.2]Table 2. Observed (Fλ) and dereddened (Iλ) nebula line fluxes of WR
re-gions A and B within NGC 3125. Line ratios are normalized to Hβ=100. We present observed and dereddened Hβ fluxes in the final row (erg s−1cm−2). Reddening corrections ofE(B−V)=0.24 and 0.21 for
A and B, respectively, include a Galactic foreground reddening of 0.08 mag.
λrest A B
(Å) ID Fλ Iλ Fλ Iλ
3727 [OII] 83.5 99.0 109.2 123.9
4340 Hγ 40.0 44.7 40.3 43.3
4363 [OIII] 3.9 4.6 2.8 2.9
4861 Hβ 100 100 100 100
4959 [OIII] 205.7 203.2 169.8 162.3
5007 [OIII] 640.3 615.3 524.2 496.0
6563 Hα 371.4 282.9 351.2 279.2
6583 [NII] 8.7 6.6 11.5 9.2
7330 [OII] 3.7 2.7 3.6 2.7
4871 Hβ 6.95×10⁻¹⁴ 1.56×10⁻¹³ 3.83×10⁻¹⁴ 7.55×10⁻¹⁴
were extracted over a 13 pixel (0.3 arcsec) aperture and combined to provide a complete wavelength coverage of 1175–3100 Å, with
a spectral resolution of∼3 pixel (1.8 Å).
The UV spectrum of A1 has been presented by Chandar et al.
(2004) who noted the strong HeII λ1640 emission feature, for
which we measure an equivalent width of 6.9±0.8 Å and FWHM
∼4.8±0.7 Å. Absolute flux calibration has been achieved by
com-paring ourHST/STIS spectra with the F220W flux of A1. We derive
spectral slit losses of∼40±30 per cent.
3 N E B U L A R A N A LY S I S
In the following section, we will derive the nebular properties of
NGC 3125-A and B. Observed (Fλ) and dereddened (Iλ) nebular
line fluxes with respect to Hβ=100 are presented in Table 2.
The nebular analysis was performed using theSTARLINKpackage
DIPSOwith line fluxes being determined using the ELF
(emission-line fitting) routine. The emission-(emission-line profiles were non-Gaussian in the FORS1 spectra (comparison arc lines displayed the same profile, apparently due to the use of the high-resolution collimator for spectroscopy) and were modelled using template profiles created
from the data. [OIII] and [OII] emission lines were modelled using
[OIII]λ5007 as a template profile, Hα,β,γand [NII] were modelled
using the Hβemission line as a template.
3.1 Interstellar reddening
Estimates of the interstellar reddening have been made using the
Balmer line ratios Hα: Hβ: Hγ. Nearby [NII] emission has been
accounted for when measuring observed Hαfluxes. Assuming Case
B recombination theory for electron densities of 102cm−3 and a
temperature of 104K (Hummer & Storey 1987), we deduce average
totalE(B−V) values of 0.24 and 0.21 for A and B, respectively.
Foreground Galactic reddening [E(B−V)] towards NGC 3125 of
E(B−V)=0.08 mag (Schlegel, Finkbeiner & Davis 1998) was
ac-counted for using a standard Galactic extinction law (Seaton 1979). The point-like appearance of the two regions on ground-based im-ages suggests that a Calzetti, Kinney & Storchi-Bergmann (1994) starburst obscuration law is inappropriate. We therefore choose to use the Bouchet et al. (1985) Small Magellanic Cloud (SMC) ex-tinction law to deredden our spectra (see Section 5.2).
Underlying stellar Hαand Hβabsorption from early-type stars
is estimated to beWλ∼2 Å. In our spectra, Hαand Hβequivalent
widths are found to be∼550 and∼100 Å for both regions.
Prop-agating this correction through calculations leads to an uncertainty
inE(B−V) of±0.01 mag.
From a comparison between the STIS/Long Pass acquisition and
FOC/F220W images (Fig. 3), cluster A2 appears to suffer a much
higher extinction than A1, withFA1/FA2∼1.9 at 7200 Å and∼10
at 2280 Å. If we assume that A1 and A1 possess identical intrinsic
flux distributions, we estimate thatEINT(B−V)(A2)∼0.5 mag.
Kunth & Sargent (1981) derived a totalE(B−V)=0.40 from
Hβ:Hδ:Hγ intensity ratios.2Higher (and weaker) members of the
Balmer series can be significantly affected by underlying stellar absorption, which was not accounted for in their analysis.
Vacca & Conti (1992, hereafter VC92) also studied the nebular
properties of NGC 3125-A and B. Using Hα:Hβ line ratios they
derived internal reddenings of EINT (B − V) = 0.40 and 0.64,
respectively, significantly higher than those obtained here. A higher extinction for region B than region A is inconsistent with our UV and optical photometry, if we assume identical flux distributions for these regions, since B is brighter in the UV whilst A is brighter optically.
VC92 based their determination on composite blue (λ <5400
Å, photometric) and red (λ >4500 Å, non-photometric) spectra
obtained 12 months apart. The red spectrum, which was scaled to
the blue continuum, resulted in a Hβflux 20 per cent larger than that
measured in the blue spectrum. Based on their red data set alone, an extinction of NGC 3125-A fully consistent with the present result would have been obtained (Vacca, private communication).
3.2 Electron temperature, density & oxygen abundance
Electron temperatures, Te, for regions A and B have been
derived from the temperature diagnostics [OII] 3727/7330 and
[OIII] (4959+5007)/4363 Å for the line ratios presented in
Table 2. Electron temperatures were calculated using the five-level
atom calculatorTEMDENwithinIRAFfor a constant electron density
of 100 cm−3.
Errors onTe[OII] were based on the 5 per cent measurement error
estimated for the [OII] 7330 Å line, whileTe[OIII] uncertainties
were based on the 10 per cent formal error given for [OIII] 4363 Å.
Electron temperatures derived here agree to within the errors of those reported by VC92 who found 10 200 K for region A and 10 300 K for region B.
Due to the low spectral resolution of our data, [SII] 6716/6731
Å nebula lines are not resolved, preventing a direct estimate of the
electron densityne. For completeness, we have estimated ne by
combining our electron temperatures with [SII] fluxes published
by VC92. From these we estimate an electron density of 140 cm−3
for both regions. Errors are not quoted for electron densities since
published [SII] ratios did not give associated uncertainties.
Since the oxygen content is used as a proxy of a galaxy’s metal-licity, we have derived the oxygen abundance for each region using
[OII] 3727 Å and [OIII] 5007 Å nebular emission lines and their
associated electron temperatures (see Table 3).
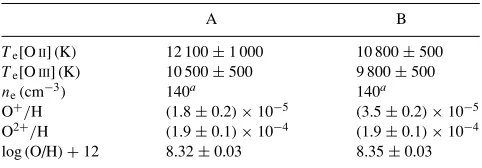
Both regions, with log(O/H)+12 = 8.32–8.35 have an
oxy-gen content comparable to log(O/H)+12 = 8.37 (Russell &
Dopita 1990) observed in the LMC. Our oxygen abundances are in
2Kunth & Sargent (1981) quoted a colour excess ofE(B−V)=0.28 mag
in their table 1, the origin of which is not given. It is not clear which value has been used in their subsequent analysis.
D
o
w
n
lo
a
d
e
d
fro
m
h
ttp
s:
//a
ca
d
e
mi
c.
o
u
p
.co
m/
mn
ra
s/
a
rt
icl
e
-a
b
st
ra
ct
/3
6
8
/4
/1
8
2
2
/1
1
5
8
5
7
7
b
y
U
n
ive
rsi
ty
o
f S
h
e
ffi
e
ld
u
se
r
o
n
0
8
A
p
ri
l 2
0
1
Table 3. Summary of nebular properties of NGC 3125 clusters A and B.
A B
Te[OII] (K) 12 100±1 000 10 800±500
Te[OIII] (K) 10 500±500 9 800±500
ne(cm−3) 140a 140a
O+/H (1.8±0.2)×10−5 (3.5±0.2)×10−5
O2+/H (1.9±0.1)×10−4 (1.9±0.1)×10−4
log (O/H)+12 8.32±0.03 8.35±0.03
aElectron densities were derived for [SII] ratios of VC92.
excellent agreement with previous studies of Kunth & Sargent and
VC92 who obtained log(O/H)+12=8.3–8.4.
4 M A S S I V E S TA R P O P U L AT I O N
In this section we derive the massive star content of NGC 3125-A and B using optical and UV techniques.
4.1 Estimating the number of WR stars
4.1.1 Optical
For regions A and B we detect broad blue and red WR features, as previously reported by Schaerer et al. (1999). Gaussian line profiles
have been fitted to the NIIIλ4640/CIIIλ4650 blend, HeIIλ4686 and
[image:7.612.55.295.567.720.2]CIVλ5808. Slit loss corrected emission-line fluxes are presented in
Table 4.
In region A we detect strong HeII λ4686 emission plus NIII
λ4640–CIIIλ4650, indicative of a predominantly late WN
popu-lation. We also detect weak NIVλ4058, as reported by Kunth &
Sargent (1981). This suggests a dominant mid WN subtype (Smith, Shara & Moffat 1996; Crowther & Hadfield 2006).
The presence of CIVλ5808 emission suggests that a significant
WC population is present in region A. WC stars are classified by the
CIIIλ5696/CIVλ5808 line ratio (Smith, Shara & Moffat 1990a).
Since CIIIλ5696 is very weak or absent, the dominant WC
popula-tion is WC4–5.
Similar WR features are observed for region B, although HeII
λ4686 is somewhat weaker than that in region A. As such, we
Table 4. Observed WR line properties and derived populations of clusters in NGC 3125. Line fluxes (Fλ) are expressed in erg s−1cm−1, derived
lumi-nosities adopted a distance to NGC 3125 of 11.5 Mpc (Schaerer et al. 1999) and are expressed in erg s−1.
Region A1 A2 B1+2
E(B−V)TOT 0.24 ∼0.58 0.21
F4686 7.4×10⁻¹⁵ ∼1.1×10⁻¹⁵ 4.0×10⁻¹⁵
I4686 1.7×10⁻¹⁴ ∼6.8×10⁻¹⁵ 8.4×10⁻¹⁵
L4868 2.7×1038 ∼1.0×1038 1.3×1038
N(WN5–6)a 150 ∼55 75
F5808 2.0×10⁻¹⁵ – 2.8×10⁻¹⁵
I5808 3.8×10⁻¹⁵ – 4.8×10⁻¹⁵
L5808 6.0×1037 – 7.6×1037
N(WC4)a 20 – 25
F1640 2.0×10⁻¹⁵ – –
I1640 1.3×10⁻¹³ – –
L1640 2.1×1039 – –
N(WN5–6)a 115 – –
aNumbers derived solely from observed line luminosities based on average
line luminosities of Crowther & Hadfield (2006).
assume a dominant mid WN population whilst the red feature is again consistent with a early-type WC population.
As a first estimate of the WR population in each region we have
derived numbers based solely on the observed HeIIλ4686 and
CIVλ5808 line luminosities, following the approach of Schaerer
& Vacca (1998). We have attempted to derive WR populations for A1 and A2 separately, since UV spectroscopy relates only to A1 and A2 suffers a much higher extinction. From Fig. 1(c) we estimate that
the observed HeIIλ4686 flux ratio is 0.15:1 for A2:A1; whilst we
assume only A1 is responsible for the CIVλ5808 emission. This
assumption is based on the higher extinction of A2 which suggests that it may be younger than A1 and would not necessarily host a mixed WR population.
If we assume that only WN5–6 stars contribute to the HeII
λ4686 line flux i.e. neglecting the WC contribution, we estimate
thatNA1(WN5–6)=150 based on the (1.8±1.7)×1036erg s−1
average HeIIline luminosity of 15 LMC WN5–6 stars studied by
Crowther & Hadfield (2006). For A2, assuming an internal
red-dening ofEINT(B−V)∼0.5 mag, we estimate thatN
A2(WN5–6)
∼55. Similarly,NA1(WC4)=20 based on the average (3.3±1.7)×
1036erg s−1 CIVλ5808 line luminosity of seven LMC WC4 stars
(Crowther & Hadfield 2006).
Applying the same methodology to region B, we derive a WR population of 75 WN and 25 WC stars.
Although WN stars will typically be the primary contributor to
the HeIIλ4686 feature, there will be a contribution from the WC
population if present. Therefore, to improve upon our initial esti-mate of the WN content we have estiesti-mated the WC contribution to the blue feature by fitting generic LMC WN5–6 and WC4 spectra from Crowther & Hadfield (2006) to the observed blue and red WR bumps. Each region will now be discussed in turn.
In Fig. 5(b), we compare the CIVλ5808 profile of region A1
with that expected from 20 LMC-like WC4 stars at a distance of NGC 3125. The good agreement confirms our initial estimate. We have then accounted for the contribution of 20 WC4 stars to the blue WR feature, adjusted for the contribution of A2 to the observed flux. In Fig. 5(a) we compare the dereddened, continuum-subtracted blue WR feature for cluster A1 with that expected for a mixed WR population of 20 WC4 and 105 WN5–6 stars. The composite spectrum of our generic WR populations reproduces the observed morphology exceptionally well, except for spectral regions where
nebular lines are expected (e.g. [FeIII] 4658, [ArIV] 4711).
For region B, it was necessary to reduce the number of WC4 stars
from 25 to 20 in order to match the observed CIVλ5808 emission
profile (Fig. 5d). This revised WC population was used to construct the blue WR bump for region B. Fig. 5(c) shows that the WC
con-tribution is highly significant, with 50 per cent of the HeIIλ4686
and 90 per cent of the NIII/CIIIλ4640/50 line flux originating from
WC stars. The WN5–6 population is therefore reduced to 40. WR populations derived using this method are included in Table 5.
4.1.2 Ultraviolet
The WR population of cluster A1 has been independently estimated
from the dereddened, slit loss corrected HeIIλ1640 line luminosity.
AdoptingE(B−V)=0.24 mag, as derived from Hα:Hβ, we
de-rive a dereddened line flux ofFA1(1640)=9.4×10⁻¹⁴erg s−1cm−2
based on an SMC extinction law. For completeness we have con-sidered various extinction laws, and conclude in Section 5.2 that an SMC-extinction law provides the closest match to the complete STIS UV spectral energy distribution (SED). If we neglect the WC
contribution to theλ1640 line, we estimate a stellar content of 115
D
o
w
n
lo
a
d
e
d
fro
m
h
ttp
s:
//a
ca
d
e
mi
c.
o
u
p
.co
m/
mn
ra
s/
a
rt
icl
e
-a
b
st
ra
ct
/3
6
8
/4
/1
8
2
2
/1
1
5
8
5
7
7
b
y
U
n
ive
rsi
ty
o
f S
h
e
ffi
e
ld
u
se
r
o
n
0
8
A
p
ri
l 2
0
1
4550 4600 4650 4700 4750 4800 0
1 2 3 4 5 6 7
Flux (10
-15
erg s
-1 cm
-2
)
NGC 3125-A1 N(WN)=105 N(WC)=20
(a)
5700 5750 5800 5850 5900 5950
0.0 0.2 0.4 0.6 0.8 1.0 1.2 1.4
Flux (10
-16
erg s
-1 cm
-2
)
NGC 3125-A1
N(WC)=20 (b)
4550 4600 4650 4700 4750 4800
0.0 0.5 1.0 1.5 2.0 2.5
Flux (10
-15
erg s
-1 cm
-2
-1)
NGC 3125-B N(WN)=40 N(WC)=20
(c)
5700 5750 5800 5850 5900 5950
0.0 0.2 0.4 0.6 0.8 1.0 1.2 1.4
Flux (10
-16
erg s
-1 cm
-2
)
NGC 3125-B
N(WC)=20 (d)
-1
[image:8.612.90.520.69.380.2]-1 -1
[image:8.612.318.552.436.616.2]Figure 5. Dereddened (SMC extinction law), continuum-subtracted, spectral comparison between the observed (the solid line) and generic (the dash–dotted line) WR emission features for clusters A1 and B. Observed spectra have been velocity corrected and corrected for 25 per cent slit losses. Generic WC4 (the dashed line) and WN5–6 (the dotted line) features are marked.
Table 5. WR populations for clusters within NGC 3125 A and B derived from fitting LMC template WR spectra.
Region Diagnostic A1 A2 B1+2
N(WN5–6) λ4686 105 ∼55 40
N(WN5–6) λ1640 110
N(WC4) λ5808 20 – 20
N(WR) λ4686/λ5808 125 ∼55 60
WN5–6 stars, based on the average HeIIλ1640 line luminosity of
1.8×1037erg s−1from Crowther & Hadfield (2006). Application
of an LMC extinction curve, which is less successful at reproduc-ing the UV flux distribution of A1, requires a higher extinction of
E(B−V)=0.33 mag and a WN population of∼200 stars.
Following the same approach as for the optical WR features, we
have constructed a HeIIλ1640 profile using generic LMC WN5–
6 and WC4 spectra. Generic spectra are taken from Crowther &
Hadfield (2006) and are based on low-resolution International
Ultraviolet Explorer (IUE)/SWP data for 10 WN5–6 stars and
medium-resolutionHST/FOS data for six WC4 stars.
In Fig. 6, we compare the SMC law dereddened, far-UV slit loss
correctedHST/STIS spectrum of A1, plus the spectrum around HeII
λ1640 degraded to the 6-Å resolution ofIUE/LORES–with that for
110 WN5–6 stars from Crowther & Hadfield (2006) adjusted to the distance of NGC 3125. Also illustrated is a synthetic Starburst99 spectrum based on LMC/SMC template stars for the 1250–1600
1300 1400 1500 1600 1700
0 1 2 3 4 5
Flux (10
-14
erg s
-1 cm
-2
-1) Si IV 1400 C IV 1550 He II 1640
NGC3125-A1
Figure 6. Comparison between the slit loss corrected, dereddened [ETOT
(B−V)=0.08(GAL)+0.16(SMC)]HST/STIS spectrum of A1 (the faint solid line) with a 2.0×10⁵M⊙SB99 synthetic spectrum obtained using LMC/SMC template OB stars for 1250–1600 Å (the solid line), in which an age of 4 Myr is indicated from the prominent SiIVwind profile. Also shown is the STIS spectrum around HeIIλ1640 degraded to 6-Å resolution (the dotted line) together with theλ1640 emission predicted from 110 generic LMC WN5–6 stars (The dashed line, Crowther & Hadfield 2006).
D
o
w
n
lo
a
d
e
d
fro
m
h
ttp
s:
//a
ca
d
e
mi
c.
o
u
p
.co
m/
mn
ra
s/
a
rt
icl
e
-a
b
st
ra
ct
/3
6
8
/4
/1
8
2
2
/1
1
5
8
5
7
7
b
y
U
n
ive
rsi
ty
o
f S
h
e
ffi
e
ld
u
se
r
o
n
0
8
A
p
ri
l 2
0
1
[image:8.612.53.292.464.528.2]Table 6. O star populations andN(WR)/N(O) ratios for individual clusters from UV/optical spectroscopy using SB99 spectral synthesis models, plus O star content from giant HIIregions from Hαimaging, after correction for ionizing fluxes from WR stars.
Region A1 A2 B1+2
UV/optical spectroscopy
M(×105M
⊙) 2.0 2.2 1.6
N(O) 550 600 450
N(WR)/N(O) 0.2 0.1 0.1
HαImaging logQobs
0 52.39 52.19
N(O7V)† 2000 1600
N(O)† 4000 3200
†We adopt logN(Lyman continuum)=48.9 s−1and estimateN(O) using
ηfrom W(Hβ) for regions A and B (see text).
Å region; this will be further discussed in Section 4.2. The WC
con-tribution to the HeIIλ1640 flux is very minor, reducing the number
of typical WN5–6 stars from 115 to 110. This is in excellent agree-ment with the optically derived WN5–6 population (see Table 5).
4.2 Estimating the number of O stars
4.2.1 The O star population of individual clusters
The O star content of A1 has been directly estimated by comparing
the slit loss corrected, dereddenedHST/STIS spectrum of A1 to
the best-fitting Starburst99 model (SB99, Leitherer et al. 1999). We
assume a Kroupa initial mass function (IMF) (0.1–100 M⊙) with
a turnover at 0.5 M⊙and an exponent of 2.3 for the high-mass
interval. The Geneva high mass loss rate LMC metallicity model has been adopted. For an empirical LMC/SMC template spectrum (Leitherer et al. 2001), we estimate a burst age of 4 Myr due to the
prominent SiIVλ1400 feature, see Fig. 6. In contrast, Chandar et al.
(2004) estimated 3±1 Myr. A cluster mass of 2.0×10⁵M
⊙is
required to match the UV continuum, indicating an O star content
2000 3000 4000 5000 6000 7000 8000 Wavelength(Å)
s
gr
e(
x
ul
F
g
o
L
1mc 2Å 1)
mt
A
mt
A
A1 (ESMC
= 0.15)
A2 (ESMC
= 0.5)
FOC (F220W)
STIS (LP) A1 + A2
(FORS1)
2000 3000 4000 5000 6000 7000 8000 Wavelength(Å)
s
gr
e(
x
ul
F
g
o
L
1mc 2Å 1)
mt
A
mt
A
(ESMC = 0.11)
B2 (ESMC
= 0.11)
FOC (F220W) B1
B1 + B2
(FORS1)
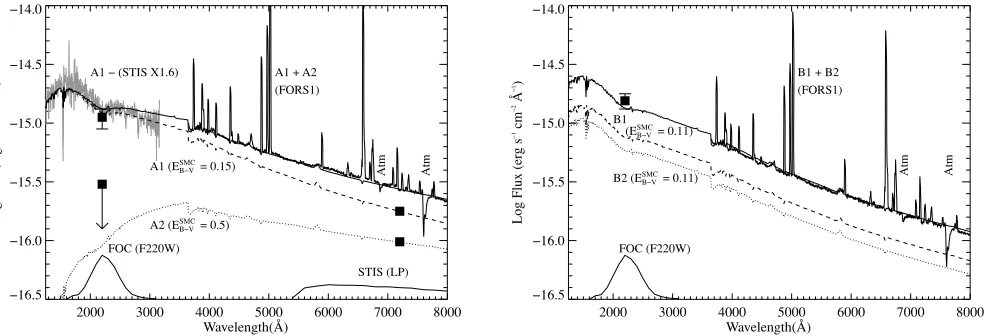
Figure 7. Left-hand panel: comparison between the observed VLT/FORS1 (A1+A2) and slit loss correctedHST/STIS spectroscopy of A1. Reddened flux distributions for A1 (M=2.0×10⁵M
⊙– dashed) and A2 (M=2.2×10⁵M⊙– dotted) are shown together with the combined, A1+A2, flux distribution
(solid). We adopt a foreground extinction ofE(B−V)=0.08 mag, with internal (SMC law) extinctions for individual clusters indicated. The F220W photometry for A1 and A2 and the relative STIS/Long Pass flux ratioFA1/A2∼1.9 plus the FOC/STIS filter transmission curves are also shown. Right-hand panel: a
similar comparison for clusters B1 and B2 assuming identical internal extinctions, plus the combined B1+2 FOC/F220W flux.
of∼550. TheN(WR)/N(O) ratio for cluster A1 is therefore∼0.2,
explaining the large equivalent width of HeIIλ1640.
If clusters A1 and A2 are coeval and using the flux ratios described
in Section 2.1, we find that A2 is slightly more massive, withM=
2.2×10⁵M
⊙. The O star population of A2 is estimated at∼600,
givingN(WR)/N(O)∼0.1.
For region B, the SB99 model was scaled to match the FOC(F220W) and VLT/FORS1 flux levels which indicates a
combined mass of 1.6×10⁵M
⊙. Given their relative UV fluxes, as
described in Section 2.3, and assuming each cluster has an identical
EINT(B−V), we estimate thatM(B1)=9×10⁴M
⊙andM(B2)=
7×10⁴M
⊙. SB99 models predict that such bursts should host 250
and 200 O stars, respectively. The O star content derived for these
clusters is 450 leading toN(WR)/N(O)=0.1, as in A2. A summary
of the cluster O star content andN(WR)/N(O) ratios are presented
in Table 6.
In Fig. 7, we compare slit loss corrected VLT/FORS1 and
HST/STIS spectra with the combined, reddened, SB99 models for
clusters within regions A and B. Individual contributions for each cluster are indicated, together with transmission curves for the
FOC/220W and STIS/LPfilters. In order for the SB99 flux
dis-tributions of each region to match their counterpart VLT/FORS1
spectra, we estimate that EINT(B − V)(A1)=0.15 and EINT(B
− V)(B)=0.11, in excellent agreement with those derived from
nebular Hα/Hβand UV spectroscopy/photometry. Best agreement
between STIS and FORS1 spectroscopy for region A1 was achieved
with a slit correction factor of 1.6 versus 1.4±0.3 obtained from
HST/FOC imaging.
4.2.2 The O star population of the Giant HIIregions A & B
In addition to determining the O star content of the individual clus-ters from their UV/optical continuua, we have derived the
num-ber of O stars present in each giant HIIregion using the net Hα
flux measured from our VLT/FORS1 narrow-band on- and off-Hα
images.
The observed net Hα fluxes of regions A and B are 1.2 and
7.5×10⁻¹³erg s−1cm−2, respectively. For internal reddenings of
0.16 and 0.13 mag, these equate to Hα luminosities of 3.2 and
D
o
w
n
lo
a
d
e
d
fro
m
h
ttp
s:
//a
ca
d
e
mi
c.
o
u
p
.co
m/
mn
ra
s/
a
rt
icl
e
-a
b
st
ra
ct
/3
6
8
/4
/1
8
2
2
/1
1
5
8
5
7
7
b
y
U
n
ive
rsi
ty
o
f S
h
e
ffi
e
ld
u
se
r
o
n
0
8
A
p
ri
l 2
0
1
[image:9.612.64.556.509.677.2]2.0×1040erg s−1. Measurements were made using apertures 7.0
and 6.0 arcsec in diameter for A and B, respectively. These corre-spond to a physical scale of 350 and 300 pc. From slit spectroscopy,
Hαluminosities are measured to be a a factor of∼3 lower.
Accounting for the WR contribution to the ionizing continuum,
the number of equivalent O7V stars,N(O7V), can be expressed as
N(O7V)= Q
Obs
O −N(WN)Q WN
O +N(WC)Q WC O
QO7V O
,
whereQObs
O is the observed Lyman continuum flux andQWNO ,QWCO ,
QO7V
O are the average Lyman continuum flux for each stellar type
(VC92).
The O star population present in our regions will of course not be restricted to the O7V spectral type, but distributed amongst the entire spectral class. We must therefore account for the age of the population and the IMF when determining the total number of O
stars,N(O). As shown by Vacca (1994),N(O) is related to the
num-ber of equivalent O7V stars,N(O7V), by
N(O)= N(O7V)
η(t)
whereη(t) is the IMF-averaged ionizing Lyman continuum
lumi-nosity for a stellar population, of a given age normalized to one equivalent O7V star.
In recent years a number of papers (i.e. Crowther et al. 2002b; Martins, Schaerer & Hillier 2002) have re-calibrated the spectral type–temperature relation for Galactic O stars, accounting for
non-LTE and line-blanketing effects. Studies have shown that a∼10
per cent downwards revision in the effective temperature scale of O
stars is required, such that logQOfor a typical Galactic O7V star
de-creases by 0.2 dex (Martins, Schaerer & Hillier 2005). Additionally, recent studies of Magallenic Cloud O stars indicate 2–4 kK higher temperatures than their Galactic counterparts (Massey et al. 2005; Heap, Lanz & Hubeny 2006; Mokiem et al. 2006). Therefore, for this
present application we adopt logQO7 V=48.9 for LMC metallicity
stars (and would recommend 49.0 for SMC metallicities). For the
WR contribution, we adopt logQWC
O =49.40 and logQ
WN
O =49.75,
based on the average of six WC4 LMC stars (Crowther et al. 2002a) and nine WN5–6 LMC stars (Crowther & Smith 1996; Crowther & Dessart 1998).
The parameterηhas been evaluated using the instantaneous
star-burst models of Schaerer & Vacca (1998) and measured Hβ
equiv-alent widths [W(Hβ)]. We measure W(Hβ) to be∼100 Å for both
regions, suggesting a burst age of∼4 Myr (Schaerer & Vacca 1998,
their fig. 7). For a burst of this age and a Salpeter IMF,ηis∼0.5
[image:10.612.137.473.615.738.2](Schaerer & Vacca 1998, their fig. 21).
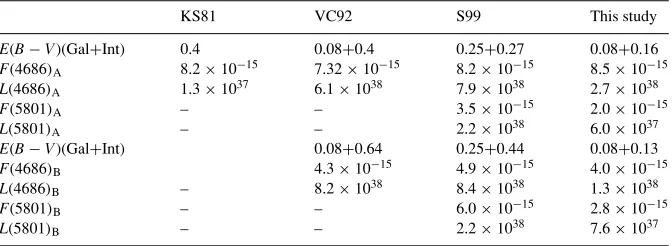
Table 7. Comparison between observed HeII4686 and CIV5808 line fluxes in regions A and B by Kunth
& Sargent (1981, KS81), Vacca & Conti (1992, VC92), Schaerer et al. (1999, S99) and this study, including differences in interstellar reddening, with line luminosities calculated for a common distance of 11.5 Mpc.
KS81 VC92 S99 This study
E(B−V)(Gal+Int) 0.4 0.08+0.4 0.25+0.27 0.08+0.16
F(4686)A 8.2×10⁻¹⁵ 7.32×10⁻¹⁵ 8.2×10⁻¹⁵ 8.5×10⁻¹⁵
L(4686)A 1.3×1037 6.1×1038 7.9×1038 2.7×1038
F(5801)A – – 3.5×10⁻¹⁵ 2.0×10⁻¹⁵
L(5801)A – – 2.2×1038 6.0×1037
E(B−V)(Gal+Int) 0.08+0.64 0.25+0.44 0.08+0.13
F(4686)B 4.3×10⁻¹⁵ 4.9×10⁻¹⁵ 4.0×10⁻¹⁵
L(4686)B – 8.2×1038 8.4×1038 1.3×1038
F(5801)B – – 6.0×10⁻¹⁵ 2.8×10⁻¹⁵
L(5801)B – – 2.2×1038 7.6×1037
We present logQObs
O ,N(O7V),N(O) derived in this analysis in
Table 6. These exceed the continuum-derived cluster O star content by an order of magnitude. These would have been reduced by a
factor of 3, had they been derived from Hαslit spectroscopy. These
large differences suggest that NGC 3125 may host additional young massive clusters which are optically obscured.
Recall from Fig. 1(d) that region A is exceptionally bright atKs.
Our combined SB99 flux distributions for clusters A1 and A2
pre-dict that these clusters contribute only∼30 per cent of the observed
Ks flux of region A. The addition of a visually obscured cluster
[E(B−V)1.5 mag], spatially coincident with the optically
vis-ible clusters may resolve the observed IR excess for region A. To reconcile the high number of equivalent O7V stars derived from
the Hαimage, a cluster with mass∼8×10⁵M
⊙and age∼1–2
Myr would be necessary. Indeed, visually obscured, young massive clusters are common in dwarf irregular starburst galaxies such as NGC 5253 (Turner, Beck & Ho 2000) and He 2–10 (Vacca, Johnson & Conti 2002).
For region B, clusters B1 and B2 are predicted to contribute∼60
per cent of the observedKsflux. We do not consider it likely that
there is an additional obscured cluster since either B1 or B2 may be somewhat older than 4 Myr, such that red supergiants would contribute to the IR excess. In this case, the IR bright sources to the north-west of the UV/optically bright clusters would dominate
the Hαionization from region B, if each possesses a mass of∼2×
105M
⊙and an age of 1–2 Myr.
5 C O M PA R I S O N W I T H P R E V I O U S S T U D I E S
We will now compare our derived massive stellar content for NGC 3125 with those published in the literature. Optically derived properties will be compared with Kunth & Sargent (1981), VC92 and Schaerer et al. (1999) whereas UV comparisons will be made
to theHST/STIS survey of Chandar et al. (2004).
5.1 Optical studies
Table 7 compares the measured line fluxes for HeIIλ4686 and
CIVλ5808 for regions A and B in this study to those from the
literature, showing, in general, very good agreement. Differences in line luminosities (for a uniform distance) and, hence, WR con-tent, relate primarily to reddening. Recall from Section 8, Kunth & Sargent (1981) derived reddenings from high Balmer lines, ne-glecting corrections for stellar absorptions. VC92 obtained
redden-ings from Hα/Hβobserved during different conditions. Schaerer
et al. (1999) applied erroneous reddenings from the literature,
D
o
w
n
lo
a
d
e
d
fro
m
h
ttp
s:
//a
ca
d
e
mi
c.
o
u
p
.co
m/
mn
ra
s/
a
rt
icl
e
-a
b
st
ra
ct
/3
6
8
/4
/1
8
2
2
/1
1
5
8
5
7
7
b
y
U
n
ive
rsi
ty
o
f S
h
e
ffi
e
ld
u
se
r
o
n
0
8
A
p
ri
l 2
0
1
including a foreground extinction ofE(B−V)=0.25 rather than
AV=3.1E(B−V)=0.25, although their assumed total extinction
fortuitously closely agrees with Vacca & Conti.
The major uncertainty in the derived WR content (for our derived reddening) results from the adopted line luminosity calibration. For WN subtypes, Kunth & Sargent (1981) adopted a dominant
mid-type WN population due to the marginal detection of NIVλ4058
emission. We support this on the basis that both NIVλλ4603-20
and NIIIλλ4634-41 are weak due to the contribution by CIIIλ4650
from WC stars (recall Fig. 5). In contrast, VC92 and Schaerer et al. (1999) adopted a dominant late-type WN population, albeit with a
similar HeIIline luminosity due to their inclusion of WN6 subtypes.
For WC subtypes, both Schaerer et al. (1999) and this study adopted a dominant early-type WC population on the basis that
CIIIλ5696 is weak/absent. Both studies adopt a similar CIVλ5808
line luminosity as Crowther & Hadfield (2006) supported the earlier result of Smith, Shara & Moffat (1990b) using an increased LMC sample.
Previous studies of the O star populations have been based on Hβ
fluxes derived from slit spectroscopy. Kunth & Sargent (1981) and VC92 assumed that WR stars do not contribute to the Lyman
con-tinuum and estimate O star populations of∼2000–2400. Schaerer
et al. (1999) derived O star populations from Hβspectroscopic line
fluxes, but with the addition of correcting for the WR contribu-tion and the evolucontribu-tion of the O star populacontribu-tion, revising the O star numbers for NGC 3125-A and -B to 3240–6470 and 3450–6900, respectively. In contrast, this study has derived O star populations
using Hαimaging for the Giant HIIregions, plus SB99 continuum
fits to UV/optical spectroscopy for the clusters. For the latter, plus
reduced reddenings, we estimateN(O)A1+2=1100 andN(O)B1+2=
450. Differences between these and previously published results are again primarily attributed to adopting lower reddenings.
5.2 UV studies
In Section 4.1.2, we have derived a content of 110 WN5–6 stars
for NGC 3125-A1 from theHST/STIS HeIIλ1640 line flux, whilst
Chandar et al. derived a content of 5000 late WN stars from the same data set (using an extraction window of 15 pixels versus 13 pixels here, and neglecting slit losses). The origin of this
ma-jor difference is not due to the assumed intrinsic HeIIλ1640 line
luminosity, since we assume a higher value of 1.8×1037erg s−1
per WN star (Crowther & Hadfield 2006) versus 1.2×1037adopted
by Chandar et al. (2004). As with the optical data, we have found that the difference between WR populations derived here and those published by Chandar et al. can be readily explained by differences in the adopted internal extinction law.
The Calzetti et al. (1994) law was obtained using IUE large
aperture (10×20 arcsec2) observations of distant starbursts with
a median distance of 60 Mpc, i.e. a physical scale of∼3 kpc. These
observations sample a composite of stars and gas, suffering differ-ent extinction properties. In contrast, the SMC law of Bouchet et al.
(1985) was obtained fromIUEobservations of individual stars at a
distance of∼60 kpc, i.e. a physical scale of 3 pc. Consequently, our
HST/STIS spectroscopy (0.2×0.3 arcsec2) of cluster A1, sampling
a physical scale of 10×15 pc, is most naturally suited to a
low-metallicity stellar extinction law since the aperture is dominated by stellar extinction properties rather than interstellar gas.
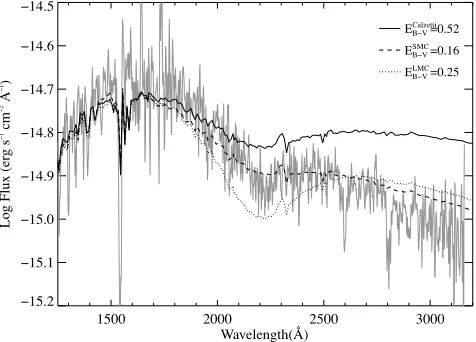
In Fig. 8, we compare the complete STIS spectrum of cluster A1 with various 4 Myr, LMC metallicity SB99 SEDs (Section 4.2) that have been reddened to reproduce the observed 1250–1600 Å contin-uum flux distribution. For the first example, the SED has been
red-1500 2000 2500 3000
Wavelength(Å)
s
gr
e(
x
ul
F
g
o
L
1mc 2Å 1)
ECalzetti
=0.52
ESMC
=0.16
[image:11.612.321.559.65.236.2]ELMC =0.25
Figure 8. Comparison between the complete slit-loss correctedHST/STIS spectrum of A1 (faint solid) and 4 Myr, LMC-metallicity SB99 flux distri-butions reddened according to (a) Calzetti et al. (1994) starburst extinction law withEINT(B−V)=0.52 (solid); (b) Howarth (1983) LMC extinction
law withEINT(B −V)=0.25 (dotted); (c) Bouchet et al. (1985) SMC
extinction law withEINT(B−V)=0.16 (dashed). A Milky Way foreground
extinction ofE(B−V)=0.08 has been applied in all cases and have been normalized at 1600 Å.
dened using a starburst extinction law for which we obtainEINT(B
−V)=0.52, as derived by Chandar et al. (2004). A cluster mass
of 2×10⁶M
⊙is needed to match the observed 1600 Å continuum
flux. However, the SED is highly discrepant in the near-UV, in the sense that the predicted continuum flux is 60 per cent too high. In-deed, if Chandar et al. had selected a different wavelength interval (e.g. 1600–2000 Å), they would have derived a significantly lower
reddening [e.g.EINT(B−V)=0.4 mag] for the same Calzetti et al.
law.
In Fig. 8, we also include SB99 SEDs reddened to match the 1250–1600 Å slope using the SMC (Bouchet et al. 1985) and LMC (Howarth 1983) extinction laws. The former shows good
overall agreement, using EINT(B − V) = 0.16 and M =2.0×
105M
⊙, including the weak 2175-Å feature and gives the
clos-est match to the observed continuum flux in the near-UV. For the
LMC law, the far-UV slope is reproduced with EINT(B − V)=
0.25(3.5×10⁵M
⊙). In this case, however, the 2175-Å feature is
overestimated and the near-UV continuum flux is poorer than that for the SMC extinction law.
Consequently, it is not possible to derive a consistent reddening for NGC 3125-A1 using a starburst SED with either an LMC or Calzetti extinction law. In contrast, we obtain an excellent match to the observed UV SED for our optically derived reddening with a starburst SED and an SMC extinction law and an internal extinction
in excellent agreement with our nebular derived Hα/Hβreddening.
6 C O N C L U S I O N S
We have demonstrated that the WR populations of the two regions NGC 3125-A and B are substantially lower than previous optical studies, and dramatically lower than previous UV studies of the
bright cluster A1 within the giant HIIregion A. Indeed, previous
highly discrepant UV and optical results for NGC 3125-A may be
reconciled using a Hα:Hβderived reddening and an SMC
extinc-tion law for the internal extincextinc-tion. We have obtained refined WR populations in these regions by applying template spectra of
typ-ical WN and WC stars to the blue λ4686 bump, which indicate
D
o
w
n
lo
a
d
e
d
fro
m
h
ttp
s:
//a
ca
d
e
mi
c.
o
u
p
.co
m/
mn
ra
s/
a
rt
icl
e
-a
b
st
ra
ct
/3
6
8
/4
/1
8
2
2
/1
1
5
8
5
7
7
b
y
U
n
ive
rsi
ty
o
f S
h
e
ffi
e
ld
u
se
r
o
n
0
8
A
p
ri
l 2
0
1
that WC stars, may contribute significantly to the observedλ4640
feature, commonly attributed solely to NIIIλ4640 from late WN
stars.
Chandar et al. (2004) argued that the presence of strong HeII
λ1640 emission in A1 implies an exceptional WR population with
N(WR)/N(O)>1. However, evolutionary models for single stars at
LMC metallicities predict a maximumN(WR)/N(O) ratio of∼0.1
for an instantaneous burst (Schaerer & Vacca 1998), whilst we
es-timate values of N(WR)/N(O)∼ 0.1–0.2 for clusters within the
giant HIIregions NGC 3125-A and B. Consequently, our results
broadly reconcile the observed massive stellar content of NGC 3125-A and B with evolutionary predictions for a young LMC metallicity starburst.
The primary difference between the two UV studies was the choice of extinction law. A standard starburst extinction law is
ide-ally suited to spatiide-ally unresolved stellar galaxies, such as high-z
LBGs, but when combined with a starburst, SED is unable to repro-duce the UV spectrum of a resolved star cluster such as NGC 3125-A1 or Tol 89-1 (Sidoli, Smith & Crowther 2006). In such cases, an SMC (or LMC) reddening law is necessary to correct the complete UV spectrum for extinction. Consequently, results derived from the
dereddened HeIIλ1640 flux for other nearby WR clusters by
Chan-dar et al. should be treated with caution for the present.
We have also demonstrated that the O star content derived from
Hαnarrow-band imaging is substantially higher than that estimated
from continuum flux techniques. On the basis of near-IR imaging of NGC 3125, we propose that the discrepancy for region A can be resolved by the presence of an additional cluster which is optically obscured. Such clusters appear to be common in LMC-like metallic-ity starburst galaxies such as NGC 5253 and He2–10 (Turner et al. 2000; Vacca et al. 2002). For region B, the O star content may be re-solved by the identification of two additional knots to the north-west of region B which are bright at near-IR wavelengths.
This study emphasizes the need for the highest possible spatial resolution. We have attempted to evaluate the properties of the two optically visible clusters within region A based on a pair of broad-band UV (FOC) and far-red (STIS) flux ratios, plus the proper-ties of the clusters within region B from a single, composite UV measurement. Refined properties for clusters within NGC 3125 re-quire high spatial resolution data sets spanning the UV to near-infrared (near-IR), as recently undertaken by program GO 10400
(P.I.R. Chandar) using the HST Advanced Camera for Surveys
(ACS) and Near Infrared Camera and Multi-Object Spectrometer (NICMOS).
AC K N OW L E D G M E N T S
We wish to thank Bill Vacca for providing us with the ‘red’ CTIO spectrum of NGC 3125-A and for various communications which helped with the analysis. We also appreciate suggestions made by an anonymous referee which helped improve this manuscript. Some of the data presented in this paper were based on observations made
with the NASA/ESA HST, obtained from the data archive at the
Space Telescope Science Institute (STScI). The STScI is operated by the association of Universities for Research in Astronomy, Inc. under the NASA contract NAS 5-26555. LJH acknowledges finan-cial support from the PPARC; PAC acknowledges finanfinan-cial support from the Royal Society.
R E F E R E N C E S
Bouchet P., Lequeux J., Maurice E., Prevot L., Prevot-Burnichon M. L., 1985, A&A, 149, 330
Calzetti D., Kinney A. L., Storchi-Bergmann T., 1994, ApJ, 429, 582 Chandar R., Leitherer C., Tremonti C. A., 2004, ApJ, 604, 153 Crowther P. A., Smith L. J., 1996, A&A, 305, 541
Crowther P. A., Dessart L., 1998, MNRAS, 296, 622 Crowther P. A., Hadfield L. J., 2006, A&A, 449, 711
Crowther P. A., Hillier D. J., Evans C. J., Fullerton A. W., De Marco O., Willis A. J., 2002b, ApJ, 579, 774
Crowther P. A., Dessart L., Hillier D. J., Abbott J., Fullerton A. W., 2002a, A&A, 392, 653
Heap S. R., Lanz T., Hubeny I., 2006, ApJ, 638, 409 Heckman T. M., 1998, ASP, 148, 127
Howarth I. D., 1983, MNRAS, 203, 301 Hummer D., Storey P. J., 1987, MNRAS, 224, 801 Kennicutt R., 1984, ApJ, 287, 116
Kunth D., Sargent W., 1981, A&A, 101, L5
Lauberts A., Valentijn E. A., 1989, The surface photometry catalogue of the ESO-Uppsala galaxies. European Southern Observatory, Garching Leitherer C. et al., 1999, ApJS, 123, 3
Leitherer C., Leao J. R. S., Heckman T. M., Lennon D. J., Pettini M., Robert C., 2001, ApJ, 550, 724
Madau P., Ferguson H. C., Dickinson M., 1996, MNRAS, 283, 1388 Martins F., Schaerer D., Hillier D. J., 2002, A&A, 382, 999 Martins F., Schaerer D., Hillier D. J., 2005, A&A, 287, 803
Massey P., Puls J., Pauldrach A. W. A., Bresolin F., Kudritzki R. P., Simon T., 2005, ApJ, 627, 477
Mokiem M. R. et al. 2006, A&A, submitted Russell S. C., Dopita M., 1990, ApJS, 74, 93 Schaerer D., Vacca W. D., 1998, ApJ, 497, 618
Schaerer D., Contini T., Pindao M., 1999, A&A, 341, 399 Schlegel D. J., Finkbeiner D. P., Davis M., 1998, ApJ, 500, 525 Seaton M. J., 1979, MNRAS, 187, 73P
Shapley A. E., Steidel C. C., Pettini M., Adelberger K. L., 2003, ApJ, 588, 65
Sidoli F., Smith L., Crowther P. A. 2006, MNRAS, submitted Smith L. F., Shara M. M., Moffat A. J., 1990a, ApJ, 358, 229 Smith L. F., Shara M. M., Moffat A. J., 1990b, ApJ, 348, 471 Smith L. F., Shara M. M., Moffat A. J., 1996, MNRAS, 281, 229 Steidel C. C., Giavalisco M., Pettini M., Dickinson M., Adelberger K. L.,
1996, ApJ, 462, L17
Turner J. L., Beck S. C., Ho P. T. P., 2000, ApJ, 532, L109 Vacca W., 1994, ApJ, 421, 140
Vacca W., Conti P., 1992, ApJ, 401, 543 (VC92) Vacca W., Johnson K. E., Conti P. S., 2002, AJ, 123, 772
This paper has been typeset from a TEX/LATEX file prepared by the author.
D
o
w
n
lo
a
d
e
d
fro
m
h
ttp
s:
//a
ca
d
e
mi
c.
o
u
p
.co
m/
mn
ra
s/
a
rt
icl
e
-a
b
st
ra
ct
/3
6
8
/4
/1
8
2
2
/1
1
5
8
5
7
7
b
y
U
n
ive
rsi
ty
o
f S
h
e
ffi
e
ld
u
se
r
o
n
0
8
A
p
ri
l 2
0
1


![Figure 6. Comparison between the slit loss corrected, dereddened [solid line) with a 2.0ETOT(B − V ) = 0.08(GAL) + 0.16(SMC)] HST/STIS spectrum of A1 (the faint × 105 M⊙ SB99 synthetic spectrum obtained usingLMC/SMC template OB stars for 1250–1600 Å (the s](https://thumb-us.123doks.com/thumbv2/123dok_us/8084808.229803/8.612.90.520.69.380/comparison-corrected-dereddened-spectrum-synthetic-obtained-usinglmc-template.webp)