Atmospheric Water Estimation Using GNSS Precise
Point Positioning Method
Chayanin Hankansujarit1,a and Constantin-Octavian Andrei1,2,b,*
1Faculty of Engineering, Chulalongkorn University, Bangkok 10330, Thailand
2Department of Geodesy and Geodynamics, Finnish Geospatial Research Institute, National Land Survey, Finland
E-mail: a[email protected],boctavian.andrei@nls.fi (Corresponding author)
Abstract. The rapid adoption of the GNSS (Global Navigation Satellite System) technology in our modern daily life brings the opportunity to investigate its applicability to areas beyond positioning, navigation and timing, such as meteorology. Due to its high accuracy performance, GNSS (PPP) Precise Point Positioning has become an attractive tool to retrieve the precipitable water vapor (PWV) from the atmosphere. Apart of the GNSS observations, PPP PWV retrieval also requires surface pressure and temperature measurements to calculate precisely the wet part of the tropospheric delay and convert it to PWV. This research reports on the atmospheric water estimation using GNSS PPP method. GNSS observations from CUSV IGS tracking station are combined with IGS precise data in order to obtain the best PPP estimates. Forward and backward solutions are combined using a weighted normalized approach. In addition, observation data from two meteorological stations is used in PWV estimation. The numerical analysis covered the entire year of 2016. Our analyses show that PPP combined solutions are in very good agreement with IGS official products in terms of coordinates and zenith tropospheric delays. In addition, PPP PWV estimates display seasonal and temporal variation in the water content of the atmosphere. The PWV values over 65 mm were found to be from May to November, whereas they were on average 20% lower for the other months of the year. Furthermore, PWV estimates were found to be correlated with local rainfall events recorded at the meteorological stations. Our research concludes that GNSS data processing using PPP method provides high accuracy solution that may be used for retrieving reliably information about the water content in the atmosphere.
Keywords:GNSS, PPP, PWV, troposphere, water content.
ENGINEERING JOURNALVolume 22 Issue 6 Received 30 May 2018
DOI:10.4186/ej.2018.22.6.37
1. Introduction
The importance of meteorological analysis of the atmosphere has increased over the past years. A detailed analysis of the humidity field is an important precondition for better monitoring of local and regional extreme precipitation events for forecasts with improved spatial resolution.
Global Navigation Satellite System (GNSS) technology has become a key component of our modern digital society. When GNSS satellite signals travel from space to earth, they are affected by various error sources. Depending on the strategy to correct these errors, a GNSS receiver can provide location information with an accuracy varying from couple of meters down to sub-centimeter level. Positioning, navigation and timing are the main fields of GNSS applications. On the other hand, if we know very accurately the position of the GNSS receiver and satellite transmitter sensors, then the GNSS signals become a rich source of information for monitoring the actual source of the GNSS errors, such as atmospheric errors.
Troposphere is the lower layer of the atmosphere that surrounds the Earth and mainly consists of dry gases (e.g., nitrogen, oxygen, carbon dioxide) and a variable amount of water vapor. The effect caused by the troposphere normally refers as tropospheric delay. The delay is usually mapped from the line of sight to the zenith direction [1]. In GNSS positioning, the tropospheric delay is usually com-puted by means of refractivity models using surface meteorological measurements (e.g., Saastamoinen, Hopfield, MOPS). Some models explicitly depend on the surface meteorological data, while others are dependent on location and day of year. However, for high accuracy applications, the tropospheric delay is estimated along with other unknown parameters within the GNSS data processing software. The estimation process has been done traditionally using software packages implementing differential processing method [2, 3]. On the other hand, in recent years, an alternative way has emerged by using the Precise Point Positioning (PPP) method [4, 5, 6].
The zenith tropospheric delay (ZTD) consists of the hydrostatic and wet components. The zenith hydrostatic delay (ZHD) is about 90% of the total delay and varies with the local atmospheric pressure [1]. Conversely, the zenith wet delay (ZWD) accounts for only 10% but less predictable due to the variability of the water content even with surface measurements (i.e., local temperature and relative humidity). Therefore, one can estimate the precipitable water vapor (PWV) in the atmosphere if ZWD part is known. As a result, our study aims first to determine the best PPP ZTD values, then derived the ZWD component and finally estimate PWV.
The rest of the paper is organized as follows. Section 2 explains the methodology used in our study referring to the data preparation, processing and analysis. Section 3 presents and discusses the numerical results of the experiment. Section 4 summarizes the main conclusions of our findings. In addition, an acknowledgement section and a list of references are included.
2. Methodology
In this section, we explain briefly the reasons behind the study area (section 2.1), how the data were prepared for our study (section 2.2), what hardware and software were used (section 2.3), and how we carried out the data processing and analysis (section 2.2.4). The section ends with the work-flow diagram depicting the main processes involved in our study.
2.1. Study Area
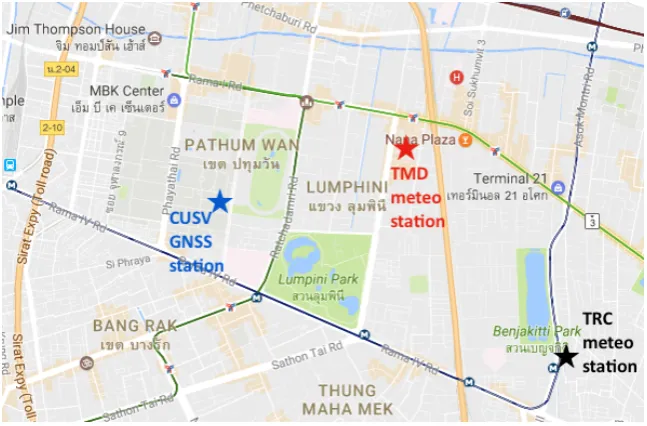
Fig. 1. Location of GNSS and meteorological stations used in this research.
September is the wettest month with an average of 344 mm of rainfall1. Based on the above facts, we decided to prepare all necessary data to cover one full year (i.e., 2016).
2.2. Data and Software
Three different type of data are required for our study: GNSS data, precise data, and meteorological data. They are shortly explained below.
2.2.1. GNSS data
GNSS observation and navigation data files were logged at CUSV IGS tracking station (Fig. 1), located in the campus area of Chulalongkorn University, central Bangkok. The files came in RINEX format at 30 sec epoch interval. Although GPS and GLONASS observations were available, only GPS observations were processed. All together 364 daily files were available. There were no observations for DOY 25 and 351. This data is necessary to compute an approximate initial position at the respective site.
2.2.2. Precise data
Apart of GNSS data, PPP data processing method requires precise corrections to various errors sources that affect the GNSS signals [7, 8, 9]. Since 1994, the International GNSS Service (IGS) has provided the highest quality data and products as the standard for GNSS in support of Earth science research, multidisciplinary applications, and education [10]. The products are accessible publicly from the IGS archive2.
Our study required the following IGS precise products: precise satellite ephemeris, precise clocks, earth rotation parameters, and antenna phase center offsets and variation. In addition, the ocean loading web-service from Onsala Space Observatory3was used to generate the required ocean loading parame-ters. All these data files are required by the PPP processing.
Furthermore, CUSV belongs to the IGS legacy network. Thus, precise coordinates and velocities as well as zenith tropospheric path delay estimates are produced as byproducts of IGS analyses. We downloaded and used these data files for validation purposes.
1https://www.tmd.go.th/en/ 2ftp://ftp.igs.org/
DOI:10.4186/ej.2018.22.6.37
2.2.3. Meteorological data
Meteorological data had to be obtained from a different location since CUSV is not equipped with meteo sensors. Thus, two meteo stations were identified in the CUSV vicinity (Fig. 1). One station belongs to Thai Meteorological Department (TMD) and is located about 3.3 km from the campus. The other station belongs to Thai Red Cross (TRC) and is located about 1.7 km from the campus. The TMD station provided meteo parameters (pressure, temperature, and rainfall) at three-hour temporal resolution starting from 01:00AM. The TMD data was available for the entire year. We used these data to compute PWV estimates. In addition, the TRC station provided same meteo parameters but at higher resolution, i.e. 5-min intervals. Unfortunately, TRC data was available only between Jun-Nov 2016. We used these data to study the correlation between the PWV estimates and actual rainfall logs.
2.2.4. Software tools
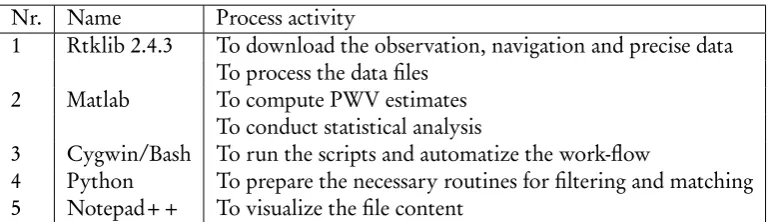
[image:4.595.105.490.331.442.2]Apart of the hardware sensors, the activities involved in our study required also the use of various software tools. They were all run on a Windows 10 notebook. Table 1 summarizes the software tools used in this study.
Table 1. Software tools and their associated process activity.
Nr. Name Process activity
1 Rtklib 2.4.3 To download the observation, navigation and precise data To process the data files
2 Matlab To compute PWV estimates To conduct statistical analysis
3 Cygwin/Bash To run the scripts and automatize the work-flow
4 Python To prepare the necessary routines for filtering and matching 5 Notepad++ To visualize the file content
2.3. Data Processing and Analysis
The RINEX and precise data files were post-processed using the PPP processing algorithm [7, 8]. PPP processes un-differenced code and carrier observations eliminating the need to collect simultaneously observations from a base station. In addition, PPP also requires complex error modeling since it pro-cesses data from a single receiver. Furthermore, PPP solutions are at decimeter or centimeter level only after a convergence period from few minutes to more than two hours [1, 11, 12, 13]. Although still challenging, recent studies have demonstrated the ambiguity resolution in PPP will shorten the con-vergence times [13, 14, 15] or even reduce it to few seconds if accurate local ionosphere corrections are used [13, 16]. Despite these undergoing challenges, PPP has become a standard for geospatial precise positioning applications, especially those suitable for post-missing processing.
Our post-processing tool implements PPP algorithm using the Kalman filter strategy, suitable for real-time applications [17], the processing results are inaccurate at the beginning of the observation ses-sion. The general recommendation is to discard such time interval from the data analysis and statistics. In order to overcome this aspect, we also process the data backward in time producing a backward so-lution. The forward and backward solutions were then combined via a python script using a weighted normalized approach. As a result, we had high confidence that we were able to produce the best daily PPP solutions over the entire time interval.
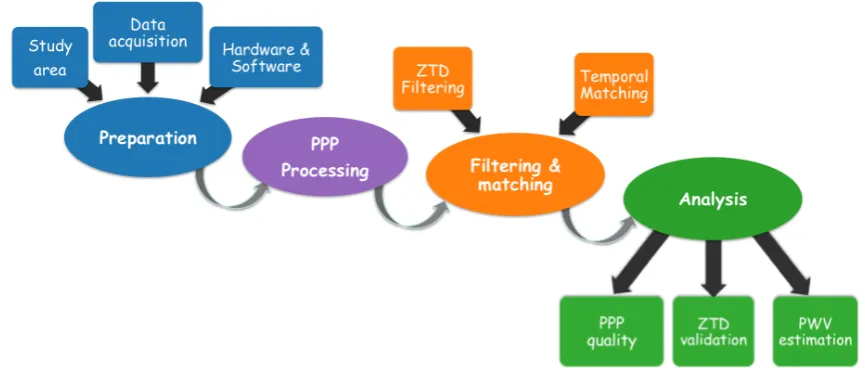
Fig. 2. Main activities and data management work-flow diagram.
In the final step of our study, we estimated PWV using the PPP ZTD values and the meteo data logged at the meteorological sensors (Fig. 1). Filtering and temporal matching was also need as the input data came at different sampling rates. Finally, we compared and looked for correlations between PPP-derived PWV estimates and actual recorded rainfall values. The entire work-flow of our data processing and analysis is depicted in Fig. 2.
3. Results and Discussions
3.1. PPP Performance in the Positioning Domain
In this section, we compare the PPP-derived positioning results against the IGS SINEX published values in order to assess the performance of the processing algorithm.
Figure 3 illustrates the accuracy of the daily PPP coordinates at CUSV in terms of East, North, and Up offsets with respect to the IGS coordinates. The agreement is excellent; the average statistic shows 1, 2, and 10 mm biases along the East, North and Up directions, respectively. In addition, most of the errors in the horizontal plane are within ±10 mm, whereas in the vertical plane they are within ±20 mm. However, two obvious outliers can be observed for the East component on DOY 314 (Nov 09) and Up component on DOY 343 (Dec 8). Since the conventional statistics are sensible to the presence of these outliers, we also report the robust statistical indicators, such as interquartile range (IQR), median (MED), and median absolute deviation (MAD). The robust statistical analysis confirms the above two outliers. In addition, four other days (DOY 086, 172, 261, 273) exhibited errors larger than 20 mm in the vertical direction. All together, the robust analysis identifies three outliers in the East, nine outliers in the North, and 11 outliers in the Up direction, respectively.
Table 2 summarizes the classical and robust statistical indicators in terms of central tendency and spread. They confirm that our processing results and PPP solutions are highly accurate with respect to the IGS published coordinates.
3.2. Validation of the PPP ZTD Values
In this section, we validate our PPP ZTD values against the IGS ZTD official products.
DOI:10.4186/ej.2018.22.6.37
[image:6.595.82.512.273.528.2]Fig. 3. Accuracy of the daily PPP solutions with respect to the IGS values for year 2016.
Table 2. Conventional and robust statistics to assess the PPP solution accuracy [unit: meter].
Conventional East North Up Robust East North Up statistic statistic
Count 364 364 364
MIN -0.015 -0.012 -0.011 25% -0.005 -0.003 0.006 MAX 0.048 0.006 0.053 75% 0.002 -0.001 0.013 Spread 0.064 0.017 0.064 IQR 0.007 0.002 0.007 AVG -0.001 -0.002 0.010 MED -0.002 -0.002 0.010 STD 0.006 0.002 0.006 MAD 0.004 0.001 0.003
Fig. 4. Accuracy of PPP ZTD combined estimates with respect to the IGS official product.
absence of the IGS values. IGS products were available for 310 days. Common epochs were available for 82.22% (i.e., 88788 epochs) of the year 2016.
Generally, the ZTD differences display peak-to-peak variations in the range of 108 mm, with an average bias of 2.4 mm and standard deviation of 5.5 mm. Robust statistical analysis revealed that most of the differences fall within -15.2 mm and 10.5 mm. In addition, 2342 differences (or 2.64%) were identified as outliers. Table 3 summarizes the statistical indicators for the ZPD differences.
3.3. Precipitable Water Vapor (PWV) Estimation
In this section, we estimate PWV using the validated PPP ZTD values and the recorded meteorological parameters for the entire year of 2016.
Table 3. Conventional and robust statistics to assess the agreement between PPP ZTD estimates and IGS official product [unit: mm].
Conventional dZTD Robust dZTD statistic statistic
Count 88788
MIN -61.0 25% -5.6
MAX 46.9 75% 0.8
Spread 108.0 IQR 6.4
AVG -2.4 MED -2.4
STD 5.5 MAD 3.2
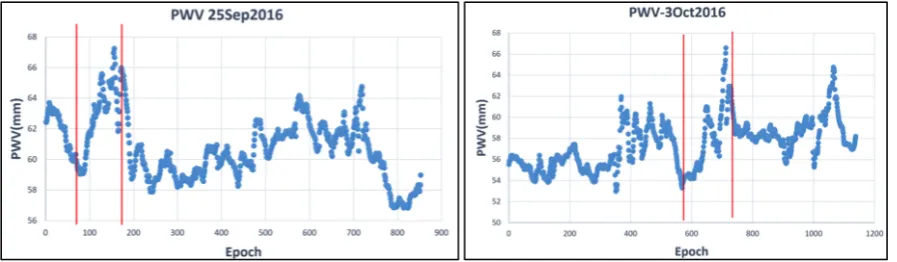
Fig. 5. Precipitable Water Vapor (PWV) derived from the PPP-based ZTD values and recorded meteo-rological parameters.
despite several peaks associated most probably with local raining events.
Table 4 summarizes the monthly variation of PPP in 2016. The lowest PWV value was found in February, whereas the highest value was found in August.
Table 4. PWV monthly variation in 2016 [unit: mm].
Month MIN MAX Month MIN MAX Month MIN MAX
Jan 15.464 57.785 May 30.001 66.646 Sep 46.962 66.723 Feb 3.873 44.273 Jun 43.303 66.539 Oct 46.533 64.401 Mar 10.139 54.752 Jul 47.338 64.675 Nov 22.773 65.477 Apr 13.211 57.516 Aug 46.962 71.774 Dec 19.050 54.450
DOI:10.4186/ej.2018.22.6.37
Fig. 6. PWV variation during a rainy day (Sep 25 and Oct 03, 2016).
4. Conclusions
This study reports on the atmospheric water vapor estimation using GNSS (Global Navigation Satellite System) observations and data from meteorological sensors. The GNSS data processing is conducted us-ing the Precise Point Positionus-ing method, as alternative to the traditional differential processus-ing method. Our PPP solutions showed very good agreement with IGS values both in terms of 3D coordinates and zenith tropospheric delays (ZTDs). PPP-derived coordinates agreed at mm level in the horizontal plane and around 20 mm in the vertical plane. In addition, PPP ZTD estimates showed 2.5 mm bias when compared to the IGS ZTD values.
Combining PPP ZTDs with actual meteorological data allowed us to estimate the amount of the precipitable water vapor (PWV) in the atmosphere. PWV estimates over the year 2016 showed the seasonal and temporal variation in the water content. High PWV values were found to be from May to November and associated with the rainy season. The estimates were over 65 mm for all months, with the highest recorded in August. For the other months, PWV values were on average 20% lower. The driest day was found to be in February, with only 3.9 mm water in the atmosphere. Furthermore, the investigation of two actual rainfall recordings revealed a sharp increased in the PWV values during the rainfall event. However, the correlation is not always evident as the meteorological parameter records zero values if there is no rainfall. On the other hand, PPP-derived PWV are always above zero as there is always water in the atmosphere.
These analyses and findings allow us to conclude that GNSS data processing using PPP method provides high accuracy solutions that may be used for retrieving information about the water content in the atmosphere. These findings create a solid foundation to extend the studies over a local / regional GNSS network that will allow deriving a local tropospheric model or to investigate the usage of high-rate GNSS as meteorological tool for water content estimation.
Acknowledgement
This research was partially supported by the Chulalongkorn University Faculty of Engineering Research Grant no.001/2559. Thai Meteorological Department and Thai Red Cross provided the meteorological data. Mr. Chaiyut Charoenphon acted as communication facilitator.
References
[2] M. Bevis, S. Businger, S. Chiswell, T. A. Herring, R. A. Anthles, C. Rocken, and R. H. Ware, “GPS Meteorology: Mapping Zenith Wet Delays onto Precipitable Water,”Journal of Applied
Me-teorology, vol. 33, no. 3, pp. 379–386, Mar. 1994.
[3] C. Pikridas, S. Katsougiannopoulos, and N. Zinas, “A comparative study of zenith tropospheric delay and precipitable water vapor estimates using scientific GPS processing software and web based automated PPP service,”Acta Geodaetica et Geophysica, vol. 49, no. 2, pp. 177–188, 2014. [4] Y. Yuan, K. Zhang, W. Rohm, S. Choy, R. Norman, and C. Wang, “Real-time retrieval of
pre-cipitable water vapor from GPS precise point positioning,”Journal of Geophysical Research:
Atmo-spheres, vol. 119, no. 16, pp. 10 044–10 057, 2014.
[5] X. Li, G. Dick, C. Lu, M. Ge, T. Nilsson, T. Ning, J. Wickert, and H. Schuh, “Multi-GNSS Mete-orology: Real-Time Retrieving of Atmospheric Water Vapor from BeiDou, Galileo, GLONASS, and GPS Observations,”IEEE Transactions on Geoscience and Remote Sensing, vol. 53, no. 12, pp. 6385–6393, 2015.
[6] J. de Oliveira, P. S., L. Morel, F. Fund, R. Legros, J. F. G. Monico, S. Durand, and F. Durand, “Modeling tropospheric wet delays with dense and sparse network configurations for PPP-RTK,”
GPS Solutions, vol. 21, no. 1, pp. 237–250, 2017.
[7] J. Zumberge, M. B. Heflin, D. Jefferson, M. Watkins, and F. Webb, “Precise point positioning for the efficient and robust analysis of GPS data from large networks,”Journal of Geophysical Research, vol. 102, no. B3, pp. 5005–5017, 1997.
[8] J. Kouba, “A Guide to using international GPS Services (IGS) Products,” Ottawa, Ontario, p. 34, May 2009, available at: http://kb.igs.org/hc/en-us/articles/201271873-A-Guide-to-Using-the-IGS-Products.
[9] C.-O. Andrei, D. Salazar, and R. Chen, “Performance analysis of the Precise Point Positioning technique at BUCU IGS station,” RevCAD Journal of Geodesy and Cadastre, vol. 10, pp. 9–20, 2010.
[10] J. M. Dow, R. E. Neilan, and C. Rizos, “The International GNSS Service in a changing landscape of Global Navigation Satellite Systems,”Journal of Geodesy, vol. 83, no. 3-4, pp. 191–198, 2009. [11] C.-O. Andrei, R. Chen, H. Kuusniemi, M. Hernández-Pajares, J. M. Juan, and D. Salazar,
“Iono-sphere Effect Mitigation for Single-frequency Precise Point Positioning,” inProceedings of 22st
In-ternational Technical Meeting of the Satellite Division (ION GNSS-2009), Savannah, GA, Sep. 22–25
2009, pp. 2508–2517.
[12] C.-O. Andrei, A. Kukko, H. Kaartinen, and C. Satirapod, “Precise carrier phase-based point po-sitioning of boat-mounted terrestrial remote sensing platform,” inInternational Conference on
Lo-calization and GNSS 2014 (ICL-GNSS 2014), Helsinki, June 2014, pp. 1–6.
[13] S. Choy, S. Bisnath, and C. Rizos, “Uncovering common misconceptions in GNSS Precise Point Positioning and its future prospect,”GPS Solutions, vol. 21, no. 1, pp. 13–22, 2017.
[14] J. Shi and Y. Gao, “A comparison of three PPP integer ambiguity resolution methods,”GPS
Solu-tions, vol. 18, no. 4, pp. 519–528, Oct 2014.
[15] A. Rovira-Garcia, J. Juan, J. Sanz, G. Gonzalez-Casado, and E. Bertran, “Fast Precise Point Posi-tioning: A System to Provide Corrections for Single and Multi�frequency Navigation,”Navigation, vol. 63, no. 3, pp. 231–247, 2016.
[16] S. Banville, P. Collins, W. Zhang, and R. B. Langley, “Global and regional ionospheric corrections for faster PPP convergence,”Navigation, Journal of the Institute of Navigation, vol. 61, no. 2, pp. 115–124, 2014.
![Table 2. Conventional and robust statistics to assess the PPP solution accuracy [unit: meter].](https://thumb-us.123doks.com/thumbv2/123dok_us/8106679.235299/6.595.82.512.273.528/table-conventional-robust-statistics-assess-solution-accuracy-meter.webp)
![Table 3. Conventional and robust statistics to assess the agreement between PPP ZTD estimates andIGS official product [unit: mm].](https://thumb-us.123doks.com/thumbv2/123dok_us/8106679.235299/7.595.80.520.113.450/table-conventional-robust-statistics-agreement-estimates-ocial-product.webp)