This is a repository copy of Keynes and the cotton industry: a reappraisal. White Rose Research Online URL for this paper:
http://eprints.whiterose.ac.uk/3437/
Monograph:
Higgins, D., Toms, S. and Filatotchev, I. (2007) Keynes and the cotton industry: a reappraisal. Working Paper. Department of Management Studies, University of York
eprints@whiterose.ac.uk Reuse
Items deposited in White Rose Research Online are protected by copyright, with all rights reserved unless indicated otherwise. They may be downloaded and/or printed for private study, or other acts as permitted by national copyright laws. The publisher or other rights holders may allow further reproduction and re-use of the full text version. This is indicated by the licence information on the White Rose Research Online record for the item.
Takedown
If you consider content in White Rose Research Online to be in breach of UK law, please notify us by
promoting access to White Rose research papers
Universities of Leeds, Sheffield and York
http://eprints.whiterose.ac.uk/
White Rose Research Online URL for this paper: http://eprints.whiterose.ac.uk/3437/
Published work
Higgins, D, Toms, S, Filatotchev, I (2007) Keynes and the cotton industry: a
University of York
The York Management School
Working Paper No. 29
ISSN Number: 1743-4041
Keynes and the Cotton Industry: A Reappraisal
David Higgins
Steven Toms
both, University of York
and
Igor Filatotchev
King’s College, London
ABSTRACT
The paper reinterprets Keynes’s analysis of the crisis in the Lancashire cotton industry in the 1920s. It presents empirical evidence showing that syndicates of local shareholders, but not the banks, were an important brake on firms exiting, at a time when exit barriers were otherwise unproblematic in this competitive industry. Moreover, syndicates milked firms of any profits through dividends, thereby limiting reinvestment and re-equipment possibilities. The case shows that where laissez-faire fails in response to a crisis, the associated response may need to assess both ownership structure and its relationship to competitive industry structure.
Keywords: Keynes, Cotton, Banks, Syndicates
Keynes and the cotton industry: A reappraisal
1. Introduction
In the End of Laissez-Faire writing against the backdrop of the inter-war economic crisis, Keynes (1927, pp. 46-7) argued that the role of the government is not to try to do what is being done better, but to do what is not being done. For Keynes, there was no better illustration of this point than the Lancashire cotton textile industry. As demand in overseas export markets collapsed, creating a serious problem of over-capacity, the industry’s large number of relatively small firms competed intensely on the basis of marginal cost pricing. For Keynes the solution was the reorganisation of the industry. An important obstacle was the intractability of the incumbent management and financial stakeholders. The banks might have promoted reorganisation, but were ‘professional paralytics’, and it was ‘against their tradition to do anything whatsoever in any conceivable circumstances’ (Keynes, 1981, 605). He also called for the dismissal of the vast majority of cotton company directors, adding that the people required to vote on such a proposal were precisely those directors (Keynes, 1981: 631). However, Keynes was careful in his choice of scapegoats. In particular he sought to avoid implicating those responsible for the re-financing of the industry already carried out in the boom of 1919-20. Contemporary commentators who stressed the problems resulting from these events, were criticised by Keynes for finding easy solace and standing in the way of educating opinion as to what he saw as the correct diagnosis (Keynes, 1928, p.199).
stakeholders on the strategies of individual firms. The results suggest that Keynes was too dismissive of the re-financing and the problems it caused and that investor groups in particular were at least as serious, if not more of an obstacle, than the banks. The assertion is important, as it shows that the Keynesian panacea of reorganisation was insufficient and that restructuring, including radical variation of ownership rights, was also required.
The paper is organised as follows. In Section 2 we compare and contrast the key features of Keynes’s analysis of the industry’s problems with those of other informed contemporaries. Particular emphasis is placed on the observation that, unlike his contemporaries, Keynes was generally dismissive of the impact of re-flotation. In Section 3 the composition of financial syndicates is analysed. Notwithstanding contemporary and subsequent debates, there is no prior empirical evidence concerning the composition of these groups. Indeed there are only passing references to ‘London’ and ‘Metropolitan’ syndicates and our research shows that these references are partially and materially inaccurate. Section 4 examines the role of investor groups, both syndicates and banks, and their impact on firm level performance outcomes, using a financial data set and appropriate econometric models. The comparative impact of bank lending and financial syndicate investment is assessed. Conclusions are presented in Section 5.
2. Keynesian and other interpretations of the collapse
respectively of their 1913 level. For yarn exports, the relevant figures were 80% and 66% respectively.i Of particular importance in this collapse were the loss of the Indian
market and Japanese competition in third markets. In 1913, out of a total British production of approximately 700 million yards of cotton piece goods, 43 % by quantity and 36% by value, were exported to India.ii By the 1930s, Indian production of cotton
piece goods and yarn was 34% and 131% greater, respectively, than its pre-war average. A number of factors, including the disruption caused by the war, reduced shipping facilities, growing nationalism and increasing tariff protection, account for India’s reduced dependence on Lancashire exports. The reversal in the Indian market was exacerbated by Japanese competition. Between 1914 and 1930, Japan’s share of Indian imports of cotton piece goods increased over a hundred-fold, and Bowker (1928) estimated that Japanese penetration of the Chinese market was responsible for 17.6% of the decline in Lancashire’s exports.
However, although these basic facts were well known to contemporaries there was less agreement on what the industry should have done in order to restore its competitiveness. For convenience, we contrast two interpretations: one is Keynes’ view that reorganisation was required but the banks and industry directors prevented this outcome. The second is that advanced by other contemporaries that world economic conditions were to blame and recapitalization simply made matters worse (Daniels and Jewkes, 1928, p.182).
aggravated financial losses, and led to ‘financial exhaustion’, (Keynes, 1981, p.582; p.590; p.597; 602;). Keynes was adamant that while a policy of short-time working might be desirable to meet temporary disturbances in trade, it was absolutely disastrous as a long-term solution (Keynes, 1981, p. 588; p.598). In any case, as he pointed out, the actual practice of short-time working was very badly organised (Keynes, 1981, pp.596-7).
The solutions to short-time working proposed by Keynes were threefold: the elimination of weak-sellers (those selling output below cost), the adjustment of surplus capacity and rationalisation to achieve appropriate economies (Keynes, 1981, p.598). Why, then, was the required contraction in capacity not forthcoming? Keynes position on this was clear: the banks had lent so much to the industry, particularly its financially weaker companies, that they were loath to let their debtor companies go bankrupt, even though this would have accelerated the adjustment of capacity in the industry (Keynes, 1981, p.605). In Keynes’ perspective, the banks could have promoted change in the industry (Keynes, 1981, p.603; p.614), but chose not too (authors’ emphasis). Whilst castigating the banks, Keynes dismissed the significance of the re-capitalisation boom:
‘The industry is riddled with unsound finance; some of it the result of the over-capitalisation of the boom period….If high capitalisation and bad management were the essential troubles, reconstructions and bankruptcies might be the right solution. But they are only secondary troubles. The real trouble – and this is the beginning, the middle and the end of my argument – is surplus capacity.’ (Keynes, 1981, pp.603-4).
629-31). Therefore as far as Keynes was concerned, the writing-off of capital was trivial and the important challenge was reorganisation.
In this respect, Keynes was not unique. Turning to the general problem of excess capacity there was recognition that rationalisation and re-organisation could improve the competitive position of industry, but the existence of a large fringe of small producers hampered the efforts of big firms trying to secure these efficiencies (MacGregor, 1927, 528). John Ryan, (Managing Director of the Lancashire Cotton Corporation), argued that amalgamation and re-organisation would simultaneously help Lancashire to improve her international competitiveness and provide relief the spinning section which wasa labouring under heavy financial losses (Ryan, 1930, 359). In the specific case of the Lancashire cotton textile industry, the historiography since strongly endorses the Keynesian interpretation. Most acknowledge that over-capacity was a root cause (Keynes, 1981, Porter, 1974, Bamberg, 1988, Marchionetti, 1995, Bowden and Higgins, 1998). Opinions differ somewhat as to who should have taken responsibility. Bamberg adds to Keynes’ famous accusation that the bankers acted as 'a species of deaf mutes', abandoning their responsibilities (Keynes, 1981: 601), showing the competitive structure of bank lending to have been inimical to industry recovery (Bamberg, 1988: 26-30). Obstinate directors, whom Keynes suggested should be dismissed have been subsequently criticised for their ‘individualistic attitudes’ (Saxonhouse and Wright, 1987: 89), as have the unions for lack of co-operation (Lazonick, 1984: 396; Keynes, 1981: 578-637; Skidelsky, 1992: 261-3).
opinion was far from a consensus and such optimism attracted some ridicule (Dietrich, 1928, Greaves, 2000). However, unlike Keynes, many informed contemporary observers did place much greater emphasis upon the harmful effects of the recapitalisation boom. Daniels and Jewkes (1928, pp.180-181) and the report by Political and Economic Planning (1934, p.60), argued that those firms that had re-capitalised had stronger inducements to engage in price-cutting in order to secure the volumes required to cover their inflated costs. Both of these sources also suggested that the effects of recapitalisation worked against any effective joint action either regarding output restriction to raise prices (Daniels and Jewkes, 1928, p.181), or to secure amalgamation (PEP, 1931, p.60). Henry Clay, a special adviser to the Bank of England supported these views. He also argued that the supply of loan capital, which should have been available to finance re-equipment and facilitate re-organisation, had been drained away by the need of re-capitalised companies to call-up unpaid share capital in order to meet interest charges and to replace withdrawn loans (Clay, 1931, p.64).
There is a further and potentially important consequence of the presence of these outside investors. Keynes and contemporariesiii seem to agree that they had little
technical understanding or other useful knowledge of the industry (Keynes, 1981) other than perhaps its propensity to pay very generous dividends during periodic booms. In addition to the question of whether the syndicates forced firms to stay in the industry, there is the further question of their impact on business and financial strategy. Specifically it is likely that they would have forced the cotton companies to repay any profits from weak selling as dividends, so that the capacity for recovery through new investment could not be sustained. However, before testing hypotheses along these lines it is important to establish who precisely was involved in the re-capitalisation boom of 1919-1920.
3. The syndicates: scale and characteristics
To examine ownership and control characteristics of the re-capitalised companies all available annual returns from the BT31 file at the Public Record Office (PRO) were examined. The PRO has a policy of retaining a random sample of 1 in 5 company records and it was therefore appropriate to examine all surviving documents for firms that were known to be in existence, and to have been re-capitalised (as detailed in Worrall’s and Tattersalls trade directories). The process produced a sample of 41 individual company archives. Within each, share registers, articles of association and annual returns (form E) were examined to identify the directors and significant shareholders in the re-capitalised companies, the scale of their cross shareholdings, and the buy-sell and buy-hold behaviour of investing individuals and groups.
owned 31%; in Delta, the directors owned 28.3%; in Fern Mill it was 22.8%; Century Mill, 45.9%; Clover Mill, 35.6%, Belgrave, 35%, Avon, 65.4%; Argyll, 17%; Kent Mill, 12.4%. Outside ownership meanwhile was relatively rare. Only 3 out of 41 companies had examples of significant outside ownership. Beehive Cotton Spinning Company in Bolton, attracted a London investment group.iv Manchester-based William
P. Hartley (who had made money in preserves) invested in Textile Spinning Company and Asia Spinning Company. The third example was another Manchester investor, John Kenyon. It is significant that there was only one ‘metropolitan’ syndicate and that it invested in the least troubled section of the industry.v Bolton was the centre of the
fine section of the industry and was relatively untroubled by the problems of over-capacity prevalent in the Oldham-centred coarse sector. Investors in Oldham firms where not from Oldham itself, were typically from neighbouring Manchester.
Even then these outside investors were insignificant compared to the degree of inside control prevalent in the crisis-ridden Oldham section. Moreover, the Oldham insiders were interlocked. For example promoter and share dealer Sam Firth Mellor was a director of 18 companies,vi John Bunting, of the same occupation held 14. Harry
Tweedale, a sharebroker for William Deacons Bank, was a director of Dale Mill and a founding director of Arrow Spinning Co and Century Spinning Co (in which he owned, or represented, 15.4% of the initial allotment of the stock).vii Many others held multiple
be financial, involving the variation of claim-holders’ rights (Hammersley, 1931). His scheme was based on cash for equity, which as the argument below suggests was indeed necessary to rescue the industry. Compared to Keynes’s argument, it is easy to see why it was unpersuasive. His scheme not only compensated the speculators for their failure, but it also presupposed there were new investors whose expectations about the industry’s future were more optimistic than the incumbent investors (Higgins and Toms, 2003).viii
Inside directors were in any case significant and typically long-term investors. Outside investors exited completely and early, for example Hartley in 1920. Insiders made only partial disposals if at all, and such transactions usually involved stockbrokers such as Firth Mellor and Bunting. It is likely that the stockbrokers who were also directors simultaneously provided market liquidity in their own companies for potential buyers.ixEven so thetotal number of shareholders was usually quite small
and there were surprisingly few transactions, given they were quoted companies. An obvious problem was the absence of buyers after the collapse of the boom in 1920. Moreover, given the evidence from the share registers, the presence of controlling cliques of directors was in itself sufficient to impose conditions of market illiquidity.
family owned 25.3% of Anchor; the Clegg family was on the boards of Cape Mill, Textile Mill and Anchor Mill
A final and very important feature was the striking continuity between these investor groups in the Oldham section and the operations of similar groups, sometimes involving the same individuals, in the pre 1914 period. A feature of previous booms, for example in 1907 was the involvement of Bunting in the mill promotion boom (Toms, 2002). Firth Mellor and Hammersley were also involved in putting together business groups through flotation and inter-locking directorships (Farnie, 1998, p.10). Another important continuity was the involvement of successor generations. So James Henry Bunting continued his pre-war apprenticeship whilst successive generations of the architects and mill-designers A.H. Stott and Sons continued their practice of investing in the mills they helped to build.x In short, the investors of the 1919-20 re-capitalisation
boom were local, inter-connected, had intensive knowledge of the industry and were continuing well-established practice from before 1914. The connection to pre-war behaviour is important, insofar as the practices established then contributed to the subsequent failure of the industry. The next section examines the extent of that contribution.
4. Data and analysis
data were used to examine first the determinants of the decision to exit and second the determinants of financial performance.
To examine the decision to exit, and the determinants of financial performance, data and financial information for the five-year period 1926-1931 was used in the following models:
EXIT = β1+β2RECAP+ β3PUBLIC+ β4LEV+β5SIZE + µ (1)
APTC = β1+β2RECAP+ β3PUBLIC+ β4LEV+β5SIZE + µ (2)
DIV = β1+β2RECAP+ β3PUBLIC+ β4LEV+β5SIZE + µ (3)
strongly left censored, model (3) is specified as a tobit model. Model (2) is ordinary least squares.
The explanatory variables are common to both models and each is described in turn. The RECAP variable captures the fixed costs arising from governance structures. If the firm had recapitalised in the 1920 boom, it typically resold its shares to syndicates of outside investors at three times the price of non-recapitalised firms. Firms were classified 1 or 0 according to whether they had recapitalised or not. Recapitalised firms faced higher fixed costs arising from the change in ownership structure in the form of depreciation charges, dividends and interest charges. These costs are not fixed in the strict sense, for example dividends are highly discretionary, but they are sunk in the sense that they must be paid at some point if investors are to recover their committed capital. Because investors thereby had an incentive to force the firm to remain in the industry on the basis of expected future recovery of the committed investment, the expected sign on the RECAP variable is negative. RECAP also potentially proxies for a second variable of interest, the presence of syndicate investor groups.xi To observe
In addition to these categorical variables, two further continuous variables were included. First the ratio of debt to total capital, or leverage (LEV) and second, to control for size the total value of balance sheet assets of the firm are used (SIZE). The SIZE variable might also proxy for the power of incumbent managers, as a function of the value of the assets under their control. SIZE was transformed logarithmically to achieve closer proximity to normality, whereas LEV was not transformed due to a significant number of zero variables.
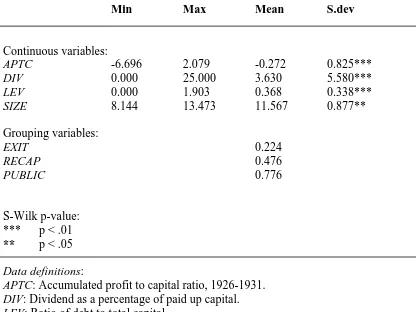
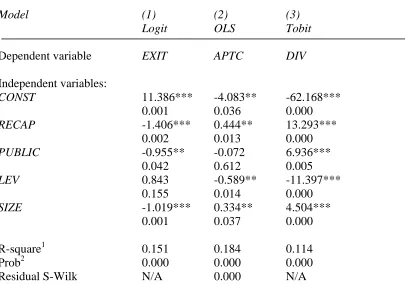
The results are presented in Tables 1-4 Tables 1 and 2 show descriptive statistics. Table 3 shows the classification of the 147 firms according to their strategy: turnaround success (APTC>0), turnaround failures (APTC<0) and exits. Table 4 shows the results for models (1), (2) and (3) above.
Table 1 about here
Table 2 about here
Table 3 about here
Table 4 about here
The RECAP variable is negative and strongly significant in model (1), showing that the presence of governance related fixed or sunk costs constitute an exit barrier. Table 3 confirms that relatively few recapitalised firms exited the industry. Where firms remained in the industry RECAP was associated with turnaround success, evidenced by the positive and significant co-efficients in models (2) and (3). The
PUBLIC variable is also negative in model (1) and significant, supporting the
Although the PUBLIC variable is insignificant in model (2) it is positive and highly significant in model (3). Public ownership, albeit by the syndicates, is therefore associated with firms staying in the industry and with turnaround success but this is manifested in the form of high dividend payments and not the accumulation of profits. In other words, syndicate investment acted as an exit barrier, helped stabilise cash flows, but undermined subsequent stages of the turnaround associated with new investment and repositioning.
Exit was positively but weakly related to high borrowing in model (1). Exiting firms had higher leverage than turnaround firms (Table 3), but the difference was marginal compared to firms unsuccessfully attempting turnarounds. In models (2) and (3) leverage was negatively and significantly related to turnaround success. In other words lenders exerted weak pressure on firms to exit and acted as a constraint for the firms that stayed in the industry and attempted turnarounds. Firms with relatively high debt were less likely to pay dividends. Jensen’s (1986) free cash flow (FCF) hypothesis suggests that opportunistic managers may try to appropriate FCF at expense of minority shareholders, and presence of fixed-claim holders may restrain this opportunism. There is some evidence from the data in Table 1 that debt holders did indeed constrain directors. The banks therefore did what they were supposed to do under the FCF hypothesis, even though for Keynes this wasn’t enough.
that enabled them to build business empires and appropriate associated rents in the pre-war period went badly wrong after 1920.
5. Discussion and conclusions
Table 1. Descriptive statistics
Min Max Mean S.dev
Continuous variables:
APTC -6.696 2.079 -0.272 0.825***
DIV 0.000 25.000 3.630 5.580***
LEV 0.000 1.903 0.368 0.338***
SIZE 8.144 13.473 11.567 0.877**
Grouping variables:
EXIT 0.224
RECAP 0.476
PUBLIC 0.776
S-Wilk p-value: *** p < .01
** p < .05
Data definitions:
APTC: Accumulated profit to capital ratio, 1926-1931. DIV: Dividend as a percentage of paid up capital. LEV: Ratio of debt to total capital.
SIZE: natural logarithm of total assets.
EXIT: Dummy variable = 1 if the firm exits, = 0 otherwise
RECAP: Dummy variable = 1 if the firm recapitalised, = 0 otherwise
Table 2. Correlation matrix (independent variables)
RECAP PUBLIC LEV SIZE
RECAP 1.0000
PUBLIC -0.1726** 1.0000
LEV 0.0985 -0.0230 1.0000 -0.0592
SIZE -0.3476*** 0.1656** 1.0000
Spearman’s Rho (below diagonal)/Pearson’s co-efficient (above diagonal) significance levels
*** p < .01
** p < .05
Data definitions:
APTC: Accumulated profit to capital ratio, 1926-1931. DIV: Dividend as a percentage of paid up capital. LEV: Ratio of debt to total capital.
SIZE: natural logarithm of total assets.
EXIT: Dummy variable = 1 if the firm exits, = 0 otherwise
RECAP: Dummy variable = 1 if the firm recapitalised, = 0 otherwise
Table 3: Descriptive statistics for strategic outcomes
STRATEGY VARIABLE
APTC DIV RECAP PUBLIC LEV SIZE
N % N N £
Turnaround
- Success 58 0.152 8.780 37 50 0.289 172,671 - Fail 56 -0.282 0.435 20 43 0.408 141,392
Exits 33 -0.999 0.000 13 21 0.436 112,631
Data definitions:
APTC: Accumulated profit to capital ratio, 1926-1931. DIV: Dividend as a percentage of paid up capital. LEV: Ratio of debt to total capital.
SIZE: natural logarithm of total assets.
RECAP: Dummy variable = 1 if the firm recapitalised, = 0 otherwise
Table 4: Regression models
Model (1) (2) (3)
Logit OLS Tobit
Dependent variable EXIT APTC DIV
Independent variables:
CONST 11.386*** -4.083** -62.168***
0.001 0.036 0.000
RECAP -1.406*** 0.444** 13.293***
0.002 0.013 0.000
PUBLIC -0.955** -0.072 6.936***
0.042 0.612 0.005
LEV 0.843 -0.589** -11.397***
0.155 0.014 0.000
SIZE -1.019*** 0.334** 4.504***
0.001 0.037 0.000 R-square1 0.151 0.184 0.114 Prob2 0.000 0.000 0.000 Residual S-Wilk N/A 0.000 N/A
Co-efficients are reported for each independent variable with respective p-values underneath. N = 147 for all models. In model (3) 95 observations are left-censored at 0. In models (1) and (2) p-values are based on White’s (1980) heteroscedasticity
consistent estimation matrix. All models were re-tested with serial deletion of
inter-correlated variables and insertion of interaction variables. The results were robust to alternative specifications. Model (2) was re-tested using a non-parametric
formulation (quantile regression). Model co-efficients signs remained unchanged and significance levels increased marginally for significant co-efficients in the OLS model.
1
Psuedo in models (1) and (3), adjusted in model (2)
2
>Chiin models (1) and (3), and > F in model (2) Two-tailed significance levels: *** p < .01, ** p < .05
Data definitions:
APTC: Accumulated profit to capital ratio, 1926-1931. DIV: Dividend as a percentage of paid up capital. LEV: Ratio of debt to total capital.
SIZE: natural logarithm of total assets.
EXIT: Dummy variable = 1 if the firm exits, = 0 otherwise
RECAP: Dummy variable = 1 if the firm recapitalised, = 0 otherwise
References
Allen, G.C. (1945) 'An aspect of industrial reorganisation', Economic Journal, vol. 55, pp. 179-91.
Bamberg, J.H. (1988) `The rationalisation of the British cotton industry in the inter-war years', Textile History, vol. 19, pp.83-102.
Bowden S. and Higgins, D.M. (1998) ‘Short-time working and price maintenance: collusive tendencies in the cotton spinning industry, 1919-1939’, Economic
History Review, vol. 51, pp.319-43.
Burnett-Hurst, A. (1932) 'Lancashire and the Indian market', Journal of the Royal
Statistical Society, vol.95, pp.395-440.
Clay, H. (1931) Report on the Position of the English Cotton Industry, London, Securities Management Trust Ltd.
Daniels, G. and Jewkes, J. (1928) `The post war depression in the Lancashire cotton industry', Journal of the Royal Statistical Society, vol. 91, pp.153-206.
Dietrich, E. (1928) ‘The plight of the Lancashire cotton industry’, American Economic
Review, vol.17, pp. 473-4.
Farnie, D.A. and Gurr, D.A (1998), ‘Design and construction of mills’, in Gurr, D.A. and Hunt, J. The Cotton Mills of Oldham, Oldham, Oldham Education and Leisure.
Filatotchev, I. and Toms, J.S. (2003), ‘Corporate Governance, Strategy and Survival in a Declining Industry: A Study of Lancashire Textile Companies’, Journal of
Management Studies, vol.40, pp.895-920.
Greaves, J.I. (2000), ‘"Visible hands" and the rationalisation of the British cotton industry, 1925-1932’, Textile History, vol.31, pp.102-22.
Hammersley, J.S. (1931) ‘Rationalisation: the cotton trade’, Lloyds Bank Limited,
Monthly Review, vol.12, pp.47-56.
D.M Higgins and J.S. Toms (2003) Financial Distress, Corporate Borrowing and Industrial Decline: The Lancashire Cotton Textile Industry, 1918-1938.
Accounting Business and Financial History, vol. 13, pp.207-232.
Keynes, J.M. (1981) The Return to Gold and Industrial Policy II, Collected works, Cambridge, Cambridge University Press, pp. 578-637.
Lazonick, W. (1986) 'The cotton industry', in B.Elbaum and W.Lazonick, The Decline of
the British Economy, Oxford, Oxford University Press, pp.18-50.
MacGregor, D.H. (1927). 'Rationalisation of industry', Economic Journal, vol. 148, pp. 521-550.
Marchionatti, R. (1995) ‘Keynes and the collapse of the British cotton industry in the 1920s: a microeconomic case against laissez-faire, Journal of Post Keynsian
Economics, vol.17, pp.427-445.
B.R. Mitchell and P. Deane, (1963) Abstract of British Historical Statistics, Cambridge, Cambridge University Press.
Political and Economic Planning. (1934) Report on the British Cotton Industry, London, Political and Economic Planning.
Porter, J.H. (1974) 'The commercial banks and the financial problems of the English cotton industry, 1919-1939', The International Review of Banking History, vol.9, pp.1-16.
Ryan, J. in D.H. MacGreogor, (1930) 'Problems of rationalisation', Economic Journal, vol. 159, pp. 357-64.
Saxonhouse G. and Wright, G. (1987) ‘Stubborn mules and vertical integration: the disappearing constraint’, Economic History Review, vol.40, pp.87-94.
Toms J.S. (2002), ‘The Rise of Modern Accounting and the Fall of the Public Company: the Lancashire Cotton Mills, 1870-1914’, Accounting Organizations and
Society, vol.27, pp.61-84.
Toms J.S. and I. Filatotchev (2004) Corporate Governance, Business Strategy and the Dynamics of Networks: A Theoretical Model and Application to the British Cotton Industry, 1830-1980, Organization Studies, vol.25, pp.629-651.
i
Calculated from Mitchell and Deane (1963) and Robson (1957).
ii
Burnett-Hurst, ‘Lancashire and the Indian Market’, p.398.
iii
For example E.H. Stockton, the Chairman of the Manchester Chamber of Commerce pointed out mills passing into the hands of any ‘syndicate who have no knowledge of the conditions of an intricate industry is certain to lead to disaster’. Oldham Chronicle, 25th November, 1919.
iv Beehive re-floated with a nominal share capital of 2 million two-shilling shares
(£200,000). The annual return for this company in 1938 indicates that 23% of this stock was owned by the following London based accounts: Midland Bank Nominee; Morrison Nominees; Barclays Bank Nominees; Branch Nominees; Control Nominees; Roycan Nominees, and one London based group not specified.
v
Another example was the Lancashire Cotton Syndicate Ltd, with a registered address in London, but organised at least in part by local cotton mill managers. Alfred Holt was the Managing Director of the Syndicate and mill manager of Bolton Union Spinning Company.
vi
vii
Other stockbrokers included Henry Hood and Charles Thwaites.
viiiAs far as we can tell,the only contemporary economist who advocated a comparable
scheme was Allen, who proposed that, in a scheme of rationalisation, the surviving firms should make a debenture issue and use the proceeds to acquire the capital of firms which were to close down. In these schemes, Allen proposed that the owners of the closed plants would receive a cash payment representing the pre-rationalisation value of their interest plus an additional sum equivalent to their capitalised share of the additional profit which the industry was expected to earn as a result of the scheme. Of course, as with the Hammersely scheme, Allen recognised that his proposal would only work with government intervention. (Allen, 1945,189).
ix
These stockbrokers were sometimes responsible for substantial short-term sales of stock. Thus, for example Hood and Tweedale between them sold 30.3% of Century stock between December 1919 and August 1920, while Herbert Bridge, sold 3.75% of Ace stock between May 1920 and October 1920.
x
For a biographical discussion of the activities of three generations of the Stott family, 1862-1937, see Farnie and Gurr, (1998), pp.15-18.
xi