Article
The Conceptual Framework of the Government
-Sponsored Rural Road Improvement Project
Evaluation and Selection
Nukul Suksuwan1,aand Surangkana Trangkanont2,b,*
1School of Engineering and Resources (SER), Walailak University, Thailand
2Department of Civil Engineering, Faculty of Engineering, Prince of Songkla University, Thailand E-mail: a[email protected], b[email protected](Corresponding author)
Abstract.To take advantage from locating in the Association of Southeast Asian Nations (ASEAN)mainland region, the Thai government has established a policy of being logistics and transportation hub.The policy has,therefore, challenged the Department of Rural Roads (DRR)and particularly the Bureau of Rural Roads (BRR)11, 12, and 14 undertaking responsibility for all rural roads in the south part of Thailand.The BRR strategic plan and implementation have been demanded to reform. This research aimed to create the conceptual framework of route project improvement execution plan for BRRs’ decision-making on project investment prioritization. The focus group interview method was applied to gather factors influencing transportation investment projects in order to develop the criteria of route project improvement prioritization.In addition, the score level of each criterion was also collected through this method.Then, to rank the important criteria, the questionnaire was developed to gain the data of pairwise comparison and the Analytic Hierarchy Process (AHP)method was applied to analyze the data.The results showed that the framework was suitable for the BRRs’long-term route project improvement execution plan while the instant application was appropriated for the BRRs’short-term plan.
Keywords:Conceptual framework, project evaluation, project selection.
ENGINEERING JOURNAL Volume 22 Issue 1 Received 2 April 2017
1. Introduction
Locating in the center of the Association of Southeast Asian Nations (ASEAN)mainland region coupled with the emergence of the Asian Economic Community (AEC) [1] makes Thais’advantages in terms of trading accessibility to the neighboring countries through transportation system serving as a backbone driving the national economy [2].The Thai government,therefore, aims to establish the policy of being a logistics and transportation hub of ASEAN in order to enhance the competitiveness through logistics cost reduction [4].This policy has challengedthe Department of Rural Roads (DRR) because the DRR has been a temporary organization establishing in2002 and tended to cease operation in 2007.At that time, the organizational objective was to improve national route networks for human quality of life with sustainability and sufficiency [4].The organizational life was, however, extended and then become permanent in 2012.Since then, the organization set upstrategic plansin order to achieve the organizational strategic goals of Stability, Prosperity, Sustainability, and High Performance [4, 5].
As a result, the Bureau of Rural Roads (BRR)11, 12 and 14, as the subsidiaries of the DRR, undertook responsibility for all rural roads in south part of Thailand, as shown in Fig. 1, have to reform their project appraisal processes according to the DRR’s strategic implementation plan, since planning decision involves project evaluation and selection from among a portfolio of alternatives [6].The project selection is an important issue for accomplishing the organizational strategies [7].Under organizations’physical and financial constraints, project portfolio selection, coupled with the related activity of managing selected projects throughout their life cycle demand efficient and effective evaluation criteria and implementation method [8]. Government transportation agencies have also faced with the problems of efficiently selecting a subset of transportation projects for implementation [9, 10, 11].The BRRs are no exception.
Fig.1. Maps of the routes undertaken by BRR 11, 12, and 14 [4].
first and secondclass roads –consisting of 25 routes with thedistance of 138.006 km -are quite good due to many and wide lanes with acceptable road surfaces of asphalt/concrete.However, the number of these road categoriesare few compared with the roads in the third and fourth classes which comprise of 511 roads with the distance of 6,442.557 km.The lane and corridor of roads categorized in the third and fourth classes are narrow and the road surface is poor.The road improvement and development in these categories are essential. In addition, the traffic load would dramatically increase due to the national strategic plans of being a logistics and transportation hub of ASEAN. The BRR’s strategic implementation plan of road extension and improvement is in a hurry needed to be reformed in order to serve the national plans and facilitate the existing communities.
Table 1. Road characteristics under the responsibility of the BRR 11, 12, and 14 [4].
Under a strategy-focused environment of government policy and socioeconomic conditions, there is a degree of interdependence among transportation investment projects [12]and among multi-criteria of project selection [13].The process of decision-making presents itself as a complex scenario involving multi-stages, including choice selection and weighting of alternatives [6, 7].Moreover, this selection process depends on multiple objectives which are often measured in incommensurable units [9].According to these difficulties of project selection in terms of evaluation criteria linked to the organizational strategic goals and decision-making process, there is a need for breaking down these complexities with a proper understanding of its content in order to enhance the BRRs’strategic planning through transportation investment project selection under DRR’s transportation improvement program.
Therefore, this research aims to explore and gain an in-depth understanding of factors influencing transportation investment projects and then develop the criteria and an evaluation method framework for BRRs’strategic planning achievement.The preliminary qualitative and quantitative factors are considered in order to develop an earlier conceptual framework and method for transportation investment project prioritization.The monetary terms of the economic feasibility study did not account for in this paper due to being the second part of the research which has been implemented and needed time.The application of benefit-cost ratio and Economic Internal Rate of Return demand the identification of variables with their definitions and values of measures.Then, the variable data are collected, analyzed and synthesized.The
Bureau of Rural
Roads BRR Payload (Tons) Lane Shoulder Each
Width (m)
Corridor Width
(m)
Number
of routes Distance (km) Type of road surface (km)
Number of Lanes Width (m)
Gravel Asphalt Concrete
BRR 11 (Surat Thani)
≥25
166 2,311.533 71.560 2,170.136 69.837
1stClass 4 ≥3.25 ≥1.50 ≥20.00 5 22.748 - 19.650 3.098
2ndClass 2 ≥3.50 ≥1.50 ≥20.00 4 13.971 - 13.971
-3rdClass 2 ≥3.00 ≥1.50 ≥15.00 42 583.591 - 580.082 3.500
4thClass 2 ≥3.00 Not specify ≥15.00 115 1,691.232 71.560 1,556.433 63.239
BRR 12 (Songkhla)
≥25
214 2,612.982 57.660 2,514.048 41.274
1stClass 4 ≥3.25 ≥1.50 ≥20.00 2 7.663 - 6.183 1.48
2ndClass 2 ≥3.50 ≥1.50 ≥20.00 8 60.384 - 40.762 19.622
3rdClass 2 ≥3.00 ≥1.50 ≥15.00 44 685.581 23.264 658.161 4.156
4thClass 2 ≥3.00 Not specify ≥15.00 160 1,858.904 34.396 1,808.942 16.016
BRR 14 (Krabi)
≥25
156 1,656.197 19.790 1,622.149 14.258
1stClass 4 ≥3.25 ≥1.50 ≥20.00 4 17.188 - 3.605 13.583
2ndClass 2 ≥3.50 ≥1.50 ≥20.00 2 16.052 - 16.052
-3rdClass 2 ≥3.00 ≥1.50 ≥15.00 44 571.368 - 571.358
-4thClass 2 ≥3.00 Not specify ≥15.00 106 1,051.881 19.790 1,031.124 0.675
Total
≥25
536 6,580.712 149.010 6,306.333 125.369
1stClass 4 ≥3.25 ≥1.50 ≥20.00 11 47.599 - 29.438 18.161
2ndClass 2 ≥3.50 ≥1.50 ≥20.00 14 90.407 - 70.785 19.622
3rdClass 2 ≥3.00 ≥1.50 ≥15.00 130 1,840.540 23.264 1,809.611 7.656
[image:3.595.84.515.228.541.2]predictive statistical model is later developed.Such variables-apart from investment costs- are composed of Vehicle Operating Cost (VOC), Value to Time (VOT)and Accident Cost (ACC)and so on.In addition, the economic life of roads in each category and discount rate are needed to theoretically specify.These variables have been rarely collected in previous due to DRR history.Simultaneously, BRRs were enforced to develop a new model of project appraisal as a DRR’s strategic plan.These situations challenge BRRs to find out the other solution of project selection providing of transparent, consistent, and reasonable judgmentin steads of BRRs’ traditional project improvement evaluation and selection relying only on traffic volume and brought about bias in project selection.This is because of the better road conditions, the higher traffic load appears. This study focuses therefore on multi-criteria project evaluation and selection.The output of this study can be, hopefully, applied as the basis of criteria of transportation investment project selection and decision-making process in BRRs.
2. Literature Review
2.1. The Roles and Functions of Rural Roads
In order to achieve the effectiveness and efficiency of transportation investment project selection, the group of criteria perceived by BRRs as an important issue identified.These criteria must be consistent with DRR’s strategies of Stability, Prosperity, Sustainability, and High-performance [5].The strategy of the Stability refers to the rural road network development aiming to improve the quality of life.The strategy of the Prosperity refers to rural road connectivity focusing on increase national resource mobility as a means of logistics competitiveness.The strategy of the Sustainability refers toruralroad maintenance and environment-friendly. The strategy of the High-performance refers to DRR management and regulation.According to these DRR’s strategies, the literature, based on traffic engineering and socioeconomic factors influencing transportation investment projects in relation to road function and characteristics, including the use of the route for serving communities in terms of socioeconomic aspects, was intensively and firstly reviewed.
Fig.2. Relationship of functionally classified highway systems in serving traffic mobility and land access [17, 18].
As the accessibility and mobility roles of collector roads, road administrations undertaking collector road maintenance/improvement/construction in several countries [10, 15, 17-21], considered a variety of factors involving in transportation engineering such as traffic volume, network characteristic in terms of quantity, scale, intermodal connections, and form.This included the functional purposes of road or road network (such as bypass or shortcut route), road and traffic conditions (such as the quality of road surface, road and shoulder width, a number of the cross-section, and traffic loading, stresses, and congestion).Moreover, the principle of road safety, and passengers’distribution between origin and destination has to be considered as well. Regarding environmental impacts, noise and air pollution were also accounted for evaluating the road investment.Consequently, transportation engineering was intensively studied for evaluating, selecting, and prioritizing road maintenance/improvement/construction project in practice as its principle enhances road collectors’accessibility and mobility.
“On the road to a better society”reflects the societal impact of the road [10] to the communities. Economic growth and poverty reduction derived from road investment [11, 21].Access to the routes, linking to necessary public facilities and religious places such as post office, hospital, police station, temple, and school [11, 15, 21]] leads to changes in the pattern of relationships between the environment and social actors [13].Accessibility, therefore, is one of the determinants to determine the actors’quality of life and social equality.Olsson [13], and Porter [15]pointed out that the accessibility, stemming from an improved transport infrastructure [10], have an effect on the local economy.This is because communities easily accessed to resources, capital, know-how, urban goods, and the labor market in different regions. Moreover, the improved transport infrastructure enabled efficient and effective production and production system, influenced land use and market area, enhanced productivity improvement, and stimulated investment and employment [13, 21].In some situations, if there are no allocative externalities presenting in the local economy, all the benefits of transport infrastructure investment are confined to travel or accessibility benefits [13].Therefore, accessibility was defined as the ease with which goods and the human being can reach to another place.
agricultural land used and the number of tourist destinations served to imply the level of accessibility.The number of industrial estates, commercial centers, and multimodal transportation ports indicated the level of mobility.
2.2. Transportation Project Appraisal Frameworks
An appraisal is normally seen as a tool to assist the process of planning transport system.It provides relevant information to decision-makers.However, it does not actually ‘make’ decision.Decisions supported by appraisal are composed of: prioritizing alternative projects within a program, selecting between the alternatives, determining whether or not selected projects representing good social value for money, and selecting the optimal time at which to undertake an investment [22]. Due to the fact that other decisions almost depend on the prioritization, how prioritization in transport project evaluation and selection is examined.
To prioritize the alternative projects, there are two well-known appraisal tools namely cost-benefit analysis (CBA)and Multi-criteria decision-making (MCDM) or Multicriteria analysis (MCA)which were popularly applied [22-24]. The MCDA is used to form a priority model nested by within the CBA [22]. The CBA is traditionally used to appraise the efficiency of a policy [24] and provides the information of the optimal single goal of profit maximization or cost minimization [25]. However, due to a diversified society needs,the CBA cannot take into account these needs by only considering the optimal single objective of the monetary terms.Under the complex social system,there are many different stakeholders’interests.A decision-making in transportation investment demands trade-off among numerous stakeholders’advantages and disadvantages [25]. The CBA is found to be unsuitable to incorporate and evaluate numerous criteria and attributes which are often conflicting objectives [24]. For example, the environmental and social impacts are intrinsically difficult to quantify.As a result, the application of MCDM in transportation project increases [25]. The evidence can be found in the transportation appraisal framework of several countries in Europe [22, 26]. This includes Japan and United States of America [23].
The MCDM is a set of decision-making methods based on that a number of alternatives are assessed regarding a number of criteria.These criteria can be quantitative or qualitative.The advantages of these MCDM methods are that they are able to incorporate criteria/factors which are difficult to express as a monetary value.In addition, the methods are able to facilitate the incorporation of the different stakeholders’ opinions into the decision-making process.Nonetheless, the disadvantages of MCDM methods are that the criteria subject to these methods are subjective.The measured impacts of these criteria are dependent on decision-maker perspective and quite ambiguous and may be double-counted [24, 26]. In particular,there may be a sense that the MCDM is used to make a decision rather than support the decision-maker [26]. The methods have been used to evaluate the transportation project investment such as analytical hierarchy process (AHP), Technique for Order of Preference by Similarity to Ideal Solution (TOPSIS), ELimination Et Choix Traduisant la REalité (ELECTRE), multi-attribute evaluation using imprecise weight estimate (IMP), Best Worst Method (BWM) [24] and Multiple objective mathematical programming (MOMP) [25].
Generally, in the initial stage of project development, the MCDMand descriptive frameworks may be especially helpful.Meanwhile, a full appraisal including CBA is used widely [22]. Due to the fact thattransport project appraisal methods among each country are differently applied since they have been developed with historically distinct theory [23], each country has its own transport appraisal framework.The following frameworks are discussed based on each studied country.
servants, who are responsible for road policies, and relevant Minister examining all cases together. The projects are approved by the national government charging overall policy of the transportation appraisal.
Considering the transport appraisal frameworks in other European countries, the frameworks of all countries contain both monetized and measured impacts regarding physical and qualitative terms [22, 26]. The direct transport impacts tend to have monetary values and the impacts of environment and socio-economicstend to be descriptive.The number of impacts included in the national assessment framework varies from a relatively small number of ten in case of Denmark to an exhaustive list of thirty-threein case of Greece [26]. The designation of weight among variables or impacts in each country is biased as they have a different set of valuation procedures for the different criteria variables.For example, the UK put more weight on the impacts on time-saving and accident reduction while France greatly considers the impacts on the local development of urban and intercity investments. Thus, depending on the variables and its relative significance, the results of evaluation in each country on similar projects may discrepant [23]. The details of the frameworks within which the impacts are taken together also vary across the CBA/MCA range.Within this range, it is found that it ranges from the CBA dominated through to largely MCDM or qualitative assessment.The framework and overall priority processing bind the different impact groups and impact treatments in the decision-making process.However, the appraisal is used for prioritizing the project, making a recommendation, and evaluating alternative option but not making a decision, since over and above the appraisal results, the additionally implicit series of political, cultural and other priorities must be weighed into the final decision on project approval [26].
In Japan, the transport project appraisal methods employ MCDM methodology supplemented by CBA and by qualitative and quantitative assessments.According to the system and manuals for transportation project appraisal,the project social benefits are evaluated from the viewpoint of efficiency and equity by using MCDM, meanwhile, the CBA is used to measure economic efficiency focusing on users’benefits.In addition, the manuals specify that the results of MCDM are used to rank project priority and the outcomes of CBA are applied for judging whether or not the project should be listed as a candidate for execution.To ensure project evaluation consistency, all of the impacts of the investments are presented in the Benefit Incident Table (BIT) before the MCDM and CBA implementations.These impacts consist of road use, environment, civic life, regional economy and public costs and revenues.They have effects on road users, households, industry, government, and the world.As a result, the information on BIT enhances the decision-maker to qualitatively identify the origin, transfer, and occurrence of the numerous impacts of the project, with no double-counting and leakage.The BIT also provides good material for judging social equity [23, 29]. The BIT and annual plans are prepared by local government for regional and rural roads.The national government contributes project funds and undertakes of overall policy [23].
In the United States of America (USA),CBA is mainly a preferred method, however, MCDM variations and other informal methods are often applied at the regional level. The federal government issues a prescriptive guidancein order to influence lower-level governments to accept the minimum practice of decision-making.A technical manual prescribes correct methods for conducting benefit-cost analysis.The technical process in benefit-cost guidance describes the basic framework of alternative, impacts, and evaluation.The alternative is relevant to base alternative establishment, project alternative capital investment, and supporting actions maximizing benefits of project investment.The impacts are categorized into costs, benefits, and transfers.Individuals may gain or lose but the aggregate of society is unaffected.The impacts are transferred into financial or monetary terms.The evaluation is considered in terms of equity and efficiency. However, it is found that good benefit-cost analysis does not arise from precise instructions.It derives from establishing the ground rules for debate.Other appraisal methods have receded or disappeared, excepting Measures of Effectiveness (MOEs).The outcomes of the MOEs indicate that how well an alternative works against the objectives comparing to the other alternatives.Due to the intergovernmental system, it is unclear who is responsible for project evaluation, states and localities proposing projects do most construction [23, 30].
3. Research Methodology—A Transportation Investment Project Evaluation and Selection Model Development
The research objectives are to explore and gain an in-depth understanding of factors influencing transportation investment projects in order to develop the criteria and an evaluation method framework for BRRs’ strategic planning achievement under rigorous schedules and scarcely recorded traffic demand information.The factors influencing transportation investment project evaluation in terms of transportation engineering and socioeconomic determinants which line up in the accessibility and mobility roles and project evaluation frameworks were intensively reviewed.Then, focus group interview as a data collection method was firstly conducted in order to gather and select the significant factors determining in the decision-making process.The advantages of this method are that the information was gained from a group of key informants possessing certain features.They provide qualitative data on a certain topic discussion. This provision, therefore, enhances deep comprehension on the topic interested [31]. By applying the focus group interview, the collected data were gained from purposive sampling selected through the representatives of practitioners (herein the officers, from BRR 11, 12, and 14, who were high specialist rank).Academicians as a consulting team acted as moderators and note takers in a discussion.The number of respondents in each session varied from 20 to 25 persons due to depending on their routine works and day-by-day problem-solving.Finally, the data were saturated after 4 dynamic interviews and discussions through video conference and BRR offices during June-July 2016.A few hours were spent in each session.The type and range of data collected through the interaction of the representatives provided the comprehensive and valuable meaning of determinants. The results of focus group interview can be seen inTable 2.
Table 2. The main factors and sub-factors for prioritization of the rural roads.
Main factor Sub-factor
(1) Transportation and traffic
engineering (1.1)Travel demand (Volume of traffic, ADT).
(1.2)A network of routes.The connection to the main highway. (Complete highway network with the rural road network for development in the future)
(1.3)Complete road network with the grid network pattern. (1.4)Road network with bypass.
(1.5)Road network with a shortcut. (2) Social and economic (2.1)The number of population.
(2.2)The number of landmarks along the route.
(2.3)Trade and investment factors - the number of trade, commercial, and business district.
(2.4)Tourist factor, tourist attraction places - the number of tourists
(2.5)Economic crop area –a number of crops.
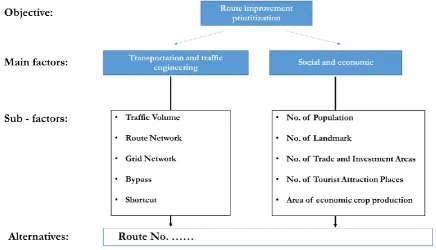
According to Table 2, the determinants of the transportation investment project evaluation and selection consisted of two major factor groups, namely transportation and traffic engineering, and social and economic factors.The transportation and traffic engineering factors comprised of 5 sub-factors, namely travel demand or traffic volume, a network connecting to the arterials, grid network pattern, bypass network, and shortcut network.The social and economic factors were composed of 5 sub-factors, namely the number of inhabitants being next to the route, the number of landmarks along the route, the number of trade, industrial, and investment centers, the number of tourist attraction place, and the number of agricultural products.These results were used as criteria for prioritization of the entire rural road investment projects undertaken by BRR 11, 12, and 14.
[image:8.595.70.530.371.605.2]questionnaire consistent with the hierarchy structure of route improvement project prioritization objective as shown in Fig.3. The structure was composed of 4 levels, namely Objective, Main factors, Sub-factors, and Alternatives.The first three levels gained from the focus group approach brought about the alternative selected.The questionnaire contents consisted of 4 parts.The first part was the research background and objectives.The second part was the operational definition of the major factors and sub-factors gatheredfrom the results of the focus group approach.The thirdpart was composed of the questions related to respondents’ profile and the factor pairwise comparison.The officers working for each BRR such as engineers, technicians, members ofthe top management team, and specialists more than 10 years were requested to rate the scale ranging from 9 (L)to 9 (R)based on their own knowledge and experience.9 (L)means “the factor presented on the left side more extremely important than the factor presented on the right side.”1 means “both factors were equally important.” 9 (R)means “the factor presented on the right side more extremely important than the factor presented on the left side.”The explanation and an example of a question in section three can be illustrated as shown in Fig. 4. The final part was the open-ended questions requesting for the participants’ recommendation and suggestion.
Fig.3. Thehierarchical structure of route improvement project prioritization.
[image:9.595.82.519.265.515.2]Fig.4. Some parts of the questionnaire third section.
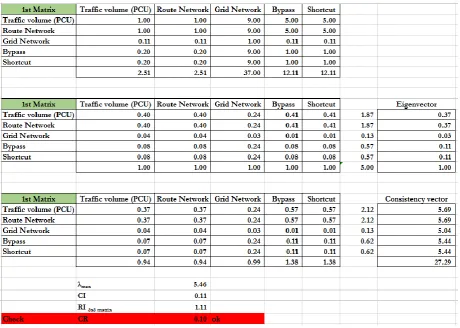
[image:10.595.86.512.90.370.2]Fig.5. The Consistency Index (CI)and Consistency Ratio (CR)calculations.
Table A the explanation of comparison scale
Comparison scale explanation
1 Both factors are equally important
3 The left/right factor is more slightly important than the other factor
5 The left/right factor is more moderately important than the other factor
7 The left/right factor is more considerably important than the other factor
9 The left/right factor is more extremely important than the other factor
(L)
9 8 7 6 5 4 3 2 1 2 3 4 5 6 7 8 9
(R)
Table B the explanation of comparison scale on the table
Table C Compare the relative importance (please Xon one number per row )
(L) is more extremely important than (R)
(R) is more extremely important than (L)
(R) is more considerably important than (L) (R) is more moderately
important than (L)
(R) is more slightly important than (L) (L) is more slightly
important than (R)
Both factors are equally important (L) is more considerably
important than (R)
(L) is more moderately important than (R)
Transportation and traffic engineering (L)
9 8 7 6 5 4 3 2 1 2 3 4 5 6 7 8 9
Socio-Economics (R)
Traffic of Volume (L)
9 8 7 6 5 4 3 2 1 2 3 4 5 6 7 8 9
[image:10.595.68.529.395.723.2]Once all pairwise comparisons at main factor and sub-factor level were done and proved to be consistent, the mean value of priority ranking (or weight)of each factor were lastly determined.The AHP process was implemented and completed during August –October 2016.The weights derived from the AHP method were used to compute Priority Index (PI)identifying route improvement projects. The formula of PI calculation was illustrated as follows:
(1)
Where PIi = Priority Index of route i
WEj = Weights of sub-factor j derived from AHP method under the main factor
of Transportation and traffic engineering (WE)
QEj = Score of sub-factor j under the main factor of Transportationand traffic
engineering (WE)according to route i attributes
WSk = Weights of sub-factor k derived from AHP method under the main factor
of Socio-Economics factor (WS)
QSk = Score of sub-factor k under the main factor of Social and Economicsfactor
(WS)according to route i attributes
WE = Weights of Transportation and traffic engineering main factor derived
from AHP method
WS = Weights of Social and economic main factor derived from AHPmethod n = (Herein)5, the number of sub-factor according to the Transportation and
traffic engineering and Social and economic main factors
The score criteria of each sub-factors were set up through BRR officers’focus group method.The question, such as ranking from one to five, how you scored it in each sub-factor as it was important, was asked in the session.Then let them discuss in each item.Finally, the consensus criteria categorized were summarized as shown in Table 3.These criteria focused on simply data collection, interpretation, and utilization.This included effectiveness as the information representing the real situation.The traffic volume demands on-site data collection.All data of sub-factors in social and economic main factors, excepting the number of population, were collected through ArcMap coupled with BRR database consisting of all attributes of every BRR route provided by BRR.This included the sub-factor data on the road network, grid network, by-pass, and shortcut routes in transportation and traffic engineering categories. The number of population was gained from local officers and Official Statistics Registration Systems.Then, each route PI was calculated and rearranged according to its value from maximum to minimum.
4. Results and Discussion
Table 3. The criteria of route scoring. Sc or e F ac to rs in flu en ci ng p ro je ct im pr ov em en t s el ec ti on 5 T ra ns po rt at io n an d tr af fic en gi nee ri ng So ci al a nd E co n om ic s T ra ff ic vo lu m e (p cu ) R oa d net w or k G ri d ne tw or k B yp as s Sh or tcu t No . o f po pu la tio n (p er so ns ) No . o f la nd m ar k (p la ces ) No . o f t ra de an d in ve st m en t a re as (p la ces ) No . o f t ou ri st at tr ac ti ve p la ce s (p la ce s) A rea s of ec on om ic cr op p ro du ct io n (a cr es ) > 3, 000 C on ne ct in g to Hi gh w ay ( x an d xx c la ss ) C on nec tin g to Hi gh w ay ( xx x an d xx xx cl as s) B ei ng G ri d net w or k B ei ng b yp as s ro ut e B ei ng s ho rt cu t ro ut e
4 3 2
2, 000 – 2, 999 1, 000 – 1, 999 500 – 999 1 < 500 C on nec tin g to ru ra l r oa ds C on ne ct in g to lo ca l r oa ds St an di n g al on e N ot b ei ng gr id n et w or k N ot b ei ng by pa ss r ou te N ot b ei ng sh or tc ut r ou te > 3, 000 2, 000 – 2, 999 1, 000 – 1, 999 500 – 999 < 500 > 9 7 - 8 5 - 6 3 - 4 1 - 2 0. 25 N ot hi ng >
5 4 3 2 1
N
ot
hi
ng
>
5 4 3 2 1
[image:12.595.122.475.111.734.2] [image:12.595.123.475.113.736.2]Table 4. Important weights of influencing factors on route improvement project.
Main factors Sub
-
factor BRR 11 BRR 12 BRR14Transportation and traffic engineering 0
.
457 0.
511 0.
549 Traffic volume 0.
171 0.
137 0.
115 Route network 0.
235 0.
203 0.
221 Grid network 0.
163 0.
178 0.
144Bypass 0
.
216 0.
236 0.
249Shortcut 0
.
216 0.
246 0.
271Social and economics 0
.
543 0.
489 0.
451No
.
of population 0.
196 0.
124 0.
167 No.
of landmark 0.
160 0.
123 0.
139 No.
of trade and investment areas 0.
189 0.
251 0.
150 No.
of tourist attractive places 0.
184 0.
273 0.
348 Area of economic crop production 0.
272 0.
229 0.
195The BRR 11 has rather concerned about Social and economic main category, therefore, the priority rankings were 0.457 and 0.543 respectively.This is because most routes undertaken by BRR 11 were used for transporting economic crops. In addition, several agricultural processing plants located over there. In addition, the crops needed distribution transportation system in order to reduce the cost of logistics and increase the competitiveness in crops markets.Consequently, the BRR 11 officers considered the route network, bypass, and shortcutsubcategories as the key critical factors as well.This led to high weights of them.
The results of BRR 11 important weights imply that the more area of economic crop production, the more requirements of bypass, shortcut, and route network were necessary.The strategic plans of BRR 11 could focus on the development of the mentioned road and network,especially, in the economic crop area in order to enhance the crop distribution, and reduce the transportation costs through travel time and operational vehicle cost.These could bring about regional economic growth and attract investors to set up their businesses in terms of the industrial estate, value-added crops processing, and logistics and distribution centers.These businesses could have an effect on the variables of trade and investment areas, population, and traffic volume. Therefore, the extension of economic crop production area is a major parameter demanding the BRR 11 to monitor and develop a forecasting model of the production area extension in order to prepare their implementation plans.These study outcomes and recommendations could be applied in the other areas of economic crop production since they provide analytical viewpoint and consequences.
With regard toBRR 12influencing factors, theimportant weights were mostly served for distribution. The BRR 12 officers have been paid their attention more to Transportation and traffic engineering main category than Social and economic main group as the weight has shown 0.511 and 0.489 respectively.All routes can be linked to the national border.Export and import activities and industrial parks located in this region. The route network, bypass, and shortcutsubcategories were focused on the essential ways to accomplish the logistics cost reduction as well.This brought about the high weight of Transportation and traffic engineering main factor.On the other hand, tourist attractive places, economic crop production, and trade and investment area were also considered due to the linkage of mobility and accessibility among the area of raw materials and goods production including international market.Moreover, business and travel in this area have been integrated since there have been various cultures, architectures, lifestyle, and beliefs. The diverse economic activities have been created and developed in order to provide business people and their families’, and tourists’preferences.Consequently, there were slightly different between the important weights of the Transportation and traffic engineering and Social and economic main group.
[image:13.595.105.488.116.299.2]could be able to apply this suggestion for regional transportation strategy due to the same characteristics of the border town.
Regarding BRR 14, under BRR 14 responsibilities, most routes link to tourist attractive places located in Phuket, Krabi, and Phangnga provinces.These provinces in the past were the center of mineral trade and investment.After that, they became the area of economic crop production of oil palm and rubber plants. Finally, due to a long coastal area next to Andaman sea, coupled with the fluctuated price of commodity product of rubber, palm oil, and mineral, the crystal blue sky and beaches, and thick forests are up to date promoted to be visited. This made the sub-factor important weight of tourist attractive places quite outstanding.The priority ranking was 0.348.In addition, in order to support tourists’lifestyle and activities, the route network, bypass, and shortcutsubcategories were considered and supported for continually place-to-place traveling among these provinces.This has a high effect on the weight of the Transportation and traffic engineering main factor.The significant weight was 0.549.
The results are consistent with the regional and province strategy.The BRR 14 could concentrate its strategic implementation on the shortcut and bypass routes to serve shuttle buses or other kinds of public cars.This includes route network development in order to link such routes together.The integration of routes enhances tourism industry bringing about inhabitants’ employment rate increment, and quality of life improvement. This implementation could be appliedfor BRR 11 as well because the attractive places of islands and beaches located in the area undertaken by BRR 11.Theattributes oflong coastal areas and beautiful islandsare the same as the regions where BRR 14 looks after for.
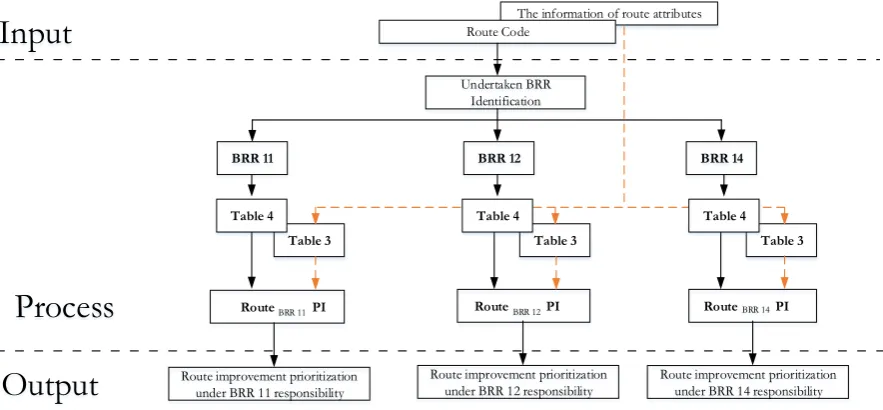
According to the entire weights gained from the AHP approach coupled with score criteria gained from the focus group method and PI calculations, the preliminary framework of route improvement project prioritization was proposed as demonstrated in Fig.6.The route code can be used to identify the BRR priority weights.The information about its attributes led to identify score value.Then, the PI of each route was calculated according to Eq. (1).After that, the PI was rearranged according to its value from maximum to minimum value in each BRR responsibility.Next, the framework was brought to develop a formula in order to enhance the productivity of each BRR in terms of decision-making on the route improvement project prioritization.Some results of the route improvement project prioritization using this proposed method can be seen as shown in Fig. 7.The attribute information on each route was transformed to score and then the route PI was calculated.
To ensure these frameworks and instant application can be the preliminary procedures to support BRR route improvement decision-making, they were brought to discuss with BRR senior and top management officers working for each BRR.All of them agreed that all main factors and sub-factors were never used to evaluate for route improvement project execution excepting traffic volume as the only way to assess the route improvement project prioritization with no bias.According to those factors, the evaluation based on the numeric value in entirely different aspects would help them to achieve efficiency and effectiveness of route improvement project prioritization.
In addition, they recognized that the traffic volume depends on those criteria and vice versa.They also realized that the BRR routes support the mobility and accessibility of people products and service.Thus, the routes should be developed or improved before it was needed.The traffic volume provided the sign of transportation needed.It, therefore, led to passive action.Furthermore, they also stated that route functions and attribute factors of network, bypass, and shortcut were interdependent with one another.These functions and attributes have an effect on traffic volume as well.The mobility was tied to the traffic volume.By considering only traffic volume, the communities, locating not too far from BRR routes, were somewhere, overlooked.The mobility was therefore accomplished but the accessibility was omitted.
This discussion implies that the factors oflandmarkand tourist factors and bypass and shortcut route variables in this framework could prone to double-counting in case of counting work dissemination as mentioned in the works of Bristow and Nellthorp [22], Grant-Muller et al. [26], Vicker [28].This is because some landmarks are created to attract tourist.The shortcut routes to attractions are the bypass routes of cities. In addition, the traffic volume could be unreliable because in some cases, a certain amount of traffic may divert from one route to another since the drivers enjoy the benefits of the other route [23]. In other words, the same volume could be separately distributed to other routes.
responsibilities for evaluating and selecting route improvement projects were implemented based on the instant application validity and reliability.
Most of BRR senior officers criticized that the reliability of the application was no doubt since all imperative factors, coupled with the priority ranking were considered and the score criteria were clearly specified.The results, therefore, were more effective and efficient than their traditional approach of route improvement evaluation and selection.They, however, concerned about the important weights may be occasionally changed according to organizational policy and strategic plan.This caused the validity of the instant application and the framework was questioned.For example, several government policies such as tourism policies, special economic zone and so on often challenged the existing DRR policy and plan.These policies had an effect on BRR route improvement project criteria.
Consequently, the framework and instant applications became out of date and invalidated.The instant application was used for the short-term plan.The framework should be extended for the long-term plan.The criteria and weight should be re-evaluated in every five years or when the government policies changed.The BRR officers suggested that the framework of route improvement prioritization framework should be expanded in terms of working scope and department’s responsibility.The department of policy and planning should take responsibility for the important weight re-evaluation because it is the first department understanding and transforming the government policies to the DRR organizational policies and strategies. The information of the route attributes was still collected every year by BRR officers.
Fig.6. The procedures of route improvement project prioritization.
Table 3
Undertaken BRR Identification
The information of route attributes Route Code
Input
BRR 11 BRR 12 BRR 14
Route PIBRR 11 BRR 14
Process
Output
Route improvement prioritizationunder BRR 11 responsibility
Route improvement prioritization under BRR 12 responsibility
[image:15.595.84.526.315.520.2]Route improvement prioritization under BRR 14 responsibility
Table 4
Table 3 Table 4
Table 3 Table 4
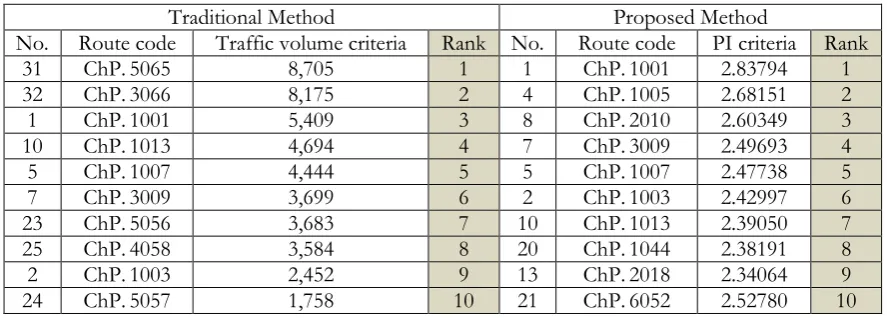
Table 5. The comparison of route improvement project prioritization between the BRR traditional and the proposed method
Traditional Method Proposed Method
No. Route code Traffic volume criteria Rank No. Route code PI criteria Rank
31 ChP.5065 8,705 1 1 ChP.1001 2.83794 1
32 ChP.3066 8,175 2 4 ChP.1005 2.68151 2
1 ChP.1001 5,409 3 8 ChP.2010 2.60349 3
10 ChP.1013 4,694 4 7 ChP.3009 2.49693 4
5 ChP.1007 4,444 5 5 ChP.1007 2.47738 5
7 ChP.3009 3,699 6 2 ChP.1003 2.42997 6
23 ChP.5056 3,683 7 10 ChP.1013 2.39050 7
25 ChP.4058 3,584 8 20 ChP.1044 2.38191 8
2 ChP.1003 2,452 9 13 ChP.2018 2.34064 9
24 ChP.5057 1,758 10 21 ChP.6052 2.52780 10
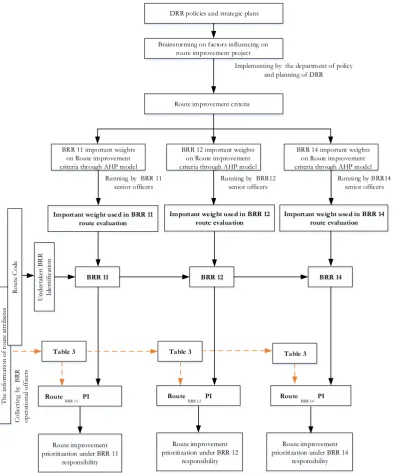
Finally, the conceptual framework of route improvement project prioritization for a long-term plan was developed as shown in Fig.8.The DRR policies and strategic plans were analyzed in order to identify factors influencing the route improvement project.By applying the brainstorming method, these influencing factors, which were high impacts, were determined as the route improvement criteria.After that, all these criteria were evaluated their important weight by using pairwise comparison implemented by BRR senior officers.The officers used AHP calculation model, provided by the consultant team, to quantify the priority ranking or important weight.Then, the route code and the information of the route attribute were conducted to indicate which BRR important weight and score values were used to calculate PI.After that, the entire route PI of each BRR was rearranged based on its value from maximum to minimum.Finally, the route improvement project prioritization in each BRR was gained.
[image:17.595.76.520.127.286.2]Fig.8. The preferred procedures of route improvement project prioritization.
Furthermore, the BRR’s variables focused on the roles and functions of rural roads due to lack of rigorous DRRtransport policy guideline.The DRR decentralized the project appraisal to the BRR since top management thinks different areas demand different variables.As a result, the DRR could also face the challenges of variable inconsistency due to project appraisal decentralization.There are 18 BRRs working with 8 consultant teams.Our team deals with3 BRRs similar to the other consultants.This could bring about variable inconsistency causing difficulty in project prioritization as also mentioned in the research of Nellthorp and Mackie [27].As a result, the content of the framework could be revised and developed by DRR rather than BRR.The DRR could make all alternatives compatible by integrating and providing variables and could appoint one team to make a decision on DRR alternative appraisal proposed by BRRs for the organizational budget allocation.
Running by BRR12 senior officers
Implementing by the department of policy and planning of DRR DRR policies and strategic plans
Brainstorming on factors influencing on route improvement project
Route improvement criteria
BRR 12 important weights on Route improvement criteria through AHP model BRR 11 important weights
on Route improvement criteria through AHP model
BRR 14 important weights on Route improvement criteria through AHP model Running by BRR 11
senior officers
[image:18.595.102.496.78.552.2]Running by BRR14 senior officers Table 3 U nd er ta ke n BR R Id en tif ic at io n Th e in fo rm at io n of r ou te a tt rib ut es R ou te C od e
BRR 11 BRR 12 BRR 14
Route PIBRR 11 BRR 14
Route improvement prioritization under BRR 11
responsibility
Route improvement prioritization under BRR 12
responsibility
Route improvement prioritization under BRR 14
responsibility
Table 3 Table 3
Route PIBRR 12 Route PI
C ol le ct in g by BR R op er at io na l o ff ic er s
Important weight used in BRR 11 route evaluation
Important weight used in BRR 12 route evaluation
5. Conclusion
The emergence of AEC brought about Thai government policies of the logistics and transportation hub of ASEAN.This policy challenges the Department of Rural Roads (DRR) taking care of all national rural roads in terms of route improvement project prioritization.The DRR, therefore, established the strategic plan of route improvement project evaluation and selection.The Bureau of Rural Roads (BRR)11, 12 and 14 as the sub-divisions of DRR undertaking responsibility of all rural roads in the south part of Thailand have to reform their route improvement project plan complying with the DRR’s strategy.
A strategy-focused environment of government policy coupled with certain socioeconomic conditions brought about the interdependence among transportation investment projects and among multi-criteria of project selection.The decision-making process was a multifaceted situation involving multi-stages including choice selection and weighting of alternatives.According to the complexity of decision-making on the project evaluation and selection, this research aims to investigate and gather an in-depth understanding of influencing factors on transportation investment projects.This included the decision-making framework development.
The related literature on road function, and the collector roles in terms of mobility, accessibility,and transport project evaluation frameworks were intensively reviewed.Then, the focus group interview was applied with BRR professional officers.After a few sessions of the interview, the criteria were identified and classified into two main factor groups, namely transportation and traffic engineering, and social and economic factors.Each of them consisted of 5 sub-factors.Next, these criteria were used to develop the questionnaire for pairwise comparison according to AHP method.Then, the results of the comparison were firstly computed for examining the data consistency verification.After that, the priority ranking of each determinant was gained.The PI calculation was considered.The score value used to calculate the PI was gained from the focus group method.
Consequently, the PI of each route was calculated and rearranged based on its value.The PI value was an indicator of the route improvement project priorities.The instant application and transport project appraisal framework were developed.The application was appropriate with the short-term plan and the framework was suitable for the long-term plan as it was flexible.Although the outcomes of this research omitted CBA due to needed more time to collect numerous data in order to calculate value of time, vehicle operational cost, and accident cost reduction including develop traffic demand forecast, this preliminary project appraisal setup project evaluation and selection based on the theoretical roles and functions of rural roads in the BRR organizations.The results improve BRRs’project appraisal previously relying only on passenger car unit.
References
[1] S. Trangkanont, T. Wichaiphruek, K. Yongkiadtikan, P. Wannasiriwong, and P. Uttaraphon, “Route causes of construction project disputes in Thailand,” IJCMCE, vol. 4, no.4, pp.8-12, Oct., 2016. [2] S. Phoualavanh and B. Limmeechokchai, “Scenario-based analysis of CO2 mitigation potential in the
transportation sector:comparison between Lao PDR and Thailand,” Engineering Journal, vol. 20, no.4, pp.111-119, Aug., 2016.
[3] B. Sullivan. (2014). Is Thailand ready to be ASEAN’s Logistics Hub? [Online]. Available: https://www.thailand-business-news.com/asean/48473-cross-border-trades-aec-development-thailand.html [Accessed: 30January 2017]
[4] Department of Rural Roads (DRR). (2015). Internal Unit. [Online]. Available: http://www.drr.go.th/internal_unit [Accessed Jan. 31, 2017]
[5] Department of Rural Roads (DRR).2013.Available:http://www.drr.go.th/strategy [Accessed Feb. 4, 2017].
[6] J. J. Jiang and G. Klein, “Project selection criteria by strategic orientation,” Information and Management,
vol.36, no.2, pp.63-75, Aug., 1999.
[7] S. Puthamont and C. Charoenngam, “Strategic project selection in public sector:Construction projects of the Ministry of Defence in Thailand,” Int J Proj Manage, vol. 25, no.2, pp.178-188,Feb., 2007. [8] N. P. Archer and F. Ghasemzadeh, “An integrated framework for project portfolio selection,” Int J Proj
Manage, vol.17, no.4, pp.207-216, Aug., 1999.
[9] E. Avineri, J. Prashker, and A. Ceder, “Transportation project selection process using fuzzy sets theory,”
[10] J. Ward, “Road maintenance review:International comparison,”WRA, UK, May, 2012. Available:
http://www.ciht.org.uk/en/document-summary/index.cfm/docid/BE52BA78-7D7D-47B3-8CAF5E07079C34DE [Accessed Feb. 8, 2017]
[11] D. V. D. Walle, “Choosing rural road investments to help reduce poverty,” World Development, vol. 30, no.4, pp.575-589, Apr., 2002.
[12] J.-Y. Teng and G.-W. Tzeng, “Transportation investment project selection using fuzzy multiobjective programing,” Fuzzy Sets and Systems, vol. 96, no.3, pp.259-280, Jun., 1998.
[13] J. Olsson, “Improving road accessibility and indirect development effects: evidence from rural Philippines,” J.Transp.Geogr, vol. 17, no.6, pp.476-483, Nov., 2009.
[14] Federal Highway Administration, “Highway Functional Classification Concepts, Criteria and Procedures,” U.S. Department of Transportation, U.S.A., 2013. Available: file:///E:/lecturer/Project%20selection/transportation%20project%20selection/transportation%20cl assification/US%20Department%20of%20Transportation%20Federal%20Highway%20Administratio n%202013%20Highway%20Functional%20%20Classification%20Concepts,%20Criteria%20and%20 Procedure.pdf [Accessed Feb. 6, 2017].
[15] G. Porter, “Living in a walking world:Rural mobility and social equity issue in sub-Saharan Africa,”
World Development, vol. 30, no.2, pp.285-300, Feb., 2002.
[16] W. Sangthammakijkul, “Determining rural roads importance degree,”M.S.thesis, Dept.Civil Eng, KU, Bangkok, Thailand, 2014. Available: file:///C:/Users/Engineer/Downloads/ Fulltext%231_218296%20(1).pdf [Accessed Feb. 4, 2017].
[17] Federal Highway Administration, “Chapter 3:Functional Classification,”in Flexibility in Highway design. U.S. Department of Transportation, U.S.A., 2012. Available: https://www.fhwa.dot.gov/ environment/publications/flexibility/ch03.cfm[Accessed Feb. 6, 2017].
[18] K. Praphananurak and V. Benjaoran, “Rural roads classification by using analytic hierarchy process,”
Naresuan University Engineering Journal, vol. 10, no.2, pp.17-28, Jul–Dec., 2015
[19] Road Bureau, “Road in Japan,”Ministry of Land, Infrastructure, Transport and Tourism, Japan,2012. Available:https://www.mlit.go.jp/road/road_e/pdf/ROAD2014web.pdf[Accessed Feb. 7, 2017]. [20] C. Ambrosini and J.-L. Routhier, “Objectives, methods and results of surveys carried out in the field of
urban freight transport:An international comparison,” Transport Reviews:A Transnational Transdisciplinary
Journal, vol. 24, no.1, pp.57-77,Feb., 2004.
[21] S. Fan and C. Chan-Kang, “Regional road development, rural and urban poverty:Evidence from China,” Transport Policy, vol. 15, no.5, pp.305-314, Sep., 2008.
[22] A. L. Bristow and J. Nelltehorp, “Transport project appraisal in the European Union,” Transport Policy,
vol.7, no.1, pp.51-60, Jan., 2000.
[23] Y. Hayashi and H. Morisugi, “International comparison of background concept and methodology of transportation project appraisal,” Transport Policy, vol. 7, no.1, pp.73-88, Jan., 2000.
[24] J. A. Annema, N. Mouter, and J. Razaei, “Cost-benefit analysis (CBA), or multi-criteria decision-making (MCDM)or both:Politicians’perspective in transport policy appraisal,” Transportation Research Procedia, vol.10, pp.788-797, 2015.
[25] J.-Y. Teng and G.-H. Tzeng, “A multiobjective programming approach for selecting non-independent transportation investment alternatives,” Transportation Research Part B:Methodological,vol.30, no.4, pp. 291-307, Aug., 2015.
[26] S. M. Grant-Muller, P. Mackie, J. Nellthorp, and A. Pearman, “Economic appraisal of European transport projects:the state-of-the-art revisited,” Transport Reviews, vol. 21, no.2, pp.237-261, 2001. [27] J. Nellthorp and P. J. Mackie, “The UK Road Review—A hedonic model of decision making,” Transport
Policy, vol. 7, no.2, pp.127-138, Apr., 2000.
[28] R.Vikerman, “Evaluation methodologies for transport projects in the United Kingdom,” Transport Policy,
vol.7, no.1, pp.7-16, Jan., 2000.
[29] H. Morisugi, “Evaluation methodologies for transport projects in Japan,” Transport Policy, vol. 7, no.1, pp.35-40, Jan., 2000.
[30] D. B. Lee Jr., “Method for evaluation of transportation projects in the USA,” Transport Policy, vol. 7, no. 1, pp.41-50, Jan., 2000.
[31] R. A. Krueger and M. A. Casey, “Overview of focus group,”in Focus Groups:A Practical Guide for Applied
Research, 5th ed. U.S.A., SAGE Publications, Inc.2015.
[32] O. S. Vaidya and S. Kumar, “Invited review:Analytic hierarchy process:An overview of applications,”
[33] W. Ho, “Decision support:Integrated analytic hierarchy process and its applications—A literature review,” EUR J OPER RES, vol. 186, no.1, pp.211-228, Apr., 2008.
[34] R. W. Saaty, “The analytic hierarchy process—What it is and how it is used,
![Table 1. Road characteristics under the responsibility of the BRR 11, 12, and 14 [4].](https://thumb-us.123doks.com/thumbv2/123dok_us/8107361.235447/3.595.84.515.228.541/table-road-characteristics-responsibility-brr.webp)