Preparation, structural characterisation and antibacterial
properties of Ga-doped sol-gel phosphate-based glass
D. M. Pickup S. P. Valappil R. M. Moss H. L. Twyman P. Guerry M. E.
Smith M. Wilson J. C. Knowles R. J. Newport
Abstract A sol-gel preparation of Ga-doped phosphate-based glass with potential application in antimicrobial devices has been developed. Samples of composition (CaO)0.30(Na2O)0.20-x(Ga2O3)x(P2O5)0.50 where x = 0 and 0.03 were prepared, and the
structure and properties of the gallium-doped sample compared with those of the sample containing no gallium. Analysis of the 31P MAS NMR data demonstrated that addition of gallium to the sol-gel reaction increases the connectivity of the phosphate network at the expense of hydroxyl groups. This premise is supported by the results of the elemental analysis which showed that the gallium-free sample contains significantly more hydrogen and by FTIR spectroscopy, which revealed a higher concentration of OH groups in that sample. Ga K-edge EXAFS and XANES data revealed that the gallium ions are coordinated by six oxygen atoms. In agreement with the X-ray absorption data, the high-energy XRD results also suggest that the Ga3+ ions are octahedrally coordinated with respect to oxygen. Antimicrobial studies demonstrated that the sample containing Ga3+ ions had significant activity against Staphylococcus aureus compared to the control.
D. M. Pickup () R. M. Moss H. L. Twyman R. J. Newport
e-mail: [email protected]
S. P. Valappil J. C. Knowles
Division of Biomaterials and Tissue Engineering, UCL Eastman Dental Institute, London WC1X 8LD, UK
P. Guerry M. E. Smith
Department of Physics, University of Warwick, Coventry CV4 7AL, UK
M. Wilson
Introduction
The emergence of multi-resistant nosocomial pathogens such as MRSA and Clostridium difficile and the lack of new antibacterial drugs and antibiotics in the
advanced stages of development underlie the need to find more effective antimicrobial agents.[1] A recent study has found that Ga3+ ions inhibit Pseudomonas aeruginosa growth and biofilm formation, and kill planktonic and biofilm bacteria in
vitro by decreasing bacterial Fe uptake and by interfering with Fe signalling by the
transcriptional regulator pvdS.[2] It was also shown that gallium is effective in two murine lung infection models. Other studies have demonstrated that gallium is effective against the organisms causing tuberculosis[3] and malaria[4] in human beings, and in the treatment of Rhodococcus equi caused pneumonia in foals.[5]
Recently, we have shown that phosphate-based glasses (PBGs) in the system CaO-Na2O-P2O5 system provide a means to deliver Ga3+ ions in a controlled way.[6]
time.[8] Testing of the antibacterial properties of the Ga-doped PBG glasses revealed a net bactericidal effect due to Ga3+ ions, with a Ga2O3 concentration as low as 1 mol
% sufficient to impart potent bactericidal properties. These results suggest that Ga-doped PBG is a potentially promising new therapeutic agent for pathogenic bacteria including MRSA and C. difficile.[6]
Here we have prepared Ga-doped PBG by a sol-gel route which, to the best of our knowledge, is the first report of such a preparation. The method is based upon that which we developed to prepare biocompatible, bioresorbable, sol-gel (CaO)0.3(Na2O)0.2(P2O5)0.5 glass[12] with the addition of gallium ethoxide as the Ga3+
precursor. The sol-gel method has some advantages over traditional melt-quenching approaches in biomedical applications; the most notable of which are the low temperature nature of the preparation which allows scope for the encapsulation of drugs into the biomaterial, and the potential to coat biomedical devices using sol-gel processing to improve their properties, e.g. a hydroxyapatite layer to improve bonding to bone.[13]
We also report the characterisation of the new Ga-doped PBG sol-gel. We have studied the structure using synchrotron X-ray techniques, infrared spectroscopy and solid-state NMR, and measured the antibacterial activity against Staphylococcus aureus. The results have been compared to those from a similar sample containing no
gallium.
Materials and methods
Sample Preparation
(OP(OH)2(OBun) and OP(OH)(OBun)2, Alfa Aesar, ~98%), sodium methoxide
solution (NaOMe, Aldrich, 30 wt% in methanol), calcium methoxyethoxide solution (Ca-methoxyethoxide, 17.5 wt% in methoxyethanol) and gallium ethoxide (Alfa Aesar). The Ca-methoxyethoxide solution was prepared by reacting the appropriate amount of calcium metal (Riedel-de Haën, 98%) with 2-methoxyethanol (Aldrich, 99.8%) under argon at 80 °C for 24 hr. The concentration of the resultant solution was confirmed gravimetrically by evaporating the solvent and heating to 1050 °C for 12 hr to convert the alkoxide to CaO.
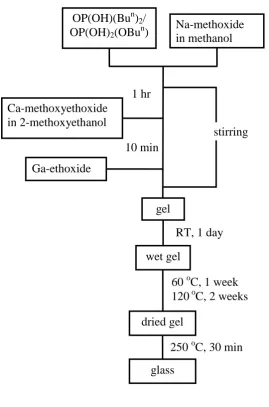
The sol-gel preparation of the gallium-doped sample is outlined by the flowchart in Figure 1. The n-butyl phosphate was first added dropwise using a syringe through a septum to a vessel containing the NaOMe solution: the solution was stirred magnetically throughout this addition. After one hour, the Ca-methoxyethoxide solution was added using the same method. The gallium ethoxide was also added via syringe after a further 10 min. of stirring. The sol was then allowed to gel, which typically took ~ 2 hrs, and left overnight. During this period the gel liquefied, allowing the resultant sol to be cast in a polypropylene container. This sol was aged at 60 ºC for one week, during which time the final gellation occurred, before drying at 120 ºC for two weeks. The dried gel was heated to 250 ºC to remove solvent, water and organic molecules. The sample containing no gallium was prepared by the same method except that no gallium ethoxide was added.[12] Samples of nominal composition (CaO)0.30(Na2O)0.20-x(Ga2O3)x(P2O5)0.50 where x = 0 and 0.03 were
prepared: for simplicity, we refer hereafter to these samples as 0Ga-PBG and 3Ga-PBG, respectively.
by a commercial company (Medac Ltd) and macroscopic densities were determined by helium pycnometry using a Quantachrome Multipycnometer. The elemental analysis revealed that the compositions of the oxide components of the 0Ga-PBG and 3Ga-PBG samples were (CaO)0.28(Na2O)0.21(P2O5)0.51 and
(CaO)0.26(Na2O)0.16(Ga2O3)0.03(P2O5)0.55, respectively. As expected with sol-gel
samples, some residual carbon and hydrogen was also detected: the sample with no gallium contained 3.6 wt% C and 1.1 wt% H, whereas the sample with 3 mol% Ga2O3
contained 1.7 wt% C and 0.7 wt% H.
Solid State NMR
31
P NMR experiments were carried out on a CMX Infinity spectrometer attached to an 8.45 T magnet giving a 31P Larmor frequency of 145.77 MHz. Samples were placed in the magnet using a Doty 4 mm MAS probe and spun at 12 kHz. The associated Spinsight software was used to run one-pulse experiments with a 2.7 μs pulse length corresponding to a π/6 tip angle, with a pre-acquisition delay of 10 μs. A 20 s repetition time was used and no saturation was observed. Typically, 150 scans were accumulated to obtain a good signal-to-noise ratio. Spectra were referenced to the resonance of the secondary reference ammonium dihydrogen phosphate (NH4H2PO4)
at 0.9 ppm (relative to 85% H3PO4 solution at 0 ppm).
Fourier transform infrared (FTIR) spectroscopy
Ga K-edge X-ray Absorption Spectroscopy (XAS)
Ga K-edge XAS measurements were made at room temperature on Station 16.5 at the SRS, Daresbury Laboratory, UK, with a ring energy of 2 GeV and a stored current of 150-250 mA. The spectra were recorded in transmission mode using a double crystal Si(220) monochromator (d = 1.92 Å) and ionisation chambers to detect the incident and transmitted beam intensities. Finely-ground samples were diluted in polyethylene (Aldrich, spectrophotometric grade) and pressed into pellets to give a satisfactory edge step and absorption. An encapsulated gallium foil and a third ionisation chamber were placed after the sample to allow an absorption spectrum of the foil to be collected simultaneously for the purpose of calibration of the energy scale. The energy scale was defined by assigning the point of maximum gradient on the absorption edge from the Ga foil to 10367 eV.
XANES (X-ray absorption near-edge structure) spectra were collected from 50 eV below to 175 eV above the Ga K-edge in order to allow accurate background subtraction. A fine energy step of 0.4 eV was used around the edge. The data processing comprised conversion of the data to absorption versus energy, calibration of the energy scale, removal of the pre-edge background by straight-line fitting and removal of the post-edge background by fitting with a polynomial. All the spectra were normalised to have an edge-step of 1. As well as the data from the gallium-doped PBG, spectra were also collected from a series of crystalline reference materials containing Ga3+ ions in well-defined coordination geometries: quartz -GaPO4, -Ga2O3, Ga2(SO4)3 and Ga(acac)3. The Ga(acac)3 (Aldrich, 99.99%) and
-GaPO4 and -Ga2O3 were synthesized. The quartz -GaPO4 was prepared by
precipitation from an aqueous mixture of GaCl3 (Aldrich, 99.99%) and H3PO4 by the
addition of NH4OH. The product was separated by filtration, washed and dried before
heating to 800 °C to remove ammonium and hydroxyl groups.[14] The -Ga2O3 was
prepared by calcination of Aldrich 99.99% Ga2O3 overnight at 1000 °C.[15] The
gallium foil used for the calibration of the energy scale was prepared by hot-pressing Aldrich 99.99% Ga metal between two sheets of filter paper and laminating the resultant construct in plastic.
EXAFS (extended X-ray absorption fine structure) data spectra were collected over the range k = 3 – 14 Å1 with a step of 0.04 Å1 and a counting time of 1 to 10 s per point varying as k3 ( 2 ( 0)
2 E E m
k e , where me = rest mass of the electron,
E = energy and E0 = energy of the absorption edge). The programs EXCALIB, EXSPLINE and EXCURV98[16] were used to extract the EXAFS signal and analyse the data. Least squares refinements of the structural parameters were carried out against the k3-weighted EXAFS signal to minimize the fit index, FI,
i
i i
k3( T E))2 (
FI (1)
where iT and iE are the theoretical and experimental EXAFS, respectively. The results of the refinements are reported in terms of the discrepancy index, Rdi.
% 100 d ) ( d )) ( ) ( ( R 3 E 3 E T di
k k k k k k k (2)Quartz -GaPO4 was run as a reference material to check the validity of our data
coordination numbers fixed at crystallographic values obtained from the literature.[17, 18]
High-energy XRD (HEXRD)
HEXRD data were collected on Station 9.1 at the Synchrotron Radiation Source (SRS), Daresbury Laboratory, UK. The finely powdered samples were enclosed inside a 0.5 mm thick circular metal annulus by kapton windows and mounted onto a flat-plate instrumental set-up. The wavelength was set at = 0.4858 Å and calibrated using the K-edge of a Ag foil; this value was low enough to provide data to a high value of momentum transfer (Qmax = 4πsinθ/λ ~ 23 Å1). The data were reduced using
a suite of programs written in-house: the initial stage of analysis of XRD data from an amorphous material involves the normalization, removal of background scattering, correction for absorption and Compton (inelastic) scattering, and subtraction of the self-scattering term.[19] The resultant scattered intensity, i(Q), can reveal structural information by Fourier transformation to obtain the pair-distribution function:
0 0
) ( ) sin( ) ( ) ( )
( )
(r T r Qi Q M Q Qr d Q
T (3)
where To(r) = 22ro (r is the atomic separation between atoms and o is the macroscopic number density) and M(Q) is a window function necessitated by the finite maximum experimentally attainable value of Q.
Structural information can be obtained from the diffraction data by modelling
the Q-space data and converting the results to r-space by Fourier transformation to
allow comparison with the experimentally determined pair-distribution function [20].
The structural parameters used to generate the Q-space simulation are varied to
optimize the fit to the experimental data. The Q-space simulation is generated using
2 exp sin ) ( 2 2 ij ij ij j ij ij ij Q QR QR c w N Q
p (4)
where p(Q)ij is the pair function in reciprocal space, Nij, Rijand ij are the coordination number, atomic separation and disorder parameter, respectively, of atom i with respect to j, cj is the concentration of atom j and wij is the weighting factor. The weighting factors are given by:
2 ) ( ) ( ) ( 2 Q f Q f Q f c c
wij i j i j if i j (5)
or, 2 2 2 ) ( ) ( Q f Q f c
w i i
ij if i = j (6)
where f(Q) represents the Q-dependant X-ray form factors.
The errors associated with the HEXRD data arise mainly from the fitting process due to the problem of overlapping correlation shells. They have been estimated from the tolerance that a particular parameter may have without significantly changing the overall quality-of-fit. Some additional systematic error may result from the data reduction process but these are expected to be small compared to those arising from the simulation of the experimental data.
Antibacterial growth assay
experiment was conducted in triplicate and the glasses not containing any gallium were used as negative controls. These plates were then incubated overnight in air at 37°C. The diameters of any zones that had formed around the glass samples were measured using callipers.
Results
Solid State NMR data
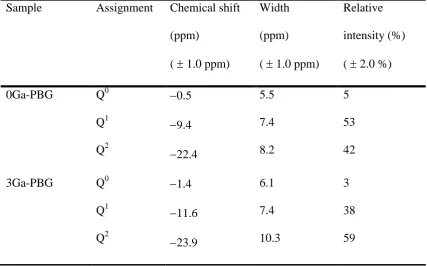
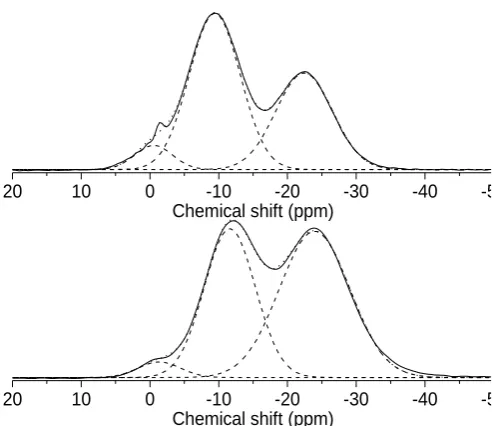
The 31P MAS NMR spectra from the two samples studied are shown in Figure 2. Also shown is the fits to the spectra obtained by Gaussian deconvolution; this deconvolution process included fitting the spinning side-bands which are not shown in the figure. The results of the Gaussian deconvolution are given in Table 1.
It can be seen from the results in Table 1 that three peaks can be resolved in both spectra. The resonances in 31P NMR spectra from PBGs are normally assigned to Qn phosphorus sites, where n represents the number of bridging oxygen atoms in the PO43- group which connect to other such phosphate tetrahedra.[21, 22] On the basis of
previous work in the literature,[12, 21, 22] the resonances observed here at around 1, 10 and 23 ppm are assigned to Q0
, Q1 and Q2 phosphorus environments, respectively. The NMR spectrum from the 0Ga-PBG sample features an additional very sharp peak at -1.5 ppm. A similar resonance was observed previously in the 31P NMR spectrum from sol-gel prepared CaO-Na2O-P2O5 glass and assigned to
unreacted monomeric phosphates (e.g. OP(OH)3-x(OBun)x).[12] The narrowness of
this resonance suggests that these monomeric phosphates are either more ordered in this sample or partially mobile. The relative intensity of this resonance was considered small enough for it to be excluded from the fitting process.
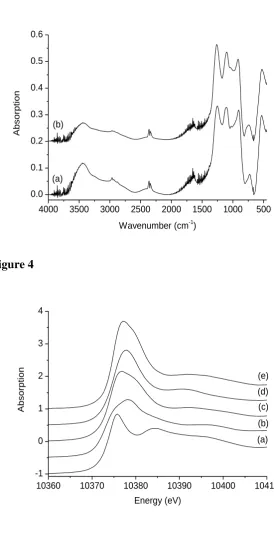
The FTIR spectra from the sol-gel glass samples are shown in Figure 3. The absorption bands have been assigned according to the literature.[23-26] The broad band in the region 3600-3000 cm1 is due to the fundamental vibrations of hydroxyl groups.[27] The band near 1250 cm−1 is assigned to the asymmetric stretching mode of the two non-bridging oxygen atoms bonded to phosphorus atoms in the Q2 tetrahedral sites, as(PO2)–. The absorption bands close to 1100 and 1000 cm−1 are
assigned to the asymmetric and symmetric stretching modes of chain-terminating Q1 groups (as(PO3)2– and s(PO3)2–), respectively. The absorption band near 900 cm−1 is
assigned to the asymmetric stretching modes of the P–O–P linkages, as(P–O–P), and
the partially split band centred around 750 cm−1 is assigned to the symmetric stretching modes of these linkages, s(P–O–P). The peak at 540 cm
−1
Ga K-edge X-ray Absorption Spectroscopy
The Ga K-edge XANES spectra from the reference materials and the 3Ga-PBG sol-gel glass are shown in Figure 4. Different gallium coordination sites can be distinguished using Ga K-edge XANES by comparison of the spectra with those from materials containing Ga3+ in well-defined structural sites.[15, 28, 29] Here we chose reference materials with a range of gallium coordination environments: quartz -GaPO4 contains tetrahedrally coordinated gallium,[14] -Ga2O3 an equal mixture of
tetrahedral and octahedral gallium,[28] and Ga(acac)3 and Ga2(SO4)3 octahedral
gallium.[28, 30] Figure 4 shows that for the octahedrally coordinated gallium a broad feature at ~10377 eV is observed, whilst for the tetrahedrally coordinated gallium a sharper peak is seen at slightly lower energy (10375.8 eV) together with a broader feature at higher energy (10384.5 eV). The spectrum from the mixed-site material,-Ga2O3, is consistent with a combination of the features observed for both the
single-site materials. These qualitative observations are in agreement with those of previous studies.[15, 28]
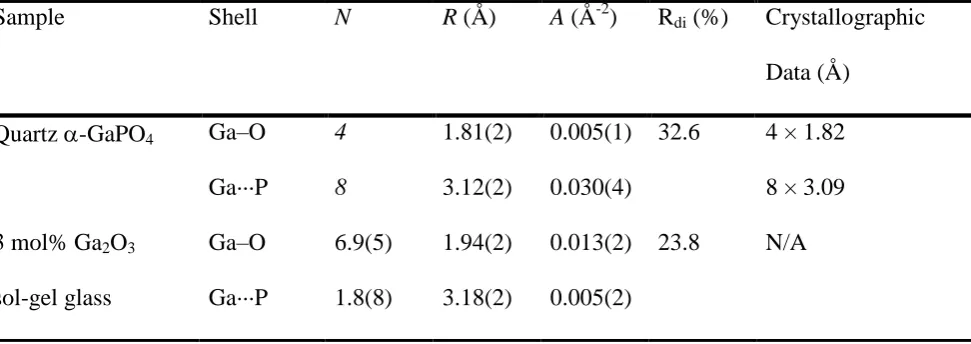
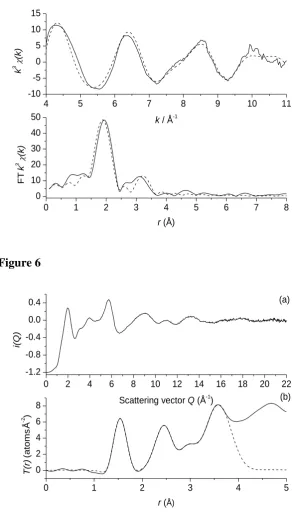
Figure 5 shows the EXAFS data from the 3Ga-PBG sol-gel glass; both k-space data and their Fourier transform are shown together with the calculated fits. The Fourier transform exhibits two peaks at ~2 and 3.2 Å which are assigned, by comparison with the atomic distances found in crystalline gallium phosphates,[17] to GaO and GaP distances, respectively. The structural parameters obtained from the fitting of the EXAFS data from both the Ga-doped sol-gel and the GaPO4 reference
HEXRD Data
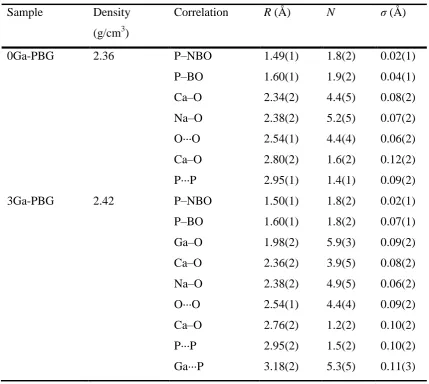
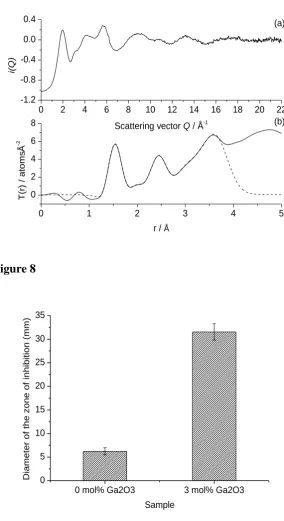
Figures 6 and 7 show the HEXRD data from the 0Ga-PBG and 3Ga-PBG sol-gel samples, respectively. Both the r-space and Q-space data are shown together with the fits to the pair-distribution functions obtained using the method described above. The structural parameters obtained from the fitting of the HEXRD data are given in Table 3. The peaks have been assigned according to the results of previous studies and by comparison with crystals.[17, 31, 32]
Antimicrobial Activity
The results of the disc diffusion study of the antimicrobial activity of the Ga-doped sample against Staphylococcus aureus are shown in Figure 8; the sample containing no gallium was used as the control. The zones of inhibition (i.e. zones of no visible bacterial growth surrounding the glasses) were found to be approximately 5 times larger in diameter for the gallium-containing glasses when tested against S. aureus compared to the same glass with no gallium.
Discussion
Structural Characterisation
It is generally accepted that phosphate-based glasses close to the metaphosphate composition, i.e. those having an atomic ratio of phosphorus to oxygen (O/P) of close to three, have structures comprised of rings and chains of PO43- tetrahedra.[33] The
present. The results in Table 1 show that the sol-gel glasses here have structures consisting mainly of Q1 and Q2 phosphate units with a small proportion (~5%) of Q0 groups. This type of Qn distribution is typical of sol-gel prepared PBGs and contrasts with that of analogous melt-quenched glasses.[12] A melt-quenched glass of nominal composition (CaO)0.20(Na2O)0.20(P2O5)0.50 has an O/P ratio of close to 3 and as such is
expected to have a structure consisting of entirely Q2 units:[21] in close agreement with this prediction, it has been shown experimentally that the structure of this glass consists of 95% Q2.[12] The gallium-free sol-gel sample studied here has the same nominal composition, but has a structure with only 40% Q2 units. The difference is that the sol-gel glasses contain a significant concentration of hydrogen: this hydrogen is present in the structure as OH groups which terminate the phosphate chains and reduce connectivity. In short, the structure of the melt-quenched glass need only have enough NBOs to coordinate and charge-balance the metal cations, whereas its sol-gel counterpart requires extra NBOs to charge balance the H+ ions.
When considering the structure of sol-gel prepared PBGs, it is useful to use
31
P NMR data to calculate the average P···P coordination number (NPP) and the average phosphate chain length (L). NPP can be calculated from the atomic fractions of Q1 (fQ1) and Q2 (fQ2) phosphorus sites in the structure using the equation:
2
1 2 Q
Q
PP f f
N (7)
Using this approach, we obtain values of NPP of 1.4 and 1.6 for the 0Ga-PBG and 3Ga-PBG samples, respectively. Similarly, if we assume, for the benefit of the calculation, that the structure consists of only linear phosphate chains with an absence of rings, an average phosphate chain length, L, can be calculated from NPP:
2 2
PP
N
Applying equation 8, we obtain average phosphate chain lengths of 3.1 and 4.5 for the 0Ga-PBG and 3Ga-PBG samples, respectively. Thus, there is significantly higher connectivity between the phosphate groups in structure of the gallium-containing sample compared to the gallium-free sample resulting in a 50% increase in the average phosphate chain length. This suggests that addition of a small amount of gallium ethoxide to the sol-gel reaction promotes the formation of P-O-P bridges. The reason for this maybe the high reactivity of gallium ethoxide towards hydrolysis which is due to the high positive charge density on the Ga3+ ion[34] and may drive the condensation of POH groups by consuming the water that is released. In terms of sol-gel chemistry, this is an important result: in contrast to silicate-based sol-gel reactions where Si-O-Si bonds readily form, it is difficult to get extensive P-O-P bonding in the analogous phosphate-based reactions.[35] As an example, vitreous silica can be easily prepared using sol-gel chemistry, whereas the preparation of vitreous P2O5 by the same methods has not been achieved. The increased phosphate
connectivity in the 3Ga-PBG sample is further evidenced by the elemental analysis. The 3Ga-PBG sample (0.7 wt%) contains significantly less hydrogen than the gallium-free sample (1.1 wt%), suggesting that the latter sample contains a higher concentration of OH groups.
PO vibrations of Q2
groups whereas the band at 1100 cm1 is the most intense band associated with the PO modes of Q1
end groups. The fact that the relative intensity of the 1250 cm1 band is significantly greater in the spectrum from the 3Ga-PBG sample compared to that from the 0Ga-PBG sample suggests, in agreement with the
31
P NMR results, that the abundance of Q2 species is greater in the structure of the former sample.
The XANES spectrum from the 3Ga-PBG sample exhibits one broad feature which is similar in shape and position to that observed in the spectra from the reference materials containing octahedral gallium, suggesting that the Ga3+ ions in the sol-gel glass adopt this coordination geometry. Of the two reference spectra from the materials containing octahedral gallium, the spectrum from the sol-gel sample is most similar to that from Ga2(SO4)3 with the predominant peak displaying slight
asymmetry and the absorption maximum occurring at slightly lower energy than observed for Ga(acac)3. Since Ga(acac)3 contains Ga3+ ions surrounded by a near
perfect octahedron of oxygen atoms[28] whereas the structure of Ga2(SO4)3 has two
gallium sites, both significantly distorted relative to the ideal octahedral geometry,[30] the observations here suggest some degree of distortion around the gallium site in the sol-gel PBG.
a strong correlation with coordination number. Typical GaO distances for tetrahedral gallium fall in the range 1.82-1.84 Å, those for five coordinate gallium in the range 1.88-1.92 Å and those for octahedral gallium 1.94-1.99 Å.[17] Comparing this result with the few studies of Ga-containing PBG in the literature we find that octahedral coordination with respect to oxygen is typical in glasses with a high P/Ga ratio.[37, 38] Hoppe et al.[37] studied Ga2O3-P2O5 melt-quenched glasses with HEXRD and
found only GaO6 octahedra at the metaphosphate composition (P/Ga = 3), whereas at
the pyrophosphate composition (P/Ga = 1.5), they found that the majority of Ga3+ ions occupied tetrahedral sites. Belkébir et al.[38] used a combination of Ga K-edge EXAFS and 71Ga NMR to study Na2O-Ga2O3-P2O5 melt-quenched glasses. Their
results suggest that, in the ternary system, once the P/Ga gets to 5 or above all the Ga3+ ions adopt octahedral coordination. Since the Ga-doped sol-gel glass at the centre of this study has a P/Ga = 18.3 the presence of GaO6 octahedra agrees entirely
with the trend suggested by the literature. In fact, our own 71Ga NMR study of CaO-Na2O-Ga2O3-P2O5 melt-quenched glasses with a P/Ga > 9 detected only octahedral
gallium.[6]
expected for a structure based on tetrahedral PO43 groups, with short and long PO
distances ascribed to bonds to non-bridging and bridging oxygen atoms, respectively.[33] The CaO and NaO distances of ~2.35 Å and coordination numbers of ~6 and ~5, respectively, agree with those measured previously by diffraction for these ions in PBGs.[12, 32] A longer Ca-O distance is also observed at ~2.8 Å suggesting a similar calcium environment to that found in silicate-based sol-gel bioactive glasses.[39] The O···O nearest-neighbour distance of 2.54 Å corresponds to the oxygen-oxygen distance in a PO43 tetrahedron (cf. calculated value of 2.52 Å
assuming a OPO bond angle of 109° and a PO distance of 1.55 Å). The distance of 2.95 Å measured for the P···P correlation represents the phosphorus-phosphorus distance between two PO43 tetrahedra connected by a bridging oxygen. The
parameters obtained for the 3Ga-PBG sample are broadly similar to those from the gallium-free sample suggesting that the two materials have similar structures. The main difference is the presence of correlations involving gallium in the data from the 3Ga-PBG sample: the results suggest that the gallium ions are surrounded by 5.9 oxygen atoms at a distance of 1.98 Å and 5.3 phosphorus atoms at a distance of 3.18 Å. These parameters suggest that the Ga3+ ions are coordinated by six phosphate groups in the structure and are in good agreement with those of obtained from the EXAFS data. The only notable discrepancy is that the EXAFS-derived GaP coordination number of ~2 is significantly lower than the HEXRD-derived value of ~5: this difference is likely to be due to the large errors associated with the EXAFS-derived value caused by multiple scattering which affects correlations beyond the first coordination shell and was not accounted for in the analysis.[40]
expected, the NPP value of 1.5 for the 3Ga-PBG sample is slightly higher than the value obtained of 1.4 for 0Ga-PBG sample, although this difference is not significant if one takes into account the errors associated with these two parameters.
In summary, the results presented here suggest that both materials studied have open structures bases upon short phosphate chains with OH groups acting as chain-terminating groups. In the gallium-containing sample, the Ga3+ ions adopt octahedral coordination. Moreover, the 31P NMR and FTIR data, and the results of the elemental analysis suggest that addition of gallium ethoxide to phosphate-based sol-gel reaction leads to a material with a more consolidated structure which has greater P-O-P bonding at the expense of OH groups.
Antibacterial Activity
This study was conducted to determine the antibacterial effectiveness of the gallium doped sol-gel glass. The 0Ga-PBG sample was used as a negative control. The results show a net bactericidal effect against Staphylococcus aureus due to the presence of Ga3+ ions. The small zone of inhibition seen observed for the 0Ga-PBG control may be due to either a change in pH as the material dissolves or by reduced water activity as ions leach out. These results demonstrate that, as in the case with Ga-doped melt-quenched PBGs,[6] Ga-doped sol-gel PBGs also have potential for use in antibacterial devices for biomedical applications.
Conclusions
with that of the Ga-free sample suggests that addition of gallium ethoxide to the sol-gel reaction has a significant effect on the structure of the final product, leading to a more consolidated structure with longer phosphate chains. This finding could be of general importance to the development of phosphate-based sol-gel chemistry.
Acknowledgements
References
[1] S. R. Norrby, C. E. Nord and R. Finch, Lancet Infect. Dis. 5 (2005) 115. [2] Y. Kaneko, M. Thoendel, O. Olakanmi, B. E. Britigan and P. K. Singh, J.
Clin. Invest. 117 (2007) 877.
[3] O. Olakanmi, B. E. Britigan and L. S. Schlesinger, Infect. Immun. 68 (2000) 5619.
[4] G. H. Yan, G. J. Wang and Y. C. Li, Acta Pharmacol. Sin. 12 (1991) 530. [5] J. R. Harrington, R. J. Martens, N. D. Cohen and L. R. Bernstein, J Vet
Pharmacol Ther 29 (2006) 121.
[6] S. P. Valappil, D. Ready, E. A. Abou Neel, D. M. Pickup, W. Chrzanowski, L. A. O'Dell, R. J. Newport, M. E. Smith, M. Wilson and J. C. Knowles, Adv. Funct. Mater. 18 (2008) 732.
[7] M. Bitar, V. Salih, V. Mudera, J. C. Knowles and M. P. Lewis, Biomaterials 25 (2004) 2283.
[8] J. C. Knowles, J. Mater. Chem. 13 (2003) 2395.
[9] A. M. Mulligan, M. Wilson and J. C. Knowles, J. Biomed. Mater. Res., Part A 67A (2003) 401.
[10] A. M. Mulligan, M. Wilson and J. C. Knowles, Biomaterials 24 (2003) 1797. [11] I. Ahmed, E. A. Abou Neel, S. V. Valappil, S. N. Nazhat, D. M. Pickup, D.
Carta, D. L. Carroll, R. J. Newport, M. E. Smith and J. C. Knowles, J. Mater. Sci. 42 (2007) 9827.
[12] D. M. Pickup, P. Guerry, R. M. Moss, J. C. Knowles, M. E. Smith and R. J. Newport, J. Mater. Chem. 17 (2007) 4777–4784.
[13] D. M. Liu, Q. Z. Yang and T. Troczynski, Biomaterials 23 (2002) 691. [14] S. N. Achary, O. D. Jayakumar, A. K. Tyagi and S. K. Kulshresththa, J. Solid
State Chem. 176 (2003) 37.
[15] R. I. Walton and D. O'Hare, J. Phys. Chem. Solids 62 (2001) 1469.
[16] J. J. Rehr, R. C. Albers and S. I. Zabinsky, Phys. Rev. Lett. 69 (1992) 3397. [17] D. A. Fletcher, R. F. McMeeking and D. Parkin, J. Chem. Inf. Comput. Sci. 36
(1996) 746.
[18] S. Gorfman, V. Tsirelson, A. Pucher, W. Morgenroth and U. Pietsch, Acta Crystallogr., Sect. A 62 (2006) 1.
[19] J. M. Cole, E. R. H. van Eck, G. Mountjoy, R. Anderson, T. Brennan, G. Bushnell-Wye, R. J. Newport and G. A. Saunders, J. Phys.: Condens. Matter 13 (2001) 4105.
[20] P. H. Gaskell, Materials Science and Technology (VCH, Weinheim, 1991). [21] R. J. Kirkpatrick and R. K. Brow, Solid State Nucl. Magn. Reson. 5 (1995) 9. [22] K. J. D. MacKenzie and M. E. Smith, Multinuclear solid-state NMR of
inorganic materials (Pergamon-Elsevier, Oxford, 2002).
[23] P. Y. Shih, J. Y. Ding and S. Y. Lee, Mater. Chem. Phys. 80 (2003) 391. [24] J. O. Byun, B. H. Kim, K. S. Hong, H. J. Jung, S. W. Lee and A. A. Izyneev,
J. Non-Cryst. Solids 190 (1995) 288.
[25] D. Ilieva, B. Jivov, G. Bogachev, C. Petkov, I. Penkov and Y. Dimitriev, J. Non-Cryst. Solids 283 (2001) 195.
[26] L. Baia, D. Muresan, M. Baia, J. Popp and S. Simon, Vib. Spectrosc. 43 (2007) 313.
[27] G. Orcel, J. Phalippou and L. L. Hench, J. Non-Cryst. Solids 88 (1986) 114. [28] K. Nishi, K. Shimizu, M. Takamatsu, H. Yoshida, A. Satsuma, T. Tanaka, S.
[29] P. Charton and P. Armand, J. Non-Cryst. Solids 333 (2004) 307. [30] M. Krause and R. Gruehn, Z. Kristallogr. 210 (1995) 427.
[31] U. Hoppe, G. Walter, R. Kranold and D. Stachel, J. Non-Cryst. Solids 263 (2000) 29.
[32] D. M. Pickup, I. Ahmed, P. Guerry, J. C. Knowles, M. E. Smith and R. J. Newport, J. Phys.: Condens. Matter 19 (2007) 415116.
[33] R. K. Brow, J. Non-Cryst. Solids 263 (2000) 1.
[34] C. J. Brinker and G. W. Scherer, Sol-gel science (Academic Press, London, 1990).
[35] J. Livage, P. Barboux, M. T. Vandenborre, C. Schmutz and F. Taulelle, J. Non-Cryst. Solids 147 (1992) 18.
[36] Y. C. Nho, O. H. Kwon and C. Jie, Radiat. Phys. Chem. 64 (2002) 67.
[37] U. Hoppe, D. Ilieva and J. Neuefeind, Z. Naturforsch., A: Phys. Sci. 57 (2002) 709.
[38] A. Belkebir, J. Rocha, A. P. Esculcas, P. Berthet, S. Poisson, B. Gilbert, Z. Gabelica, G. Llabres, F. Wijzen and A. Rulmont, Spectrochim. Acta, Part A 56 (2000) 423.
[39] L. J. Skipper, F. E. Sowrey, D. M. Pickup, K. O. Drake, M. E. Smith, P. Saravanapavan, L. L. Hench and R. J. Newport, J. Mater. Chem. 15 (2005) 2369.
Table 1 Results of the deconvolution of the 31P MAS NMR spectra from the 0GaPBG and 3Ga-PBG sol-gel glasses using Gaussian functions
Sample Assignment Chemical shift (ppm)
( 1.0 ppm)
Width (ppm) ( 1.0 ppm)
Relative intensity (%) ( 2.0 %)
0Ga-PBG Q0
Q1 Q2
0.5 9.4 22.4
5.5 7.4 8.2
5 53 42
3Ga-PBG Q0
Q1 Q2
1.4 11.6 23.9
6.1 7.4 10.3
Table 2 Ga K-edge EXAFS-derived structural parameters. Note that the numbers in italics were fixed during the refinement. The crystallographic parameters were taken from reference18
Sample Shell N R (Å) A (Å-2) Rdi (%) Crystallographic
Data (Å) Quartz -GaPO4 Ga–O
Ga···P
4
8
1.81(2) 3.12(2)
0.005(1) 0.030(4)
32.6 4 × 1.82 8 × 3.09 3 mol% Ga2O3
sol-gel glass
Ga–O Ga···P
6.9(5) 1.8(8)
1.94(2) 3.18(2)
0.013(2) 0.005(2)
[image:25.595.72.558.210.382.2]Table 3 Structural parameters obtained from the simulation of the HEXRD data.
Sample Density
(g/cm3)
Correlation R (Å) N σ (Å)
0Ga-PBG 2.36 P–NBO
P–BO Ca–O Na–O O···O Ca–O P···P 1.49(1) 1.60(1) 2.34(2) 2.38(2) 2.54(1) 2.80(2) 2.95(1) 1.8(2) 1.9(2) 4.4(5) 5.2(5) 4.4(4) 1.6(2) 1.4(1) 0.02(1) 0.04(1) 0.08(2) 0.07(2) 0.06(2) 0.12(2) 0.09(2)
3Ga-PBG 2.42 P–NBO
Figure Captions
Fig. 1 Flow diagram of the sol-gel preparation.
Fig. 2 31P MAS NMR spectra from 0Ga-PBG (top) and 3Ga-PBG sol-gel glasses (bottom) including their Gaussian deconvolution. The data are represented by a solid line, the overall fit by a dotted line and the individual Gaussian contributions by dashed lines.
Fig. 3 FTIR spectra from the sol-gel glasses: (a) 0Ga-PBG sample and (b) 3Ga-PBG sample.
Fig. 4 Ga K-edge XANES spectra: (a) quartz -GaPO4, (b) -Ga2O3, (c) Ga2(SO4)3,
(d) Ga(acac)3 and (e) 3Ga-PBG sol-gel glass.
Fig. 5 Ga K-edge EXAFS data from the 3Ga-PBG sol-gel glass: k3 weighted EXAFS (top) and Fourier transform (bottom). Experimental data, solid line, and theoretical fit, dotted line.
Fig. 6 X-ray diffraction data from the 0Ga-PBG sol-gel glass: (a) Q-space interference function, i(Q), and (b) pair-distribution function, T(r), (solid line) together with fit (dashed line).
Figure 1
Ca-methoxyethoxide in 2-methoxyethanol
OP(OH)(Bun)2/
OP(OH)2(OBun)
Na-methoxide in methanol
gel
wet gel
dried gel
glass
stirring
RT, 1 day
60 oC, 1 week 120 oC, 2 weeks
250 oC, 30 min 1 hr
[image:29.595.127.397.120.528.2]Figure 2
20 10 0 -10 -20 -30 -40 -50
Chemical shift (ppm)
20 10 0 -10 -20 -30 -40 -50
Figure 3
4000 3500 3000 2500 2000 1500 1000 500 0.0
0.1 0.2 0.3 0.4 0.5 0.6
A
bso
rpti
on
Wavenumber (cm-1) (a)
[image:31.595.113.369.153.349.2](b)
Figure 4
10360 10370 10380 10390 10400 10410 -1
0 1 2 3 4
(e) (d) (c) (b)
A
bsorpt
ion
Energy (eV)
Figure 5
0 1 2 3 4 5 6 7 8
0 10 20 30 40 50 FT k 3 (k)
r (Å)
4 5 6 7 8 9 10 11
-10 -5 0 5 10 15 k 3 (k)
k / Å-1
Figure 6
0 1 2 3 4 5
0 2 4 6 8 T(r ) ( at oms Å -2 )
r (Å)
0 2 4 6 8 10 12 14 16 18 20 22
-1.2 -0.8 -0.4 0.0 0.4 (b) i( Q )
Scattering vector Q (Å-1)
Figure 7
0 1 2 3 4 5
0 2 4 6 8 T(r ) / at oms Å -2
r / Å
0 2 4 6 8 10 12 14 16 18 20 22
-1.2 -0.8 -0.4 0.0 0.4 (a) i( Q )
Scattering vector Q / Å-1 (b)
Figure 8