Brusse Is. 16 November 1993
REPORT FROM THE COMMISSION
ON THE STATE OF
THE SHIPBUILDING INDUSTRY
IN THE COMMUNITY
Table of contents
I. Introduction
II. General economic background
Ill. Shipping trends IV. Fleet trends
v.
Situation in the shipbuilding industry VI. Policy frameworkI. INTRODUCTION
This report, issued pursuant to the Council Resolution of 19 September 1978, is aimed at providing an overview of the shipbuilding industry and market in 1992.
The report sets out the main features of the year, namely:
a slight increase in the tonne-mile volume of seaborne trade, with a small accompanying increase in world fleet tonnage;
continued steady growth in deliveries (in cgt) of new vessels(+ 5.1%) and an upv1ard trend in the number of vessels scrapped;
a further drop in demand for new vessels (-26.0%) with a significant reduction
(-12.7%) in order book volume;
a downward trend in ship prices (in US dollars) which particularly affected overall tonnage for shipping petroleum and petroleum products.
II. GENERAL ECONOMIC BACKGROUND
In 1992, world economic activity remained depressed with world GDP increasing by only
1.6 per cent in real terms. The economies of the United States and Canada started growing again after the recession of 1991, but experienced only modest rates of growth. The economy of Japan, on the other hand, started to slow down. The economies of these three important industrialised countries recorded in 1992 rates of growth of between
1
and 2 per cent in real terms. The EFTA countries, on the other hand, experienced again a small decline in GOP while in the countries of Central and Eastern Europe, the inevitable adjustment process led to a new substantial drop in production. The only dynamic area was once again in Asia with the group of the so called "Dynamic Asian Economies"1 recording an impressive 6.2%. The economy of the Community wassignificantly affected by the depressed state of the world economy, by the continued tight monetary policies and by political and institutional difficulties. The average rate of growth of the Community in 1992 was just 0.9 per cent, but this masks a progressive deceleration of economic activity and towards the end of the year the Community was experiencing a recession.
The world economy is expected to remain depressed in 1993. The recovery is expected to continue in North America, while the EFT A countries will continue to experience slightly negative rates of growth. The economy of Japan, which showed signs of weakness already in 1992, should expand by less than one per cent. On the whole, world GOP is expected to increase in 1993 by just over 1 %.
In 1992, the growth of world trade accelerated in line with output growth: imports of goods increased by 4.8 per cent in real terms with Community imports growing less than those of the rest of the world (3.0 per cent). In 1993, it is expected that world trade will slow down up somewhat and expand by about 4 percent in real terms ..
Investment increased by as much as 5.8 per cent in real terms in the USA in 1992, but declined by 0.8 per cent in Japan, thus responding fully to the improvement in prospects in the fanner country and to the deterioration in the latter. In 1993, investment is
expected to remain strong in the USA (+6.3 per cent), but to decline slightly in Japan. In the Community, investment will decline substantially in 1993, with investment in
equipment projected to contract by as much as four percentage points.
Ill. SHIPPING TRENDS
In terms of tonnage, world seaborne trade continued its upward trend in 1992 with a significantly higher growth rate(+ 2.3%) than was recorded between 1988 and 1991 (3.3%- 6.1%).
Crude oil shipments showed the same rate of growth as in 1991 (1.305 billion tonnes as against 1.247 billion in 1991}; iron ore shipments, on the other hand, showed a 6% drop in tonnage (from 358 million to 337 million}. 1992 also saw a slowdown in the growth of coal shipments (370 million compared with 369 million) and grain (205 million compared with 200 million in 1991 }.
\VORLD SEADORNE TRADE (1 073 ·1 992)
~---·
"
tf7J lt'1'J tn7 tr1'l ltlfl ltcl lft1 IM1 IMf IHt
1914 Jt'N Jt11 ~- Jill JM4 J"' .... JttO Jllfl It&
r::::l Oil ond Oill'n>doctl
r:m
QCI.,.. CarxoIn tonne-miles, the increase showed the same trend, with an overall volume of 18.280 billion compared with .17.873 billion in 1991.
WORLD SEABORNE TRADE (1m ·1092)
-~---.
u
-u
N Lam..._..._am_:_.._~__.___.__.,_.-_..,_'--::':.,.,:-::-""-:-:ttrT~-:-=-""-::.::"'::-' _._. -. , -. " " ..,. - .,.. . _ IJfl ...
....
:...
---As regards freight shipments, 1992 may be considered particular1y negative, especially for carriers of petroleum products. The latter experienced, in the
first
nine months of the year, a 65% drop in revenue for VLCCs and a drop of about 60% for Suezmax and Aframax tankers. Bulk carriers and car carriers especially, however, escaped this downward trend.IV. FLEET TRENDS
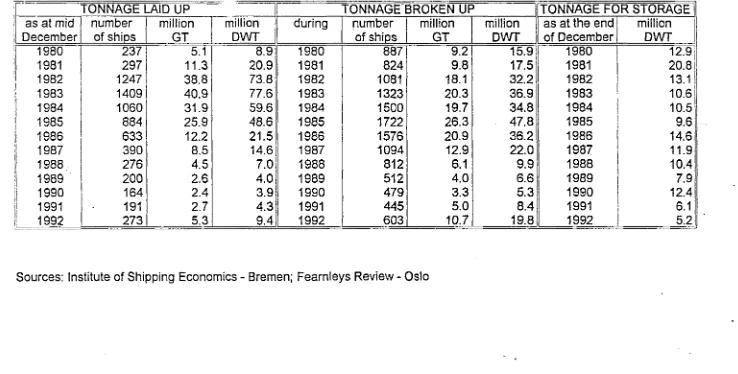
TONNAGE wtniDRAWN (1980 ·1092)
~r---,
10
.~~~~~~~~~~~~~~~~~~~=w~~
•• am uc:t ate
•* .,., ••
1t11 ua ,,., atto '"' am _ LA!D ll' ['!]!'at STCIWlll .o.. llllO[JlN UP~..-zwW:-.... ... y_.
... , ... ·-~ ... 011111
In 1991 36% of vessels were over twenty years old. The 1992 increase in tonnage scrapped nevertheless remained insufficient to produce a clear improvement in the existing imbalance between supply and demand in shipping.
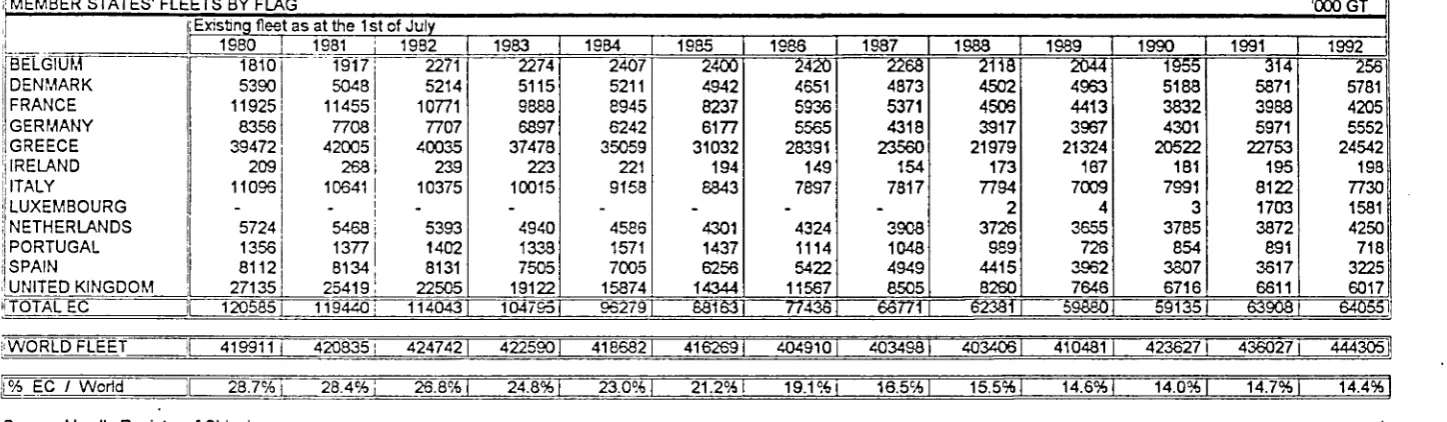
Overall Community fleet tonnage continued to expand in 1992, as it had done in 1991. This was chiefly due to the expansion of the Greek and Dutch fleets. The fleets of other Community countries, on the other hand, experienced some shrinkage. The total
Community fleet- with 63.9 million gt in 1991- reached the 64.0 million mark in 1992, i.e. 14.4% of the worfd fleet.
WORLD AND COMMUNITY FLEETS (11100·1H2)
500
'"'
400 ,_
~
soo
"'"11
fi ~
b
~ ~EC . . . elW..Wn.tl")...
0
200 20'6~
o(d u
..,
100 I N
0~--~~--~~~~--~~--~~--~~--~ I~
INO INI INl lOll 1014 IN1 1 - INl I - JN9 1990 1991 1991
V. SITUATION IN THE SHIPBUILDING INDUSTRY A. General overview
Production and new orders
World production went up by 5.1 o/o this year. This trend, generated above all in 1989 and 1990 by a revival in demand for new construction, seems to reflect for 1992 greater productivity from shipyards in the main shipbuilding countries and the relatively important position occupied by non-traditional ships (namely containers, passenger vessels and ferries).
---·----
··-r---~
PRODUCTION- SHIPS COMPLETED (1976 ·1992)
~ ~---,
ln4 IMO IMI lfll I"' IM4 1M3 ltN 11111 1 - I " ' ltto 1"1 lt91 _ EC - -J..- - -JC.craa _World
_ _ _ _ 4ooo . . .., . . .
As far as new orders are concerned, however, these declined by 26.0%, even bigger than the 16.7% drop of 1991. This downward trend was particularly apparent in the second and third quarters of 1992. The weakness of the sector was due to:
the slowdown in the growth of the world economy; the overcapacity of shipping in relation to demand;
t.:SV
or.m:ns
(1D7G -1~~
r---,
an. ,_ tnt am am "" am UN un '"' '"' '"' am am
__ BC - -Jopn __ J:aroa _ Wcdd
... ._ .... _ ... ..,-= ... --'-._ .... ,...
Order books
In the face of ever-shrinking demand, world order book volume dropped to 22.6 million cgt by the end of 1992, compared with 25.9 million at the end of 1991. Around 70% of book orders were due for delivery during 1993. The drop in fresh orders, together with the cautious position of the shipowners, does not appear to guarantee shipbuilders a satisfactory workload after 1994. As at 31 December 1992, orders on book for the Community represented 1.8 years of production at 1992 levels, for Japan and Korea 1.5 years and for the world 1.9 years.
OI'IDER DOOI< (1D7G -1992)
Shipbuilding prices
Available reference prices concern Japanese and Korean shipyards and are mainly given in dollars. The drop experienced in 1992 by the dollar in relation to the ecu and the yen exacerbated the difficulties, especially those faced by Japanese and European yards. While sales prices fell in tenns of constant dollars compared with 1991, they did not slump drastically as they did at the height of the crisis in the 1980s. All shipbuilders appear to have abstained from getting involved in such a dramatic spiral.
uo
;
;
~
~
:::
0
~~~~~=======-J
1 - ltet IMl ltll 1M4 IJI:I 1 - ltn lflt 1 - 1 - lt91 lffl - -~IJOIOODII'T - --~IWI)IJOIOOowx_ -l:IIOIOODWI'
- - - 5 IOODII'T - -DQ I~ 100 od - -l.PO 75 OOOod
-~-B. Situation in the Community, Japan and South Korea
The Community
Within the overall worldwide context, the Community situation was as follows: deliveries were up by 7.3%, from 2.6 million cgt in 1991 to 2.8 million in 1992;
new orders were down by 19.0%, a relatively small drop compared with the worldwide situation;
order book figures shrank by 17.8%.
Japan
While remaining the world's leading shipbuilder, Japan experienced a substantial decline in demand for new ships (- 26.3%) and in the workload for its yards (- 17.8%). Its marl<et shares, however, decreased only slightly. With the vast majority of contracts drawn LIP in yen, the increase in the yen's value in relation to the dollar would appear to be the main reason for this greater sensitivity in relation to other shipbuilding countries and
competitors. The Japanese yards feel that this "lack of competitiveness" is merely a short-lived phenomenon and have therefore continued with investments to increase their efficiency of production even further. Hence they will be prepared for the revival in demand expected for the second half of the 1990s.
South Koren
South t<orea nppears to have felt the effects of the stagnation in demand most keenly. The volume of orders was down 52.4% compared with 1991. Shipowners• reluctance to invest in new suportnnkers seems
to
have affected Korean yards in particulafl. As in the case of Japan, t<oroa appears ready and eager to get fully involved again in theinternational market by exploiting the indirect advantage of the revaluation of the yen in relation to the dollar (almost all contracts are drawn up in US dollars) by trying to expand its production to more specialized market segments such as containers or LNGs.
VI. POLICY FRAMEWORK
A. External policy
In April 1992, despite the Commission's constructive efforts, the formal negotiations within the OECD begun in 1989 were suspended. This resulted from the impossibility of
reaching agreement, particularly with Japan, South Korea and the USA, on certain points vlhich, though limited in number, were of vital political significance. These concerned an effective defence mechanism against injurious pricing, soft loans to shipowners and the obligation to build solely in domestic yards.
In December of the same year, a more open atmosphere became apparent in informal discussions between the various parties to the negotiations. This enabled the Chairman of the OECD Working Party to secure an agreement for resuming negotiations on the basis of a number of guidelines which he himself put forward.
2 According to the latest data, this reluctance seems to have disappeared in the first few
1. Maritime industries forum
In the wake of the communication entitled "New Challenges to Maritime lndustries113 the Commission set up the Maritime Industries Forum. Apart from the maritime industries concerned, trade unions, the research community and Member States and the Nord:c EFTA countries participated.
Making use of plenary sessions and working groups, the Forum's work dealt \\~th:
economic analysis of the maritime sector; maritime safety and the marine environment; maritime transport;
R&D.
The Industry presented a report to the Commission at the Forum's final plenary session at the end of October 1992 with recommendations for further action. These
recommendations, directed not only
at
the Commission but also at the industry and the Member States, propose that the Forum's activities be continued. Judging that most of the recommendations aimedto
boost the industry's competitiveness, the Commission included them in its communication entitled "The European maritime industries: further steps for strengthening their competitiveness"" \vhich it sent to the Council, European Par1iament and Economic and Social Committee.Following this communication, the Forum continued
its
work and, in line with the industry's wishes, organization of the Forum was placed in the hands of the maritime industries. The work focused on:short-sea shipping;
marine resources;
ship financing.
2. Research and development :
A first outline of the forthcoming 4th Framework Programme for Research and
Technological Development (1994-1998) which was presented in a working paper by the Commission in October 1992. In June 1993, the Commission approved the formal proposal to the Councils Between its many innovations is a program line covering research for a European transport policy in which the need for RTD activities to support an orientation towards multimodal transport is identified. This coincides with view points of the Maritime Industries Forum which, in its continued work, is also identifying a number of strategically important RTD areas, including : short-sea shipping, maritime resources, combined land sea transoort.
3 COM(91) 335 final, 20.9.1991 4 COM(92) 490 ·final, 18.11.1992
SPRINT and EURET as well as in the EUREKA programme. Current RTD projects include hydrodynamic design tools for Surface Effect Ships, structural problems associated with sloshing in tanks, laser welding, and implementation of advanced technology in ships'systems to optimise manpower and improve competitiveness.
3. Technical harmonization :
The proposal for a Directive on the constructional aspects of recreational craft which was approved by the Commission on 15 April 1992 was scheduled for its first reading at the Wort<ing Party on Economic Questions at the beginning of 1993.
The elimination of barriers to trade and the uniform application of requirements set by the international conventions of SO LAS and MAR POL, in order to achieve equal high levels of safety, are the main motives behind the long discussed isssue of harmonisation of the requirements to marine equipment. Further informal consultations with member states and industry have helped to darify oppropriate ways of obtaining a convergent
implementation of the international rules, and it is expected that proposals for one or more directives in this field will be adopted in the coming year.
4. Employment
In 1992 employment figures in the shipbuilding industry confirmed the declining trend. This was most keenly felt by the Portuguese and Spanish shipyards, but the German shipbuilding industry was not affected, showing a slight increase in the number of jobs.
EMPLOYr.1EfiT
m
THE CONSffiUCTION OF NEW VESSELS IN TiiE COMMUNITY~...,.a...·-.-....~
.._,,,""'",..._
...
_...,._,...,
Statistical
I
~
! OIL AND OIL PRODUCTS --H~ QIHE8 C,A.RGD - TOTAL -1
I 1 Seaborne trade Fleet *) Seaborne trade Fleet *) Seaborne trade Fleet *)
/ '000 million index
1
! million index '000 million index million index '000 million index million index
I
~~. tonne-miles '73=100 DWT 73=100 tonne-miles '73=100 DWT 73=100 tonne-miles '73=100 DWT 73=100
1
I 1973 10217 100 234.3 100 5187 100 205.6 100 15404 100 439.9 100
I
!
1974 10621 104 275.4 118 5766 111 218.5 106 16387 106 493.9 1121i
1975 9730 95 313.0 134 5666 109 230.7 112 15396 100 543.7 1241
: 1976 11149 109 343.9 147 5929 114 247.4 120 17078 111 591.3 134
I
1977 114031 112 356.1 152 6086 111 268.5 131 17489 114 624.6 142II 1978 10546 103 353.0 151 6407 124 279.7 136 16953 110 632.7 144
1979 10497 10311 350.9 150 7058 136 287.0 1401 17555 114 637.9 145
1980 9239 90 348.4 149 7415 143 292.9 142 16654 108 641.3 146
1981 8193 8Q 1 342.9 146 7523 145 305.8 149 15716 102 648.7 147
1982 6282 61 322.5 138 7269 140 320.5 156 13551 88 643.0 146
1983 5558 54 301.4 129 7078 136 331.0 161 12636 82 632.4 144
I
1984 5648 55 285.1 122 7836 151 341.1 166 13484 88 626.2 1421985 5157 5o 2s1.1 11ol 7929 153 348.2 169 13086 85 605.3 138
:\ 1986 . 5905 58 249.7 107 7951 153 345.5 168 13856 90 595.2 135
: . 1987 6016 59 245.8 1 OS 8284 160 342.2 166 14300 93 588.0 134!1
'.1 1988 6510 64 248.8 106 8789 169 345.0 168 15299 99 593.8 1351
ll
1989 7276 71 255.6 109 9109 176 353.6 172 16385 106 609.2 138I 1990 7821 77 262.2 112 9300 179 365.5 178 17121 111 627.7 1431
i 1991 8287 81 270.9 116 9586 185 372.0 181 17873 116 642.9 1461
:l
1992 Est. 8610 84 276.3 118 9670 186 375.5 183 18280 119 651.8 1481Est.: Estimates
(*) As at the end of the year Source: FEARNLEYS REVIEW
[image:14.833.27.753.93.379.2]TONNAGE LAID UP TONNAGE BROKEN UP TONNAGE FOR STORAGE
as at mid number million million during number million million as at the end million
December of ships GT DWT of ships GT DWT of December DWT
1980
237
5.1
8.9
1980
887
9.2
15.9
1980
12.9
I
1981
297
11.3
20.9
1981
824
9.8
17.5
1981
20.8
I
'
1982
1247
38.8
73.8
1982
1081
18.1
32.2
1982
I13.1
I
1983
14091
40.9
77.6
1983
1323
20.3
36.9
1983
!
i10.6
1984
1060
31.9
59.6
1984
1500
19.7
34.8
1984
I
10.5
1985
884
25.9
48.6
1985
1722
26.3
47.8
1985
!
I9.6
1986
633
12.2
21.5
1986
1576
20.9
36.2
1986
I
14.6
1987
390
8.5
14.6
1987
1094
12.9
22.0
1987
I
11.9
1988'
276
4.5
7.0
1988
812
6.1
9.9
1988
10.4
1989
200
2.6
4.0
1989
512
4.0
6.6
1989
I
7.9
"
1990
164
2.4
3.9
1990
479
3.3
5.3
1990
12.4
II
1991
191
2.7
4.3
1991
445
5.0
8.4
1991
I6.1
II
I1:
1992
273
5.3
9.4
1992
603
10.7
19.8
1992
I
5.2
Sources: Institute of Shipping Economics- Bremen; Fearnleys Review- Oslo
~
[image:15.834.15.753.105.479.2]~-- I 1980 i 1981 · 1982 1983 I 1984 1985 1986 1987 1988 1989 1990 1991 1992 'BElGIUM
I
1810
I
- . 1917: 2271 2274 2407 2400 2420 2268 2118 2044 1955 314 256DENMARK 5390 50481 5214 5115 5211 4942 4651 4873 4502 4963 5188 5871 5781
FRANCE 119251 114551 10771 9888 8945 8237 5936 5371 4506 4413 3832 3988 4205
GERMANY
I
83561 7708! 7707 6897 6242 6177 5565 4318 3917 3967 4301 5971 5552GREECE I 39472,
42005
i
40035 37478 35059 31032 28391 23560 21979 21324 20522 22753 24542IRELAND
i
2091 268i 239 223 221 194 149 154 173 167 181 195 198ITALY
I
~10961
10641 ! 10375 10015 9158 8843 7897 7817 7794 7009 7991 8122 7730LUXEMBOURG
I
-
I-
-
-
-
-
-
2 4 3 1703 158157241
I
NETHERLANDS
II 5468! 5393 4940 4586 4301 4324 3908 3726 3655 3785 3872 4250
PORTUGAL
II
13561 13771 1402 1338 1571 1437 1114 1048 989 726 854 891 718
1SPAIN 81121 81341 8131 7505 7005 6256 5422 4949 4415 3962 3807 3617 3225
I UNITED KINGDOM 271351 25419: 22505 19122 15874 14344 11567 8505 8260 7646 6716 6611 6017
liTOTAL EC IL_j_2Q~85L_ 119440! _ 1140431 ... 1047951__ 96279L __ 881631 __ 774361_ __ 66771! ____ 623811 598801 591351 63908 _l___ 640§§_
i•WORLDFLE-ET II 419911! 420835: 4247421 4225901 4186821 4162691 4049101-
4o34sar
-4o34061 4104811 4236271 4360271 444305~lli
EC I World L 28.7%T --28.4%-; -26-:86~24.s%r--23-:-d%T-21.2°hl 19.1%1 16.5%1 15.5%1::_- 14:6%l_u_14~o%Tu-T4.7%T n-f4.4%]Source: Lloyd's Register of Shipping
[image:16.833.30.754.80.291.2]IKER 130000DWl 45.0
IKER 250 000 DW1' 63.0
IKER 400 000 DW1. 85.0
IKER (Double Hull) 40 000 DWT
I
IKER (Double Hull) 95 000 DWT IKER (Double Hull) 130 OOODWT; IKER (Coub!e Hull) 280 000 DWl) 96000DWT 47.0
.KCARRIER 27000 DWT 20.0 .KCARRIER 38000 DWT
.KCARRIER 60000 DWT 26.5 .KCARRIER 120000 DWl, 44.0
RO 5000 DWT' 16.0
; CARRIER 125000m31 150.0 ; CARRIER 3 000 m3. 12.5 ; CARRIER .
12000
m3~~
28.0 ; CARRIER 24000m31 34.5 ; CARRIER 75000 m3i 75.0ce: FEARNLEYS REVIEW
s: - Prices in miTiion US $at the end or the year -Japanese and Korean yards are used as basis
51.0 32.5 31.5 29.0
72.5 50.5 48.5 44.0
90.0 61.0 57.0 51.0
44.0 30.0 26.0 26.0
19.0 13.0 12.0 11.0
14.3 13.7 13.5
27.5 16.0 17.0 15.5
42.0 26.0 25.0 24.0
20.0 15.0 12.0 10.0
175.0 150.0 150.0 130.0
12.0 10.0 9.0 6.5
30.0 27.0 27.0 21.0
37.0 33.0 31.0 27.0
75.0 53.0 50.0 45.0
25.0 26.5 34.0 46.0 54.0 55.0 55.5 55.5
37.0 42.5 54.0 73.0 82.0 86.0 90.0 90.0
44.0 50.5 60.0 88.0 101.0 120.0 125.0 125.0
36.0 37.0 33.0 51.0 52.0 47.0 68.0 70.0 62.0 110.0 115.0 100.0
22.5 25.5 32.0 44.0 55.0 62.0 64.5 64.5
10.0 11.5 14.0 20.0 22.5 21.5 22.0 22.0
11.3 12.7 16.2 22.3 25.0 24.6 25.3 23.0
14.0 15.0 20.5 27.0 30.0 31.5 32.0 32.0
20.5 23.0 30.0 39.0 45.0 46.0 50.0 50.0
9.0 10.0 13.0 16.0 19.0 21.0 22.0 22.0
130.0 120.0 145.0 175.0 220.0 260.0 290.0 290.0
8.5 8.5 9.0 13.0 16.0 16.0 16.0 16.0
21.0 21.0 25.0 30.0 37.0 43.0 45.0 45.0
26.0 26.0 27.0 39.0 46.0 52.0 55.0 55.0
42.5 47.5 55.0 61.0 71.0 80.0 85.0 85.0
~
J!Ec BELGIUM 139.8 129.6 95.5 83.0 173.2 102.3 124.4 45.0 25.9 48.8 35.5 71.7 21.8 97.6!
I
I DENMARK 560.6 382.4 343.8 329.2 338.5 355.4 444.0 350.7 194.4 277.2 287.0 305.5 350.9 414.5j
FRANCE 672.4 267.8 443.3 353.3 356.8 357.2 164.1 145.0 207.9 63.2 198.8 114.0 171.1 182.4•
I
GERMANY (1) 1468.0 672.8 1270.3 1181.5 1267.8 1164.7 1143.2 1067.0 764.7 885.0 846.5 1001.6 810.1 958.3'I
!I
GREECE IRELAND N/A 20.3 12.8 3.0 17.0 5.2 61.8 0.0 35.7 19.2 39.8 0.0 43.8 0.0 24.7 0.0 0.0 8.6 12.3 0.0 12.5 0.0 45.5 0.0 0.0 6.3 0.0: 0.01
1 ITALY. 353.9 345.5 359.2 156.2 217.0 182.3 123.8 60.9 224.8 119.9 284.5 327.6 423.9 289.2
i; NETHERLANDS 940.0 249.5 341.6 390.0 415.8 259.3 310.2 262.8 148.2 153.1 171.9 263.5 357.0 270.9
'I' PORTUGAL 53.0 35.3 6.4 31.2 124.7 18.5 40.3 61.0 26.3 23.0 48.3 64.6 38.5 64.4
I SPAIN 734.0 441.4 556.8 587.4 488.7 345.9 400.3 229.8 328.4 328.4 306.0 364.8 301.2 428.3
,. UNITED KINGDOM 985.1 458.6 243.2 394.0 319.3 305.3 164.4 141.5 162.3 113.2 157.3 144.6 170.5 139.5
~~TOTAL
EC 5927.1 2998.7 3882.3 3567.6 . 3756.7 3130.7 J. 2958.5 .238S.it.' h2087.5:~·
:>2020i1: ·r. 2348.3 ·'~~27'03.<t
j: -(2651.3 · · 28:45.1I 1
1
1011-iER FINLAND N/A 371.9 407.5 440.6 503.3 419.1 282.9 260.4 145.3 262.7 321.2 379.0 211.6 210.2!
IIAWES NORWAY N/A 323.7 342.1 447.8 278.3 175.9 222.1 162.8 181.3 155.2 79.4 157.9 248.6 311.4;
, SWEDEN N/A . 334.5 421.0 253.2 293.8 179.8 127.4 115.5 123.0 72.1 34.4 45.1 46.3 32.4.
~~TOTAL
AWES 8285.8 4028.8 · 4852.9 4700.2 · 4832.13905~:·,:!.
3590.9t ,?292Z:1:;{:.;,~Mt~fJ;2510l't·
J:.,. 2781.3.-~;:32SSAJ>!3157.$. ~.1!
~~JAPAN
8348.8 5207.2 5580.9 5811.1 . 4908.2 6951.1 ··• 1 6498.4 r · sa!5.4·l·
3795.3': ·
~.21t5i7·.
j· 3S64.1 · . 4-(SaO i ·~4417.4
· · 4379.3iI
f CHINA N/A N/A 27.9 104.5 170.4 297.8 172.4 214.6 207.3 253.1 230.0 303.5 255.4 282.1 !I/
POLAND N/A 497.7 346.4 369.5 277.1 382.4 357.5 340.0 300.0 344.0 237.9 176.6 223.0 305.8!
I
ROMANIA N/A N/A N/A N/A N/A N/A N/A N/A N/A N/A N/A N/A 128.4 148.6;
BULGARIA N/A N/A N/A N/A N/A N/A N/A N/A N/A N/A N/A N/A 71.0 81.6:,
I
USSR N/A 424.8 599.9 504.2 475.3 689.5 274.2 170.4 44.3 56.0 226.7 481.9 365.0 i.
l RUSSIA 21.9!
I
UKRAINE 118.6!'.,YUGOSLAVIA N/A 170.6 224.8 220.5 217.0 237.2 281.4 188.4 3.0 230.5 327.7 293.4 239.7 20.7:
. CROATIA 238.1 !
: '
5094.2 1860.4 1696.0 1988.5 1686.7 1519.7 1360.5 1241.8 1164.5 747.3 1024.2 1095.3 940.9 1149.6i
~~TOTAL
WORLDII REST OF WORLD
22078.2 12635.2 13841.0 14587.8 13552.3 149Q!M;:·,: 1416S.e ... -:-12139.,;':'~' 9245,o;.: • 859S.!l,·!;.d~s81;1.;. , :11656.3. ~· :.11526,1·· 12118.4! '
Source: 'WORLD SHIPBUILDING DATABANK" based on data supplied by LLOYD'S MARITIME INFORMATION SERVICES
(1) From 1980 on data includes production from Ex-GDR yards
~
[image:18.833.46.757.74.457.2]r~c
1976 1980 1981 1982 1983BELGIUM 0.6% 1.0% 0.7•,(, 0.6% 1.3%
DENMARK 2.5% 3.0% 2.5% 2.3% 2.5%
FRANCE 3.0% 2.1°h 3.2% 2.4% 2.6"h
GERMANY (1) 6.6",{, 5.3% 9.2% 8.1% 9.4%
GREECE N/A 0.1% 0.0% 0.4% 0.3°.4
IRELAND 0.1°,{, 0.0°.4 0.1% 0.0% 0.1%
i ITALY 1.6",{, 2.7% 2.6% 1.1% 1.6%
I
NETHERLANDS 4.3",{, 2.0% 2.5% 2.7% 3.1%
I
i
PORTUGAL SPAIN 0.2% 3.3°.4 0.3% 3.5°h 0.0% 4.0% 0.2°h 4.0% 0.9°.4 3.6%II UNITED KINGDOM 4.5°,{, 3.6% 1.8% 2.7% 2.4%
iiTOTALEC 26.8% 23.7%: '26.~ 24.5%' ' 27.1%
I
OTHER FINLAND N/A 2.9% 2.9% 3.0% 3.7%AWES NORWAY N/A 2.6% 2.5% 3.1% 2.1%
SWEDEN N/A 2.6% 3.0% 1.7% 2.2%
I
I
iTOTALAWES 37.5% 31.9%; ; 35.1% 32.3%'. 35.7%.
I
!
[JAPAN 37.8~~ 41.2~~;. ; 40.3% 39.B%· -~ 35.2%
i
KOREA 1.6",(, 3.5%1 3.7% . 6.0% 7.3%\CHINA N/A N/A 0.2% 0.7% 1.3%
POLAND N/A 3.9% 2.5% 2.5% 2.0%
I
ROMANIA N/A N/A N/A N/A N/A1 BULGARIA N/A N/A N/A N/A N/A
/USSR N/A 3.4% 4.3% 3.5"h 3.5%
RUSSIA UKRAINE
f YUGOSLAVIA NIA 1.4% 1.6% 1.5% 1.6%
I CROATIA
I
~~REST
OF WORLD 23.1% 14.7% 12.3% 13.6% 12.4%~~TOTAL
WORLD 1CXlO% 100.0% 100.~ 100.0% . 100.0'*'1984 1985 1986 1S87 1988 1989 1990 1991
0.7% 0.9% 0.4% 0.3% 0.5% 0.4% 0.6% 0.2",{, 2.4% 3.1% 2.9% 2.1% 3.2% 2.9% 2.6"h 3.0%
2.4% 1.2% 1.2% 2.2% 0.7% 2.0% 1.0% 1.5%
7.8% 8.1% 8.8% 8.3% 10.3% 8.6% 8.6% 7.0%
0.3% 0.3% 0.2% 0.1".4 0.1% 0.1% 0.4% 0.1°.4
0.0% 0.0% 0.0% 0.0% 0.0% 0.0% 0.0% 0.0%
1.2°.4 0.9% 0.5% 2.4% 1.4% 2.9% 2.8% 3.7°.4
1.7% 2.2% 2.2% 1.6% 1.8% 1.7% 2.3% 3.1%
0.1% 0.3% 0.5% 0.3% 0.3% 0.5% 0.6% 0.3%
2.3% 2.8% 1.9% 3.6°h 3.8% 3.1% 3.1% 2.6%
2.0% 1.2% 1.2% 1.8°h 1.3% 1.6% 1.2% 1.5°h
20.~ · ·j: zo.s;.; 1. :.:11).7%+ ~-6~'~" ·r'23.st~:t/t23;_n'!t _ ~~· 23Z:i· -· 12j.~"
2.8% 2.0% 2.1% 1.6% 3.1% 3.3% 3.3% 1.8%
1.2% 1.6% 1.3% 2.0% 1.8% 0.8% 1.4% 2.2%
1.2% 0.9°h 1.0% 1.3% 0.8% 0.3% 0.4% 0.4%
' 1992 0.8%i1 3.4%il 1.5%; 7.9%11 0.0% 0.0%! 2.4%1 2.2%1 0.5%1 3.5% 1.2%; 23.~s 1.7%: 2.5%, 0.3%.
; 2S.O% : ! 25.!m i <'24.1~''t'; 27.~~~::t·:~.2~~ ··! :_"·;2!3i1~··:r,~~-21~'; · !27A~L1· 2!3.~1
!
.(8.3% ·- i 45.9% 1:·- 41.9<11. · L 41.i~~: +'34.:3% · !_<_.; :37!1~~ :_ · f'.· ~~ j ci 33.3% · i . 36;1~\
s.a~- -! 11.5% ~- ;,1S.2% l 12.~-- 'i;11'.5~!i •:114;1~;:. t:'13.~; f-15.0'!.' ..
,6.5""i
I
2.0% 1.2% 1.6% 2.2% 2.9% 2.3% 2.6% 2.2°.4 2.3%1
2.5% 2.5% 2.8% 3.2°h 4.0",(, 2.4% 1.5% 1.9% 2.5%:
N/A N/A NIA NIA NIA NIA N/A 1.1°.4 1.2%1
NIA NIA NIA NIA NIA N/A NIA 0.6°h 0.5"hf
4.6% 1.9% 1.4% 0.5% 0.7•,(, 2.3% 4.1".4 3.2% I
0.2%i 1.0%:
1.6% . 2.0% 1.6% 0.0% 2.7% 3.3% 2.5% 2.1% 0.2%1
2.0%1
I I
10.1% 9.6% 10.2% 12.6% 8.7% 10.4% 9.4% 8.2% 9.5%!
100.0% I 100.0% ;: 100.0%:_,1.- 100.0%' :··:·1oo.o~-;t:.:100.0% r 100.0% t · .100.0%. 100.0%i
Source: 'WORLD SHIPBUILDING DATABANK" based on data supplied by LLOYD'S MARmME INFORMATION SERVICES
(1) From 1980 on data includes production from Ex-GDR yards
~
[image:19.833.46.763.98.485.2]!, I
I!EC BELGIUM 75.0 5308 81.4 43.3 5807 6905 2608 43o2 3400 5200 101.7 7104 7501 14.0f
DENMARK 31701 28406 29606 25006 42809 40502 8600 30509 21902 20503 19204 596.4 26509 246.6,
i FRANCE 63.6 55604 333.0 17509 13604 10605 26205 132.4 6005 20406
16509 136.2 32709 3500! I
I GERMANY (1) 72601 61300 124909 123909 123609 1ono9 1228.2 1297.1 87204 877.6 140006 87506 55901 65809,
,, GREECE N/A 8204 405 1003 406 7o4 2904 501 605 601 5o0 Oo8 8o9 Bo7j
IRELAND 1902 103 1802 103 000 o:o 000 000 000 000 OoO OoO 000 0.01
,,
ITALY 30105 23102 14407 24302 5701 6802 25704 22900 408.7 1no3 56408 41301 38005 13409:
!i NETHERLANDS 62604 37303 36502 30900 23703 24804 26908 13700 9109 35802 23603 277.1 29607 21100:
!I
'I PORTUGAL 7300 3007 5505 2708 3600 3006 102 2905 78.1 33.1 69.6 7906 803 1.5j
/! SPAIN 29700 73705 67502 32309 22201 9202 197.6 25805 421.7 45308 274.1 487.8 7408 127.51
il
UNITED KING::"JM 62706 35002 41008 301.5 150.4 107.6 22404 112.0 11605 124.2 20902 205.1 17206 119081I I
I
312605 2926.7 . 2568.4 2208.5 ; ( 2583.3 ~ : 2549.7< 0; 2309.!5:· 0 ( 248!5:2 : .. ~ 3219.6. .. · : 3jl0;1 .. 02169.8
!TOTALEC 3314.4 363500 1757.9:
i I
; 1
oTHER FINLAND N/A 52309 50205 221.1 13504 38905 15800 20202 637.7 10800 63.0 25607 13904 17807:
t,AWES NORWAY N/A 38106 40807 15604 10808 20802 129.9 136.4 13902 112.1 398.8 19009 11801 165001
~~ SWEDEN N/A 20504 35903 18405 27804 3400 16.1 5902 7104 13.2 110.1 308 4.3 2305;
I,
!TOTALAWES 0 4559.5 442503 . 4905.5 ° 3488.7 • 309tO . 2S«J.20:,!: 2S87;3 l · !~7~5·:::<· 3157.a~~o:t':27°1Sp.: to'
3J91.5. ;
~:~,!5'; ;.~431.6 c L 212S.1ji I
I
JAPAN0 .
7337.5 670803 : 5823.1 4859.4 : 7389.1 ~.oo ' 0 4440.o l 0 3431',8 ' '3120.5\~ j.3:3E!Otf·: ~ • ·~79:71 ·:. i: S'18.4: '443a0 o.' 3268.3!
I
KOREA j 325.-4 939.3 893.3 1001.5 i 2147.1 1180.9 ·:; eoo.s; • ~1~2.4.;:t',•1942.8t;~-fi~~':i .-,·!!~1~4; ; L2ie9.2·: ~ .-2218.1 0 ~-1095.3
I
I CHINA N/A N/A 23300 11906 26509 17909 20400 321.5 26308 33006 25805 387.4 42907
585.o:
I POLAND N/A 208.4 14600 133.3 489.8 417.1 27003 321.4 30206 21804 20905 218.4 29509 434.5i
i:ROMANIA NIA N/A N/A N/A N!A N!A NIA N!A N!A N/A N/A N/A 55004 57001
II BULGARIA N/A N!A N/A N!A N/A N/A NIA N/A N/A NIA N/A N!A 109.9 45.8:
N/A 1201 2400 6804 N/A 2.9 N!A N/A N/A 92.6 214.1 209.1 8306 I
uUSSR I
1: RUSSIA 25406i
I' UKRAINE
105.9! ,.
'i i
!.YUGOSLAVIA WA 24203 76.8 320.0 123.8 7500 32906 447.3 130.8 306.9 47905 322.6 127.4 I
:i CROATIA 129.01
!I I
I
':REST OF WORLD 3659.9 182200 1951.4 1542.3 1323.4 1041.7 1383.7 680.4 82200 895.2 1061.1 126509 117504 n9os
!I TOTAL WORLD 15962.3 14357.7 1405301 11533.2 14850.1 11m.1 ·10321.4; :9482.1"' ., 9740.1'- '·!·912S:S; 0'.:13564.3 . ~1~.50'·0 011915.0 . ' 8820.11
\i - ..
-Source: 'WORLD SHIPBUILDING DATABANK" based on data supplied by LLOYD'S MARITIME INFORMATION SERVICES
(1) From 1980 on data includes new orders from Ex-GDR yards
[image:20.833.19.783.83.457.2]r
I
1976 1980 1981 1982 1983 1984 1985 1986 1987 1986 1989 1990 1991 1992 iI I
IEC DENMARK BELGIUM 2.0°.4 0.5% 0.4% 2.0% 0.6% 2.1% 0.4% 2.2°.-E. 0.4% 2.9% 0.6".4 3.4% 0.8% 0.3°.4 3.2% 0.5% 2.3% 0.3% 2.2% 0.6% 1.4% 0.7% 4.2% 0.5°.4 2.2% 0.6% 0.2%: 2.8%
FRANCE 0.4°.4 3.9°1. 2.4% 1.5°.4 0.9% 0.9% 2.5% 1.4% 0.6% 2.2% 1.2% 1.0"1. 2.8% 0.4%1
II
GERMANY (1) 4.5°.4 4.3% 8.9% 10.6".4 8.3% 9.1".4 11.9% 13.7% 9.0% 9.6% 10.3% 6.1°h 4.7% 9.7%
GREECE NIA 0.6% 0.0% 0.1".4 O.O"h 0.1% 0.3°.4 0.1% 0.1% 0.1% 0.0% 0.0% 0.1°.4 0.1%:
IRELAND 0.1°.4 0.0% 0.1% 0.0°.4 0.0% 0.0% 0.0% 0.0% 0.0% 0.0% 0.0% 0.0% O.O"h 0.0%\
ITALY 1.9°.4 1.6% 1.0% 2.1% 0.4% 0.6% 2.5°.4 2.4% 4.2% 1.9% 4.2% 2.SOh 3.2°.4 1.5%;
I
NETHERLANDS 3.9% 2.6% 2.6% 2.7°.4 1.6% 2.1% 2.6% 1.4% 0.9% 3.9% 1.7% 1.SOh 2.5% 2.4%\!
PORTUGAL o.5"A. 0.2% 0.4% 0.2% 0.2% 0.3% 0.0% 0.3% 0.6% 0.4% 0.5% 0.6% 0.1% 0.0%1I SPAIN 1.9°.4 5.1% 4.8% 2.6".4 1.5% 0.6% 1.9°.4 2.7% 4.3% 5.0% 2.0% 3.4% 0.6% 1.4% I
i UNITED KINGDOM 3.9% 2.4°h 2.9% 2.6% 1.0% 0.9% 2.2% 1.2% 1.2% 1.4% 1.5% 1.4% 1.4% 1.4°.4:
~~TOTAL
ECII
19.6% 23.1%. 25.9% 25.4% ; 17.3%. 18.8%;; r .,25.0% i;: t2e.9% ~t ,~.l'i'~:;.t~21.2%~:\.,_\ 1231~~ ;·1 :22.0% • c' 1~"
·
19.9%j!oTHER FINLAND
I
N!A 3.6% 3.6% 1.9% 0.9% 3.3% 1.5".-E. 2.1% 6.5% 1.2% 0.5% 1.8% 1.2% 2.0%'
AWES NORWAY NIA 2.7°h 2.9% 1.4% 0.7% 1.8",(, 1.3% 1.4% 1.4% 1.2% 2.9% 1.3°1. 1.0% 1.9%1
SWEDEN N!A 1.4°h 2.6% 1.6°h 1.9% 0.3% 0.2"h 0.6% 0.7% 0.1°h 0.6% O.O"h 0.0% 0.3%:
I
TOTAL AWES 29.2% 30.6% 3-4.9% 30.2% 20.8% 24.1% ·:; 28.0%! :,29.S% ·, i· ~.;28.Q'lf; • ~-- 25,1% 'L ·· t 20.4% · 24;1%!
r, .. ... ·- --· . --· ... ·-·
·-
·-· ·-..._
..--·
·-
--·.
A - A A • • :·--.-...
·-
.
-··
...._ ... uKOREA 2.0% 6.5% 5.4% . 6.7% 14.5% ·10.0%. • ;7.8% ( :: 14.~ J:: '19.9%~.J:~1S.2%,i;\· .: \12!JCJ(;. ·t ~~15.2% i r19.1~ ; .12.3%jl
CHINA N/A NIA 1.7% 1.0% 1.9°h 1.5% 2.0% 3.4% 2.7°.4 3.6% 1.9% 2.7•,(, 3.6°.4 6.6%,\
POLAND N!A 1.5°h 1.0% 1.2% 3.3% 3.5°h 2.6°h 3.4% 3.1"h 2.4% 1.5% 1.5°h 2.5°.-E. 4.9%i
ROMANIA N/A NIA N!A NIA N!A N/A N!A N!A N!A N/A N!A N!A 4.6°.4 0.5%\!
BULGARIA N/A N/A NIA N!A N!A NIA N/A NIA N!A NIA N!A N!A 0.9% 0.5%i
USSR N!A 0.1% 0.2% 0.6% N/A 0.0% NIA NIA N!A 1.0% 1.6% 1.5"h 0.7°.4
I
RUSSIA 2.9%1
UKRAINE 1.2%1
I
YUGOSLAVIA N!A 1.7% 0.5% 2.8%. 0.8% 0.6% 3.2°h 4.7% 1.3% 3.4°h 3.5% 2.3"-t 1.1°.-E.CROATIA 1.5%
/REST OF WORLD 22.9°.4 12.7% 13.9% 13.4% 8.9% 8.8°.-E. 13.4% 7.0% 8.4% 9.8% 7.8% 9.0"h 9.9% 8.3%
!TOTAL WORLD 100:0% 100.0%: 100.0".4 100.0% "100.0% 100.0% :_; 100.0% i ' 100.0% i(-100.0%'"'; f100.Q%It!!'.100~.-"J':1CXJ.tl'~~t· •.100.0% 'i 100.0%
Source: 'WORLD SHIPBUILDING DATABANK" based on data supplied by LLOYD'S MARmP.lE INFORMATION SERVICES
(1) From 1980 on data includes new orders from Ex-GDR yards )...r.
/ B • other EC countries A B C A
I
B C A B C A B C A B C A B C A B C A B C A B C A B CI
C • third countries•%oftotal 64 5 31 n -u. 64 4 32 77 7 16 78 ;s _ _19 80 6 15 54 4 42 6Q_ ~- 31 58 12 3C 45 12 43
!TOTAL in '000 CGT p 3027 1876 2009 1297 1737 1243 2073 2156 1754 1441
~ORDERS RECEIVED BY COMMUNITY SHIPYARDS
1976 1982 1984 1986 1987
~~From shrpowner tn: A-national
B ·other EC countries A B
c
A Bc
A Bc
A Bc
A Bc
! C ·third countries
1:% of total 70 I 5_ _25 73 1 26 79 5 17 63 6 31 68 3 29
~OT Al in '000 CGT ~ 2756 1988 1657 1581 1971
Source: WORLD SHIPBUILDING DATABANK based on data supplied by LLOYD'S MARITIME INFORMATION SERVICES Remarks: 1976 • EC excluding Greoce; from 1986 • EC Including Portugal and Spain; from 1990 EC Including Ex-GDR
1988 1989 11390 1991 1992
A B
c
A Bc
A BI
c
A Bc
A B144 3 53 41 3 56 41 6 153 47 9 44 :36 1(
2260 2754 3143 2170 1758
c
54
[image:22.835.26.737.76.239.2]jL__ '000 CGT % I '000 CGT % '000 CGT % '000 CGT % '000-CGli % I
11 1977 WORLD 790.6 1783.2 8497.3 2969.8 14040.9
t
EC 30.9 .. 3.9 75.1 4.2 1764.4 20.8 670.5 22.6 2540.9 18.1 Ii: 1978 WORLD .1185.4 534.6 6163.8 1912.7 9796.5
I
EC 56.2 4.7 23.6 4.4 1341.3 21.8 591.5 30.9 2012.6 20.5;r
1979 WORLD 3364.8 2744.9 5148.4 2949.8 14207.9il
EC 168.1 5.0 466.5 17.0 1172.6 22.8 747.6 25.3 2554.81 18.0:1 1980 WORLD
I
2960.2) 4325.3 4780.1 2291.9 14357.5: EC 273.7 I 9.2 425.9 9.8 1023.4 21.4 740.8 32.3 2463.81 17.2
:~ 1981 WORLD
I
1166.71 4934.9 4967.9 2433.0 13502.5:1 EC I 75.1 6.4 487.9 9.9 1342.7 27.0 606.4 24.9 2512.11 18.6
:[ 1982 WORLD
I
662.6 2335.3 5679.9 2135.4 10813.2~~---_ EC 70.3 10.6 197.5 8.5 1093.2 19.2 628.0 29.4 1989.0 I 18.4
II 1983 WORLD
I
1682.1 5370.3 5910.8 1886.9 14850.1'' EC 92.3 5.5 110.7 2.1 1039.9 17.6 380.9 20.2 1623.81 10.9
!f 1984 WORLD
I
1176.2 3890.6 4742.2 1956.8 11765.8:~ EC , 179.3 15.2 165.6 4.3 944.2 19.9 448.8 22.9 1737.91 14.8
i.l 1985 WORLD
I
470.1 3918.4 5299.9 2089.2 11777.6'I
'I
EC . I 15.3 3.3 152.8 3.9 1029.7 19.4 459.3 22.0 1657.11 14.1ii
1986 WORLDJ
1199.7 1296.0 4208.4 2778.0 9482.1~~
EC .. 0.0 0.0 108.0 8.3 768.6 18.3 704.7 25.4 1581.31 16.71
j 1987 WORLD 1404.6 1033.2 4899.7 2402.7 9740.21
. EC 107.5 7.7 45.3 4.4 1128.1 23.0 690.1 28.7 1971.01 20.2
I
1988 WORLD 781.8 2164.5 3985.6 2194.0 9125.9f EC. 116.7 14.9 0.0 0.0 1095.5 27.5 1048.1 47.8 2260.31 24.8
IJ 1989 WORLD 1943.6 2483.1 6798.4 2339.3 13564.4
f. EC 219.9 11.3 70.8 2.9 1454.3 21.4 1008.8 43.1 2753.8 20.3
1
il
1990 WORLD 4127.9 1639.0 6530.2 2006.5 14303.6:[._ EC 542.6 13.1 207.0 12.6 1541.0 23.6 852.0 42.5 3142.6 22.0
~~ 1991 WORLD 1917.9 2218.0 6507.9 1271.3 11915.0
!
EC 215.3 11.2 207.5 9.4 1387.4 21.3 359.8 28.3 2169.91 18.2!I
1992 WORLD . 1209.4 1761.3 4313.9 1535.7 8820.3:1 EC , 236.0 19.5 0.0 0.0 923.0 21.4 599.1 39.0 1758.11 19.9
Source: WORLD SHIPBUILDING DATABANK based on data supplied by LLOYD'S MARITIME INFORMATION SERVICES
[image:23.836.33.660.89.487.2]I
EC BELGIUM 277.0 331.7 311.5 261.1 143.7 136.1 62.1 60.0 75.0 62.0 147.7 154.4 213.4 116.8:
DENMARK 923.5 652.4 618.9 603.9 707.7 692.2 442.1 429.8 473.9 459.6 589.7 927.7 876.6 674.31 FRANCE 1770.4 1193.7 1138.2 978.5 598.6 263.3 382.7 371.2 234.5 379.9 361.9 397.2 556.8 410.81 GERMANY {1) 2113.3 950.9 1082.0 11n.7 1178.1 959.4 1118.9 1281.7 1426.3 1429.2 1974.0 1955.0 1529.9 1471.4i
GREECE N/A 240.6 245.4 191.4 146.1 137.4 119.9 102.8 121.5 116.6 113.6 69.1 73.0 42.3\
IRELAND 43.9 17.8 19.3 20.0 2.1 0.0 0.0 0.0 0.0 0.0 0.0 0.0 0.0 0.0~
ITALY 1036.2 639.8 427.3 480.4 356.3 195.5 345.5 465.8 804.8 904.2 1188.6 1298.4 1190.9 1036.41 i NETHERLANDS 917.1 493.7 551.7 498.8 308.8 331.6 300.3 195.6 141.8 365.1 414.5 443.4 387.5 321.5
1
PORTUGAL N/A 191.2 240.4 258.4 124.1 138.3 94.0 67.0 108.3 114.0 155.7 181.6 153.1 96.5!
SPAIN N/A 1769.5 1754.0 1325.3 967.4 690.5 491.5 527.7 635.6 837.7 853.7 1004.1 757.2 476.4!
I UNITED KINGDOM 1989.4 615.0 768.9 714.1 506.1 292.3 352.5 325.4 369.7 317.1 376.5 418.9 413.6 411.51
i
I
:ToTAL EC 9070.8 7096.3 7157.6 6509.6 . 5039.0 383a.6 .. , 3709.5 3827.0. ·" #51:4: .·· Sl05.6 .· 6175:9. .·: ,~.8~1· ;61~2.0 5057.9i I
!oTHER FINLAND N/A 1144.3 1139.5 1023.8 710.3 642.2 544.4 483.9 991.0 962.9 652.1 589.4 494.3 467.11
lAWES NORWAY N/A 589.3 670.3 371.9 185.6 229.8 148.1 146.8 136.9 114.3 422.8 483.6 381.8 284.3)
I
SWEDEN N/A 703.8 646.3 494.9 494.5 267.8 181.7 137.5 93.8 39.0 115.3 64.3 23.9 23.7ii !
!TOTAL AWES · 15839.2 9533.7 9613.7 8400.2 I 6429.4 4976.4: J 4583.7 : ... 4595,~:x, !i673,1!:~·:L~21.B i; .:~·13SS<'t;!-·7'961.1i!:j'7052.0. SS33.0j
I
!JAPAN
I
12093.8 7297.8 7457.7 6640.2 8477.9 8221.5 .! 5915.2' 391!5.9 ;r ~18.!5!' ·.: 3473.9 :, :5e9f3.5 . 7494.7 i. ;'7'621:8 6482.71 I
!KOREA .7943.2 1320.3 1711.1 1854.9 .2BS8:4 32231;•.t ·.~:··· 2fSTS.7· "10092•··'·:~' .. ~.~--~· 7j"2639:1''<'<'23427 •. ;,.~~~;...; ~.~..:·.~·:· 1 '2813t··H·.S!n17'i . . . _,, .. t;o.t '39227 '' • . '
ao12.21
[CHINA N/A N/A 260.9 298.3 493.5 433.2 486.5 547.0 647.3 809.8 681.0 813.6 942.0 1235.71
!POLAND N/A 1634.6 1459.0 1174.6 1143.1 1272.1 1018.1 1041.6 1251.6 1131.3 1080.1 1136.6 999.7 1124.6i
jROMANIA N/A N/A N/A N/A N/A N/A N/A N/A NJA N/A N/A N/A 912.6 766.01
jBULGARIA N/A N/A N/A N/A N/A N/A N/A N/A N!A N/A N/A N/A 237.0 224.0!
:ussR N/A N/A 128.9 92.7 53.9 42.8 N/A N/A NJA 74.1 248.5 343.1 360.4 i
I
RUSSIA 465.4/
I I
i UKRAINE 237.91
!YUGOSLAVIA N/A 760.7 626.7 699.9 492.6 455.4 545.9 840.0 751.4 861.9 1011.4 1046.9 886.3 133.3
' CROATIA 532.2i
I
I I
iRESTOFWORLD 3693.0 5045.1 5105.6 4570.7 4129.7 3448.0 3435.8 2796.8 2675.0 2857.9 3071.2 3343.5 3003.2 2601.8)
I
iTOTAL WORLD 39569.2 25592.2 26363.6 23731.5 24118.5 22on.s : 18!563.9 15645.7 1S558.0 • 17B73.4 21967.9 25e462·= 25937.7 22648.8i
! I
Source: 'WORLD SHIPBUILDING DATABANK'' based on data supplied by LLOYD'S MARITIME INFORMATION SERVICES
(1) From 1980 on data includes order book from Ex-GDR yards
~
[image:24.834.22.764.71.454.2]r
!/EC BELGIUMI
DENMARK FRANCE
GERMANY (1)
I GREECE
I IRELAND
I ITALY
I
il
NETHERLANDS PORTUGAL SPAIN I•I UNITED KINGDOM 1:
/ITOTALEC
~~OTHER FINLAND AWES NORWAY SWEDEN I
I TOTAL AWES I JAPAN I
!I KOREA
I: cHINA ijPOLAND
! ROMANIA BULGARIA USSR RUSSIA. UKRAINE YUGOSLAVIA CROATIA
REST OF WORLD
!!TOTAL WORLD.
1976 1980 1981
0.7% 1.3% 1.2% 2.3% 2.5% 2.3% 4.5°..!. 4.7% 4.3% 5.3% 3.7% 4.1%
N!A 0.9% 0.9%
0.1°..!. 0.1% 0.1% 2.6% 2.5% 1.6% 2.3% 1.9°..!. 2.1% N/A 0.7•,!, 0.9%
NIA 6.9% 6.7%
S.O"h 2.4% 2.9%
22.9% 27.7% 27.1%
N/A 4.5% 4.3%
N/A 2.3% 2.5%
N/A 2.8% 2.5%
40.0% 37.3%· : 36.5%
30.6"h 28.5%. 28.3%
20.1% 5.2%" 6.5%
N/A N/A 1.0%
N/A 6.4",{, 5.5%
NIA N/A IUA
NIA N/A N/A
N/A N/A 0.5",(,
N/A 3.0",{, 2.4%
9.3% 19.7% 19.4%
·10Cl0% 100.0%. 100.0%
1982 1933 1984 1985 1986 1987 1988 1989 1990 1991 1992 I
I I 1.1'.(, 0.6% 0.6"h 0.3°h 0.4% 0.5% 0.5% 0.7% 0.6% 0.8% 0.5%! 2.5% 2.9% 3.1% 2.4% 2.7% 2.9% 2.6°..!. 2.7% 3.6% 3.4°h 3.0"hi 4.1°..!. 2.5% 1.2°..!. 2.1"..!. 2.4% 1.4°..!. 2.1'..!. 1.6% 1.5% 2.1% 1.8%; 5.0% 4.9% 4.3".(, 6.0% 8.2% 8.6% 8.1% 9.0% 7.6"..!. 5.9% 6.5%' 0.8% 0.6% 0.6% 0.6% 0.7% 0.7"..!. 0.7'..!. 0.5% 0.3"h 0.3% 0.2%1
0.1% 0.0% 0.0% 0.0% 0.0% 0.0% 0.0% 0.0% 0.0% O.O•..E. 0.0%1
2.0% 1.5% 0.9% 1.9% 3.0% 5.2% 5.1% 5.4% 5.1% 4.6% 4.6%[
2.1% 1.3% 1.5% 1.6% 1.3"..!. 0.9% 2.1% 1.9% 1.7% 1.5% 1.4%; 1.1"..!. 0.5% 0.6% 0.5% 0.4% 0.7% 0.6% 0.7% 0.7% 0.6% 0.4%\
5.6% 4.0% 3.1% 2.6% 3.4% 3.8% 4.7% 3.9% 3.9% 2.9% 2.1%i
3.0•,(, 2.1% 1.3% 1.9% 2.1% 2.2% 1.8% 1.7% 1.6°..!. 1.6°.4 1.8%; I 27 A%. , 20.9% 17.4%·_;.L 20.1J<'...r.' • 24$"<!.• :26.9%::;~~~·~ .. '' ·: '2S;1o/.>: :.:'~-2e.7%it· .:123.7%_ ·: 22.3%j I
4.3% 2.9% 2.9% 2.9% 3.1% 6.0% 5.4% 3.0% 2.3% 1.9% 2.1%;
1.6% 0.8% 1.0% 0.8% 0.9",(, 0.8°,(, 0.6% 1.9% 1.8% 1.5% 1.3%1 2.1",(, 2.1% 1.2% 1.0% 0.9% 0.6% 0.2% 0.5% 0.3"h 0.1°h 0.1%
I 35.4%' ' 26.7% . 22.5%:.:1- · 24.7%;; .t:·29Ae.\·:·i-; :34.s~·~ .. ~tt~.sw-r~.:;s:ts%}:1. ;11.1%\t :l-27..2% .:. ". 25.8"'-'1
I
28.0%' ' 35.2% ·37.2% • t · 31.9%: 'i.25.0";;, ·!:<17.B%:~.:~:~19.ni ·. ::·25:~ :7: .29.2'%~! 'iZt4% ·;· 2M~1
7.8% . 12.0% . 14.6" :· 'i- 13.9% . :, 12.~:::t··r15.9%:: '~' 13.3%'-' .-i~12.S% · ·~,, 13.5%:1. ·::.;1!!.1~ i'- !f3,~1
1.3% 2.0% 2.0% 2.6% 3.5% 3.9% 4.6% 3.1% 3.2% 3.6% 5.5%i
4.9% 4.7% 5.8% 5.5% 6.7% 7.6",(, 6.4% 4.9% 4.4% 3.9°h 5.0%
N/A N/A N!A N/A N/A N/A N/A N/A N/A 3.5% 3.4%
N/A N/A N!A N/A N/A N!A NIA N/A N/A 0.9% 1.0%
0.4% 0.2% 0.2% N/A N/A N/A 0.4% 1.1% 1.3% 1.4",{,
2.1% 1.1%
2.9% 2.0% 2.1% 2.9"h 5.4% 4.5% 4.9% 4.6% 4.1% 3.4°h 0.6%
2.3%
19.3% 17.1% 15.6% 18.5% 17.9% 16.2% 16.2",(, 14.0% 13.0% 11.6% 11.5%'
100.0% . 100.0% 100.0%r/L100.0%-;· 100.Q%·'L.100.o% -:>~100.~-_:; -'100~::Y 100.~;~ .. ~ ~.100.04",-:!, ·100.0%, !
Source: 'WORLD SHIPBUILDING DATABANK'' based on da!a supplied by LLOYD'S MARmP.lE INFORMATIOU SERVICES
(1) From 1980 on data Includes order book from Ex-GDR yards ~
1 000
CGT[I
- - - · - - -
-SHIPS ORDER BOOK
fOMPLETED ASAT FOR DELIVERY IN:
'
:
1992
31/12/92
1993
1994
1995
1996
\ I ND BEYOND
f8ELGIUM
I
97.6
116.8
99.4
17.5
0.0
0.0
ilDENMARK
I~
414.5
674.3
385.7
168.6
120.0
0.0
;!FRANCE
182.4
410.8
69.71
89.1
126.0
126.0
!!GERMANY I I
958.3
1471.4
902.9
414.5
154.0
0.0
!!GREECE
!
0.0
42.3
34.1
8.3
0.0
0.0
J
11RELAND
'
0.0
0.0
0.0
0.0
0.0
0.0
I
i
ITALY I289.21
1036.4
668.6
301.3
66.5
0.0
!NETHERLANDS
270.9
321.5
221.5
86.0
14.0
0.0
I
PORTUGAL64.4
96.5
80.9
15.5
0.0
0.0
·SPAIN
428.3
476.4
413.6
62.8
0.0
0.0
!I
UNITED KINGDON139.5
411.5
178.5
87.0
79.5
66.6
IITOTALEC-.- v
II
'2845.111
5057~911:''. 3054.9
r
i' '.\1250.6f.·:!·;~'-:·l660i0lc~'!l:?~~=h;~92:61Source: WORLD SHIPBUILDING DATABANK based on data supplied by LLOYD'S MARITIME INFORMATION SERVICES
Remarks: Data includes order book from Ex-GDR yards
1'-o
[image:26.836.45.609.87.372.2]a---[~
-T
--1!17811!l79,.
1 I I I I1975 1980 1931 1982
'·l>ELGiillJ"-- 7467 6614
62581
6523 6347 4i>i>JDENMARK 15630 12000 9000 11400 11l50 11800
FRANCE (1) 32500 25300 2300J 22200 22200 21500
GERMANY 46839 31113 27359 2478-4 25521 27500
GREECE 2316 N!A NIA 2672 3393 2900
IRElAND 869 840 750 750 762 882
, ITAlY 25000 20CXlO 19000 18000 16500 137 50
~t-;ETHERLANDS (2) 22'362 17540 14540 13100 13100 12800
)PORTUGAL NIA NIA NIA
I
~A NIA NIAISPA!N NIA NIA NIA N/A NIA NIA
IUN1TEDKINGOOM- ~ 410501 312001 24300 25345 2500l
1933 4104 11200 21000 25966 2312 550 12800 11250 NIA NIA 20488 1984 4000 10300 1SS40 22183 2000 0 12800 10330 NIA NIA 14555 1985 ~23 10200 15053 22250 2000 0 12000 S236 5370 1ero::l 14200
1SSSI 1987
Ziiir.J ~
7000 7000
13700 8940
1818-4 12875 1709 1621
0 0
11570 9500 (3) 5400 3SOO
5087 5020
100J0 17300
12500 11500
1988 Z270 7300 6850 14345 1855 0
8-428 (3)
3500 4412 14000 9000 19e9 2:>J7 7900 B800 U732 1535 (4) 0
9575 (3) 3500 4245 ~~ 64S4 1990 7.377 8400 6000 15297 (5) 550 0
S84a (5)
:!9:X) 38-45
11~
6126 (7)
1991
2418
8600
5100
2nSJ (B)
0 0 8299 (9) 4000 362'J 11440 5984 19S2 23S1 8300 6040
23149 (8) 0 0
8200 (10 4000 :\520 107:\5 5820
lli?.rt-n-t:C"-- ~-x..wr:J¥§71 1;;111ZL---rnm1 IL:x>lat. 1210121 no1e..sr- S32-;;.rr;::nmur;-:--,;ijf4512£-~u.-n~;:~:rrr:r;;::z§l?H:?·J~l6 .•. ~--" .78004204;1 i ... ms2 1
Ta:>'e compiled from n!~onal sou~
(1) From 19SS o-• tne fiQure covers jobs in new shipbu'l:l>ng and naval and para-n:!Vlll building (conver'jon, n!M!I ve!.Sels ar!d d.f-shore). Figures for ~e preceding years usin;J ~e same me!!lod are: 1975 • 32500, 1980.23700, 1985 • 1noo.
(2) From 1975 to 1984 inc!ud,~g naval dockyards es!ima!ed to be: 1975 ·1800, 1978 an::l1979. 3200, 1980. ~-1981 er!d 1982 • 3200, 1983 an::l1984 • 2SOO
(3) 2780 unemplcyed should be added b 1987's fi;11Jre. 2850 to 19-SB's figure and 2581 b 19-SS's fi~ure
Of these 2000 represent a structural over capaccy for -Mlom no n(!<N jo!ls can be found ( ~) Includes naval building
(5) Exclud1ng jobs in Ex-GDR's yards (5) Of v.flich 1838 curre~y mactM! (7) R!'V1sed ~gure •
(8) lncludlng11700 jcbs in Ex-GCR's yards in 1991 and 12~41 JObs in 1992
(9) 1321 unemployed should be added b this f.gure. repres~ntlng a structural over capaccy, whose elimin:r.on is foreseen dur1ng 19S2 (1 0) 700 unemployed si'lo'J!d be added to ~is f>gure, re~resen~.~g a s!:n.:cll.Jral over capaccy, for ..mom ra employment is not~
t--s:.