Rochester Institute of Technology
RIT Scholar Works
Theses
Thesis/Dissertation Collections
4-1-1962
Modification of the Morse Aerial Film Processor to
Reduce Processing Variability, and a Method of
Estimating Mean Gamma of the Processed Film
Robin Lambert
Follow this and additional works at:
http://scholarworks.rit.edu/theses
This Thesis is brought to you for free and open access by the Thesis/Dissertation Collections at RIT Scholar Works. It has been accepted for inclusion in Theses by an authorized administrator of RIT Scholar Works. For more information, please [email protected].
Recommended Citation
MODIFICATION OF THE MORSE AERIAL FILM PROCESSOR
TO REDUCE PROCESSING
VARIABILITY,
AND A METHOD OF ESTIMATING MEAN GAMMA
OF THE PROCESSED FILM
Robin M. Lambert
ABSTRACT
The operation of a Morse Aerial Film Processor was in
vestigated with the object of
improving
processing, so that statistically
significant variability of the gamma of the film would bereduced. The possibility of estimating the mean gamma of the whole
film with the aid of sensitometric exposures at the end of the
film was examined.
By
changing the attitude of the Processor and discarding
some footage at the ends of thefilm,
variability of gammaacross the width and length of the film was reduced to insignifi
cance. The reduction in variability made it possible to estimate
the mean gamma of the whole film
by
placing sensitometric exposuresat one end of the film.
INTRODUCTION
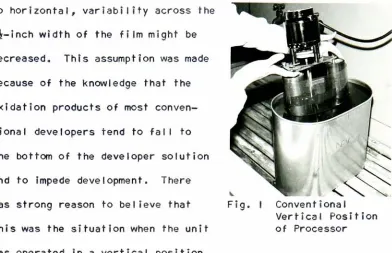
The Morse Portable Aerial Film Processor (also known as
the B-2 Rewind
Processing
Unit),
is conventionally used in a vertical position as shown in Figure I. The unit is very compact, is
run
by
a small reciprocating electric motor, and can process lengthsof film up to 180 feet. The disadvantages of processing with this
unit in the past have been the large degree of variability produced
by
the processor, and the unpredictability of the mean of an outputvariable, such as gamma, resulting in a lack of quality control of
the process.
After
Investigating
the processor it appeared that if theto
horizontal,
variability across the9Jr-inch width of the film might be
decreased. This assumption was made
because of the knowledge that the
oxidation products of most conven
tional developers tend to fall to
the bottom of the developer solution
and to impede development. There
was strong reason to believe that
this was the situation when the unit
was operated in a vertical position.
It was,
therefore,
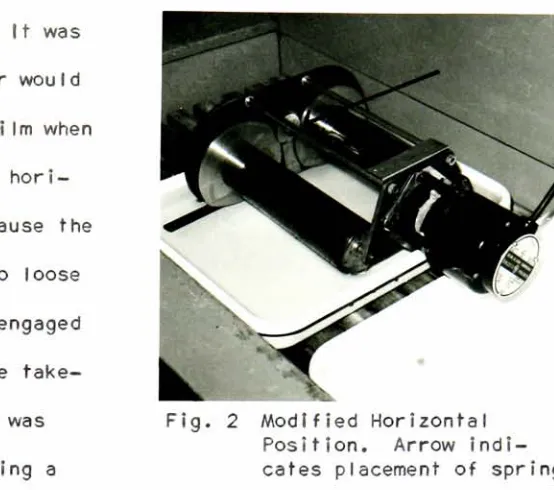
decided to investigate the operation of the processor in a horizontal position. The horizontal position is shown
in Figure 2.
Fig. I Conventional
Vertical Position
of Processor
OBJECTIVES
The objectives of the project were to Investigate the
processing unit and to discover a method of
improving
processing tothe point where there was no statistically significant variability
in gamma across the 94-inch width or the 75-foot length of the film,
A further objective was to find a method of predicting the mean
gamma of the fHm.
PROCEDURE
It was necessary to slightly modify the unit for hori
[image:4.552.84.476.86.339.2]Fig. 2 Modified Horizontal
Position. Arrow indi
cates placement of spring. vertical position. It was
found that the motor would
not transport the film when
the unit was in the hori zontal position because the
driving
gear was too looseand did not remain engaged with the gear on the
take-up spool. The gear was tightened
by
Inserting
asmall spring behind the
driving
gear as Indicatedby
the arrow in Figure 2. When processing
in the horizontal position the film was wound onto the unitemu IsIon out. It was thought that this would al low the oxidation
products to fall away from the emulsion side of the film rather
than col lect on it.
To answer the objectives, which depend upon statisti
cal evaluation, the investigation was carried out on a statistical basis. Standard 75-foot lengths of aerial film were used and proc essed to a gamma of about 1.2. Areas across the length and width
of the film were randomly sampled using sensitometric exposures,
and gamma was used as the response variable. Speed {calculated
by
the base +fog
+ 0.6 D criterion) was at first used as a responsevariable also.
However,
statistically speed and gamma agreed completely and in the final analyses only gamma was used. Three areas
[image:5.552.188.465.80.325.2]"middle"
and "bottom" for the vertical
process, and
"left",
middle"and "right" for
the horizontal process. These areas were randomly
placed
along
the length of the film at3-,
14-, 24-, 33-, 43-, 52-,
60- and 70-feet
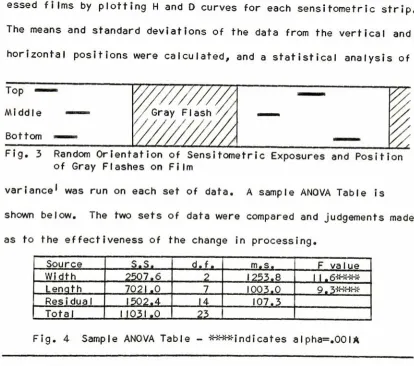
from one end of the film. Between the sensitometric
exposures were
six-foot-long
areas flashed toa
density
of 1.0.(Figure 3). The flashed areas were intended to have the same effect
on the developer as a normally exposed film.
Data were obtained for
vertically
andhorizontally
processed films
by
plotting H and D curves for each sensitometric strip.The means and standard deviations of the data from the vertical and
horizontal positions were calculated, and a statistical analysis of
Top
~Middle
Bottom
Fig. 3 Random Orientation of Sensitometric Exposures and Position
of
Gray
Flashes on Filmvariance1
was run on each set of data. A sample ANOVA Table Is
shown below. The two sets of data were compared and judgements made
as to the effectiveness of the change in processing.
Source S.S. d.f. m.s. F value
Width 2507.6 2 1253.8 | | .6-!HHBf
Lenqth 7021.0 7 1003.0 9,
3-5KHH;-Residual 1502.4 14 107.3
Total l|0?l,0 23
Fig. 4 Sample ANOVA Table - **#*indicates
alpha=.00IA
A Alpha Is defined as the probability of rejecting material of an
acceptable quality level, (e.g. Alpha =
.001 is the
probability
[image:6.552.59.473.279.645.2]DISCUSSION
All the data obtained is of course based on the straight
line portion of the curve. The points
determining
the straight lineand toe areas in general plotted quite consistently but there was
large variation In the shoulder areas In some cases. Due to this
variation, only the toe and straight line were drawn
in,
curves ofbest fit
being
fitted to the pointsby
inspection. At the ends ofthe film it became difficult
to draw curves of best fit
because of the large incon
sistencies in the plotted
points and great care was
taken to obtain a represen
tative curve. Figure 5
shows examples of some of
the curves obtained.
Curve (a) represents the
end of the film with large
variability of plotted
points and Curve (b) the
middle of the fi Im.
Reduction of Width and Length Variability
An analysis of variance run on the data obtained from
vertical processing indicated significant variation (alpha = .001)
in gamma both across the width and the length of the film. The ANOVA
for horizontal processing,
however,
indicated no significantLOG EXPOSURE
Fig. 5 Representative Characteris
variability for width but significance (alpha = .001) for length.
Thus,
processing in a horizontal attitude had reduced the widthvariability of the vertical process to a point of no statistical
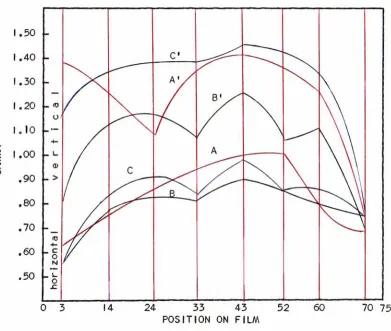
significance. Figure 6 shows the variability of gamma from end to
end on the film at the
"top",
"middle"and "bottom" positions. It
will be observed that the curves for the horizontal process more
closely approach an Ideal straight line than those for the vertical.
It is
interesting
to note that in the vertical process average gammafor the bottom of the film was somewhat lower than for the
top,
andthat average gamma for the middle was lower than both
top
andbottom. This partially substantiates the
theory
that oxidationCD 1.50 1.40 C 1.30 A// 1.20 O' B' y^ i.lo
4-1.00 _ S_ A
.90 _ >
c
B_^
.80 .70 .60 (0 4-_ C o.50 _l_ O
SZ
0 3 14 24 33 43
POSITION ON FILM
52 60 70 75
Fig. 6
Variability
of Gamma across Length and Width ofFilm for Horizontal and Vertical
Processing
A,B,C,
are"right", "middle",
"left" respectivelyA', B', C,
are"bottom", "middle",
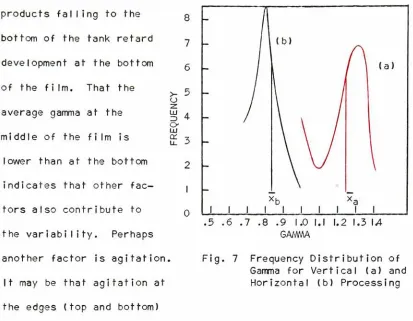
"top" [image:8.552.47.438.354.685.2]products
falling
to thebottom of the tank retard
development at the bottom
of the fi Im. That the
average gamma at the
middle of the film is
lower than at the bottom
indicates that other fac
tors also contribute to
the variability. Perhaps
another factor is agitation.
It may be that agitation at
the edges
(top
and bottom)8
-I\
7 - (b)
A
6 - I
o
(a) >- 5 os
* o LU OC , li. ->:
/
\\/
2
\
^
\
1
0
*b
i i i i i i i i 1 1
.5 .6 .7 .8 .9 1.0 I.l 1.2 1.3 \A
GAMMA
Fig. 7
Frequency
Distribution ofGamma for Vertical (a) and
Horizontal (b)
Processing
of the film is greater than at the middle. Average gammas for the
edges (left and right) of the film in the horizontal process were
close, but that for the middle was somewhat lower.
It was noticed that on the average for both vertical and
horizontal the gamma at the ends of the film was lower than elsewhere.
No doubt this contributed to the lengthwise variability. It was,
therefore, argued that
by discarding
the two ends of the film Itmight be possible to reduce the lengthwise variability. (This is
recognized as standard procedure in this field because of known
large variability at the film ends.) With this consideration, new
analyses of variance were run for vertical and horizontal data
omitting the data from the two ends of the film (the three and
[image:9.552.62.475.76.397.2]8
was no longer significant either for the vertical or horizontal
processes.
Relative Variability of Horizontal and Vertical Processes
The grouped data for each process appear plotted in fre
quency distribution form In Figure 7. The mean for each curve is
shown. It will be noticed that the mean gamma of the vertical proc
ess is considerably higher than for the horizontal.
(Apparently
thechange in position necessitates an increase in processing time).
This raises some question as to whether variability may have increased
with gamma.
However,
using the Coefficient ofVariation,
100 x standard deviation, it can be shown that standard deviation
mean
does not increase with mean.2 With this calculation the
following
relative variabilities can be shown, the larger amounts
indicating
higher variabi I i
ty
.PROCESS REL. VARIABILITY
Vertical
'
17.8
Horizontal I I .0
Vertical (without ends) 7.3
Horizontal (without ends) 2.3
Predicting Mean Gamma of a Processed Film
The results obtained from horizontal processing indi
cate the possibility of predicting the mean gamma of the total film
(minus some footage at each end) with the aid of sensitometric
exposures at one end of the film. It was calculated that the aver
age gamma of representative areas at the sixty-foot position on the
film falls within one standard deviation of the mean of the gammas
of the whole film. This indicates that a sensitometric exposure at
9
since it falls within the same area of the normal probability curve
as the mean.
Further work in this area is necessary so that the ac
curacy of predictions may be increased. It should also be noted
that this paper can only be used as a guide since it is valid only
for the situation tested. (See "Appendix").
CONCLUSION
There is no statistically significant variability in
gamma across the width of the film if the Morse Processor is operated
in a horizontal position with the film wound on emuIs ion out.
Significant variability in gamma along the length of the
film does not occur
if,
at most, fourteen feet of film at either endof the film is discarded. Further work may indicate that a smaller
amount of film can be discarded without significantly
increasing
variabi I I
ty
.For the situation tested sensitometric exposures at one
end of a film will give rei labile Information about the mean gamma of
10
APPENDIX
Exposure; Kodak 101 Sensitometer with twenty-one step wedge
(.15 increments). K2 (minus blue) filter.
Developer: Kodak D-76 with 14 grams/liter added borax.
Processing: Time: 9? minutes. Temperature: 68F. (Film was
presoaked before developing.)
BIBLIOGRAPHY
I.
Duncan, A.J.,
Quality Control and Industrial Statistics.Richard D. Irwin
Inc.,
Illinois,
1959,
pp. 519-91. 2. AmericanSociety
forTesting
Materials,
Philadelphia,
1 1
ACKNOWLEDGMENTS
Thanks are due to Messrs. J. Bennett and S. Buckman of
Hunting Survey
CorporationLimited, Toronto, Canada,
whooriginally suggested the subject of this paper, and who provided
much of the information and material necessary for carrying out the project.
I also wish to thank Professors
Rickmers,
Shoemaker and Todd of the Department ofPhotography,
Rochester Institute ofTechnology,
for their valuable guidance and assistance in the