The Role of Recrystallization in Spontaneous Grain
Refinement of Rapidly Solidified Ni
3
Ge
NAFISUL HAQUE, ROBERT F. COCHRANE, and ANDREW M. MULLIS
The congruently melting intermetallic b-Ni3Ge has been subject to rapid solidification via drop-tube processing. Droplets spanning the size range 75 to 53lm, with corresponding cooling rates of 23,000 to 42,000 K s1, have been found to undergo spontaneous grain refinement by recrystallization and recovery. Outside of this relatively narrow size range, the primary solidification morphology is retained, either dendritic for larger particles or dendritic seaweed for smaller particles.
DOI: 10.1007/s11661-017-4290-8
ÓThe Author(s) 2017. This article is an open access publication
I. INTRODUCTION
S
PONTANEOUS grain refinement (SGR) is defined as an abrupt reduction in grain size during the solidi-fication of deeply undercooled metallic melts. In pure metals, it is observed above a critical undercooling,DT*.[1–3]Alloys, however, often display a more complex behavior, involving two grain refinement transitions,[4–6] with SGR being observed for undercoolings below a lower critical value, DT
1; and above an upper critical
value, DT
2: Moreover, a discontinuous break in the
gradient of the velocity-undercooling curve (see e.g., Reference 7) is typically observed at DT* (or DT2in alloys systems). Below DT*, the growth velocity, v, depends uponDTaccording tovµ(DT)b(typically with
b2 to 3). Conversely, above DT* the dependence is approximately linear.
Since it was first observed in pure Ni by Walker in 1959,[8]the origin of the phenomenon has been a subject of some controversy. Early models included shrinkage induced cavitation resulting in copious nucleation[8] or the effects of trace solute additions, particularly dis-solved gasses.[9] However, these models have subse-quently been discredited. A number of authors also suggested that recrystallization or recovery may play a role,[10,11] although this was difficult to reconcile with drop-tube studies, wherein it was claimed cooling rates were sufficiently high to suppress recrystallization and recovery, but in which grain refined structures were still observed.[12]
The ‘standard model’ for SGR is of dendritic melting and fragmentation following recalescence.[13] Whether remelting occurs or not is determined by the balance between two time scales; that for the melting of dendrite arms,sm, which in turn is a function of the characteristic length scale for growth, and that for the co-existence of the solid and liquid,ss, which depends primarily on the macroscopic cooling rate. Remelting occurs when
sm<ss. The model is attractive in that it is able to explain why there is one transition in pure metals and two in alloys, this relating to the predicted dependence of the dendrite tip radius, q, upon DT, with alloy systems displaying a local minimum inqat intermediate undercoolings.[14] Despite this, there are a number of limitations in the model, not least that post-recalescence remelting cannot explain a break in the velocity-under-cooling curve, which therefore needs to be ascribed to coincidence.
An alternative model was therefore proposed by Mullis and Cochrane[15] which suggested that SGR was the result of a tip instability in the growing dendrite at high growth velocity, with the instability resulting in a transition in the solidification morphology from den-dritic to denden-dritic ‘seaweed’. Subsequent remelting of the seaweed structure[16] gave rise to the grain refined microstructure. Such ‘seaweed’ structures, and related morphologies such as doublons, resulting from the growth of unstable dendrites, are common in low entropy melts far from equilibrium and have been observed in both metals[17,18] and transparent analog casting systems.[19,20] As ‘seaweed’ structures lack the strong directionality of dendrites it is thought that such structures occur at high undercooling due to a reduction in the effective anisotropy with increasing growth velocity, possibly due to a competition between differ-ently directed capillary and kinetic anisotropies.[21]The link between ‘seaweed’ and SGR is supported by observations in deeply undercooled, ultra-pure Cu[22]
NAFISUL HAQUE, ROBERT F. COCHRANE, and ANDREW M. MULLIS are with the School of Chemical & Process Engineering, University of Leeds, Leeds LS2 9JT, U.K. Contact e-mail: pmnh@leeds.ac.uk
wherein just such a switch in growth morphology was found to be co-incident with a break in the velocity-undercooling curve, in this system at DT= 280 K (280 °C). Frozen in seaweed structures were observed over a narrow range of undercoolings>280 K (280°C), with grain refinement by recrystallization being observed forDT>310 K (310°C).
The controversy over the SGR mechanism may result from there actually being more than one mechanism operating. In dilute Cu-Ni alloys, Castle et al.[23,24] identified that three separate grain refinement mecha-nisms were operating; recrystallization, which was observed only at the low undercooling transition, dendritic fragmentation, which could occur at either low or high undercooling and dendritic seaweed frag-mentation, which occurred only at high undercooling. Moreover, for dendritic fragmentation to occur at high undercooling, it appeared that a switch in the growth direction from h100itoh111iwas also required.
In this paper, we present an investigation into spontaneous grain refinement in the congruently melting intermetallic Ni3Ge. Rapid solidification of Ni3Ge has
previously been studied by Ahmad et al.[25] in deeply undercooled samples and by Haque et al.[26] in rapidly cooled samples. Ahmadet al. observed only single phase
b-Ni3Ge at all undercoolings, up to the maximum
undercooling achieved of 362 K (362 °C), wherein the measured growth velocity was 3.55 m s1. They also observed a discontinuity in the velocity-undercooling curve which they associated with the transition from growth of the ordered phase at low undercooling to growth of the disordered form at high undercooling. This condition was observed at an undercooling of
DT= 168 K (168°C) and at a critical growth velocity,
Vc, of 0.22 m s1.[25]During rapid cooling Haqueet al. observed a wide range of solidification morphologies as the cooling rate was increased, including (in order of increasing cooling rate) spherulites, dendrites, and dendritic seaweed. In each case, the observed structures (spherulites, dendrites etc.) were composed of the partially (in the case of spherulites) or fully (in the case of dendrites and seaweed) disordered material, embed-ded within a matrix of fully ordered material. There was also a clear tendency for the proportion of disordered material to increase with increasing cooling rate.
Reports of SGR in intermetallics are rare. In a study of electromagnetically levitated Fe-18 at. pct Ge, Biswas
et al.[27] observed SGR in the ordered B2 intermetallic phase at an undercooling of DT= 140 K (140°C). Based on the observation of the predominance of low angle grain boundaries, small sub-grains contained within larger grains and the presence of curved grain boundaries, they ascribed the observed SGR to recovery and recrystallization in the solid-state. Simultaneous growth velocity measurements indicated a rapid rise in growth velocity aboveDT= 120 K (120°C), consistent with a transition from solidification of the ordered phase below DT= 120 K (120°C) to that of the disordered phase above DT= 120 K (120°C). Their data is therefore consistent with the onset of recovery and recrystallization at an undercooling only marginally
above that required for the transition from ordered to disordered growth of the solid.
Biswas et al.[28] subsequently also investigated the Fe-25 at. pct Ge alloy using a similar methodology, wherein direct access to the single phase e-Fe3Ge
compound should have been possible for undercoolings in excess of 110 K (110°C). However, it was claimed that the primary phase to nucleate was a-Fe, with subsequent solid-state transformation to e, with some
e-b eutectic also being present. No indication of SGR was reported. The behavior of Fe-25 at. pct Ge is therefore more similar to that of Ni-25 at. pct Si reported by References 29 and 30 than to the current Ni-25 at. pct Ge alloy.
As far as we are aware, this is the first report of SGR in a congruently melting compound which, free from solute partitioning and diffusion effects, will behave much more like a pure metal than an alloy.
II. EXPERIMENTAL METHODS
The congruently melting b-Ni3Ge compound exists
over the homogeneity range of 22.5 to 25 at. pct Ge and has the ordered fcc L12 structure.[31] Single phase b-Ni3Ge was produced by arc-melting Ni and Ge
together under a protective Ar atmosphere. The phase composition of the subsequent ingot was confirmed by XRD using a PANalytical Xpert Pro. Only when the material was confirmed as single phase was rapid solidification processing undertaken.
Rapid solidification was affected using a 6.5 m drop-tube maintained at 50 kPa with a high purity inert atmosphere. The alloy sample, of approximately 9.5 g mass, was loaded into an alumina crucible with three, 300lm, laser drilled holes in the base. Melting of the sample was by means of induction heating, with a graphite susceptor being used for efficient RF coupling. The melt was ejected at 1480 K (1207°C) [correspond-ing to 75 K (75°C) superheat] by pressurizing the crucible to 400 kPa. Further details of the drop-tube method are given in Reference32. The resulting powder was sieved into standard size fractions between 800 and 38lm diameter, with the 75 to 53lm sample being the one that is of interest here.
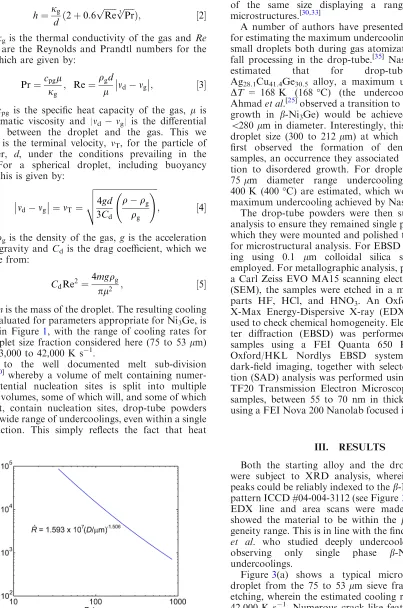
As during free fall in the drop-tube temperature determination for individual droplets is not possible, neither the cooling rate, nor the undercooling, can be determined directly. The cooling rate can be estimated, as a function of droplet size, based on the balance of heat fluxes,[32]whereby:
dTd
dt clð1fÞ þcsfL
df
dt
¼6h
qdðTdTgÞ þ
6erb
qd ðT
4 dT4gÞ;
½1
Stefan–Boltzmann constant and Tg the temperature of the gas. The heat transfer coefficient, h, is normally estimated from:
h¼jg
d ð2þ0:6
ffiffiffiffiffiffi Re p ffiffiffiffiffi Pr 3 p
Þ; ½2
where jgis the thermal conductivity of the gas and Re
and Pr are the Reynolds and Prandtl numbers for the flow, which are given by:
Pr¼cpgl
jg ; Re¼ qgd
l vdmg
; ½3
where cpg is the specific heat capacity of the gas, l is its kinematic viscosity and |mdmg| is the differential velocity between the droplet and the gas. This we assume is the terminal velocity, mT, for the particle of diameter, d, under the conditions prevailing in the tube. For a spherical droplet, including buoyancy effects this is given by:
vdmg
¼mT¼
ffiffiffiffiffiffiffiffiffiffiffiffiffiffiffiffiffiffiffiffiffiffiffiffiffiffiffiffiffiffi 4gd
3Cd
qqg qg
! v
u u
t ; ½4
where qgis the density of the gas, g is the acceleration due to gravity andCd is the drag coefficient, which we estimate from:
CdRe2¼
4mgqg
pl2 ; ½5
wheremis the mass of the droplet. The resulting cooling rate, evaluated for parameters appropriate for Ni3Ge, is
shown in Figure 1, with the range of cooling rates for the droplet size fraction considered here (75 to 53lm) being 23,000 to 42,000 K s1.
Due to the well documented melt sub-division effect,[30] whereby a volume of melt containing numer-ous potential nucleation sites is split into multiple smaller volumes, some of which will, and some of which will not, contain nucleation sites, drop-tube powders show a wide range of undercoolings, even within a single size fraction. This simply reflects the fact that heat
transfer is deterministic while nucleation is stochastic. For systems in which undercooling is the main determi-nant of microstructure, this results in drop-tube powders of the same size displaying a range of potential microstructures.[30,33]
A number of authors have presented methodologies for estimating the maximum undercooling achievable by small droplets both during gas atomization[34]and free fall processing in the drop-tube.[35] Nash and Nash[35] estimated that for drop-tube processed Ag28.1Cu41.4Ge30.5 alloy, a maximum undercooling of DT= 168 K (168°C) (the undercooling at which Ahmadet al.[25]observed a transition to fully disordered growth in b-Ni3Ge) would be achieved for droplets
<280 lm in diameter. Interestingly, this is close to the droplet size (300 to 212lm) at which Haque et al.[26]
first observed the formation of dendrites in their samples, an occurrence they associated with the transi-tion to disordered growth. For droplets in the 53 to 75lm diameter range undercoolings approaching 400 K (400°C) are estimated, which would exceed the maximum undercooling achieved by Nash and Nash.[35] The drop-tube powders were then subject to XRD analysis to ensure they remained single phase, following which they were mounted and polished to a 1lm finish for microstructural analysis. For EBSD analysis polish-ing uspolish-ing 0.1 lm colloidal silica suspension was employed. For metallographic analysis, performed using a Carl Zeiss EVO MA15 scanning electron microscope (SEM), the samples were etched in a mixture of equal parts HF, HCl, and HNO3. An Oxford Instrument
X-Max Energy-Dispersive X-ray (EDX) detector was used to check chemical homogeneity. Electron backscat-ter diffraction (EBSD) was performed on unetched samples using a FEI Quanta 650 FEGSEM with Oxford/HKL Nordlys EBSD system. Bright- and dark-field imaging, together with selected area diffrac-tion (SAD) analysis was performed using a FEI Tecnai TF20 Transmission Electron Microscope (TEM) with samples, between 55 to 70 nm in thickness, being cut using a FEI Nova 200 Nanolab focused ion beam (FIB).
III. RESULTS
Both the starting alloy and the drop-tube powder were subject to XRD analysis, wherein for both all peaks could be reliably indexed to theb-Ni3Ge reference
pattern ICCD #04-004-3112 (see Figure2). A number of EDX line and area scans were made, all of which showed the material to be within the b-Ni3Ge
homo-geneity range. This is in line with the findings of Ahmad
et al. who studied deeply undercooled b-Ni3Ge,[25]
observing only single phase b-Ni3Ge at all
undercoolings.
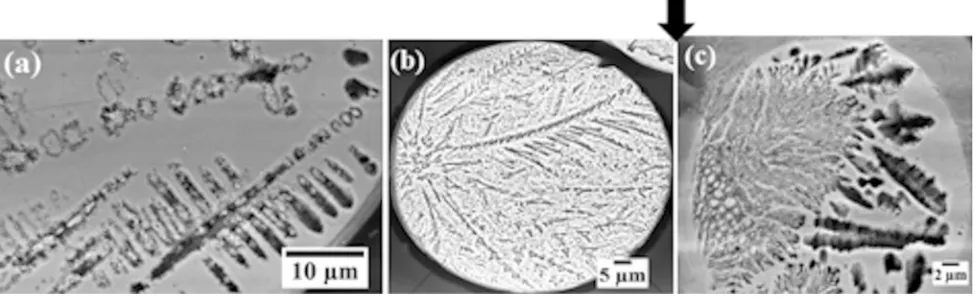
Figure3(a) shows a typical microstructure in a droplet from the 75 to 53lm sieve fraction following etching, wherein the estimated cooling rate is 23,000 to 42,000 K s1. Numerous crack-like features are appar-ent, although no such features may be observed prior to etching, so that despite their appearance the features are not therefore cracks. It has been shown previously[26]
Fig. 1—Estimated cooling rate of droplets cooled in N2 as a
[image:3.594.98.501.68.676.2]that the etchant used here preferentially attacks the disordered (fcc) form of b-Ni3Ge, leaving the ordered
L12 variant intact. Indeed, given the single phase,
chemically homogeneous nature of the material it is difficult to conceive what else could be giving contrast during etching. However, the ‘crack-like’ features do not appear to have any clear relationship with the underly-ing grain structure, as revealed by the EBSD band contrast image given in Figure3(b). This shows a highly refined structure comprising numerous small (<1lm) grains, interspersed with a much smaller number of larger (2 to 10lm) grains. In contrast, droplets from both smaller and larger size fractions contain only a few grains, indeed many contain only a single grain with solidification microstructures that are continuous across the whole droplet.
How this grain refined microstructure fits into the overall solidification sequence as a function of cooling rate is shown in Figures4(a) through (c) where primary solidification morphologies are those given by Haque
[image:4.594.33.262.33.218.2]et al.[36]In the two immediately larger size fractions (a: 150 to 106lm, 8000 to 13,000 K s1; b: 106 to 75lm, 13,000 to 23,000 K s1) we see dendritic growth, as would be
Fig. 2—X-ray diffraction analysis of as cast (arc melted) sample prior to drop-tube process (black) and rapidly solidified sample (drop-tube processed) powder in the 75 to 53lm size range (blue), respectively. Vertical black lines indicate peak positions for the
b-Ni3Ge reference pattern (Color figure online).
Fig. 3—(a) SEM micrograph of HF etchedb-Ni3Ge drop-tube particles from the 75 to 53lm size fraction showing crack-like relief and (b)
EBSD band contrast image of unetchedb-Ni3Ge drop-tube particles from the 75 to 53lm size fraction showing highly grain refined structure.
[image:4.594.87.478.309.468.2] [image:4.594.36.524.527.678.2]Fig. 5—(a) Histogram of grain orientation in drop-tube processedb-Ni3Ge particles from the 75 to 53lm size fraction showing predominance
of low angle grain boundaries (<10 deg) and (b) shows grain orientation in particles from 106 to 75lm size fraction showing a the distribution typical of random grain nucleation.
Fig. 6—(a,c) shows EBSD results of grain orientation spread (GOS) map of etchedb-Ni3Ge drop-tube particles from the 75 to 53lm size and 106
[image:5.594.77.561.39.249.2] [image:5.594.124.510.302.668.2]expected of a metallic melt. Dendrites in the smaller of these size fractions display non-orthogonal side-branch-ing, indicative of a change in growth direction. Con-versely, in the immediately smaller size fraction (c: 53 to 38lm, 42,000 to 62,000 K s1) we see the clear develop-ment of dendritic seaweed, a morphology observed only at very large departures from equilibrium.[22,23]
The histogram of grain orientations for the material in the 75 to 53 lm sieve fraction is shown in Figure5(a), from which it is clear that the majority of grain boundary misorientations are either<10 deg or close to 60 deg. This is not the distribution that would be expected due to randomly nucleated grains.[37] The appearance of the microstructure, with its highly inho-mogeneous distribution of grain sizes and the predom-inance of low angle grain boundaries is highly suggestive of grain refinement by recrystallization and recovery. For comparison, the distribution of grain orientations for the sample in the immediately large sieve fraction (106 to 75lm, 13,000 to 23,000 K s1), corresponding to the deformed dendritic structures (Figure 4(b)) is shown in Figure5(b), wherein the distribution looks much closer to that expected for a random population of grains.[37]
The corresponding grain orientation spread (GOS) data for the two samples is shown in Figures6(a) through (d). The much higher GOS observed for the 75 to 53 lm sample (Figures6(a) and (b)), compared to that for the 106 to 75 lm sample, is indicative of a much higher density dislocations in the faster cooling powders, indicating a potential driving force for recrystallization and recovery. By comparing Figures 3(b) and 6(a) we note that the regions of low GOS within the 75 to 53 lm sample correspond to regions of small grain size (in particular, regions near the center of the bottom edge and towards the top of the right-hand edge of the micrographs), indicating recrystallization in these areas. In contrast, regions of high GOS can clearly be correlated with large grains, wherein we surmise that the local driving force has not yet reached the required level for recrystallization and recovery in these grains. It is also clear that within the 106 to 75lm sample the small GOS indicates insufficient driving force for recrys-tallization and recovery.
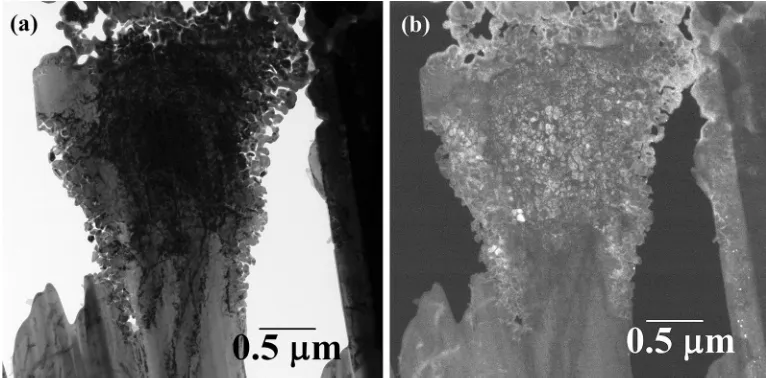
Finally, we consider what process may have given rise to the unusual ‘crack-like’ morphology seen here after etching. It has previously been established[26] that etching in this material distinguishes between the ordered and disordered material. A selected area diffraction pattern (Figure7) confirms that the large blocky areas between the ‘cracks’ are indeed of the L12
ordered structure. This is evident from the super-lattice spots visible in Figure7.
A high resolution TEM image of the structure of one of these blocky regions is given in Figure8(a) (bright-field) with the corresponding dark-field image given in Figure 8(b). The dark-field image was obtained from the super-lattice spot indicated by the arrow in Figure 7and therefore shows ordered material as light.
We also note that the area susceptible to etching appears greater in both the seaweed and dendritic morphologies than is the case in the ‘crack-like’
structure. We therefore conjecture that the ‘crack-like’ structures are areas of residual disordered material, between regions that have undergone reordering during the recrystallization.
IV. DISCUSSION
Microstructural and EBSD data we believe provides compelling evidence of spontaneous grain refinement by recrystallization and recovery within a narrow size range of drop-tube processed, single phase b-Ni3Ge powders
spanning the range of cooling rates 23,000 to 42,000 K s1. These results, and how they fit into the larger solidification sequence for this material, throw new light onto the phenomenon of spontaneous grain refinement. Firstly, it has previously been assumed[12] that very high cooling rates could suppress SGR by recrystallization, although here we see exactly that mechanism operating at estimated cooling rates up to 42,000 K s1. This would indicate that the cooling rate required to suppress recrystallization is material depen-dent and that it is unsafe to assume recrystallization has been suppressed by imposing a high cooling rate unless this is supported by independent evidence. In the case of Ni3Ge, it appears that recrystallization is not suppressed
[image:6.594.292.529.37.268.2]until the cooling rate exceeds 42,000 K s1, wherein the observed primary solidification morphology is dendritic seaweed. Secondly, we note that[23] observed recrystal-lization grain refinement at low undercooling while in contrast[22]observed it at high undercooling but only at undercoolings higher than those required for the trans-formation to seaweed morphologies. In contrast, in this study we observe recrystallization grain refinement at
Fig. 7—TEM SAD pattern from a droplet in the 75 to 53lm sieve fraction, taken from the large blocky areas between the cracks-like features. The presence of super-lattice spots indicate the chemically ordered L12 structure. Arrow shows the specification of the spot
lower undercoolings than the transformation to den-dritic seaweed. Equally, with regard to the past work on SGR by recrystallization and recovery in ordered intermetallics, Biswas et al.[27] observed that recrystal-lization occurred at an undercooling only marginally above that required for the solid to grow in the disordered form. Conversely, although in drop-tube processed samples direct determination of the droplet undercooling prior to nucleation is not possible, the likely undercooling in the 75 to 53lm sample is significantly in excess of that required for growth of the disordered solid, the onset of which appears to occur in the 300 to 212lm size fraction.
Consequently, recrystallization grain refinement appears to be able to be superimposed upon the underlying solidification morphology at almost any undercooling and independent of the underlying mor-phology. Moreover, it may be difficult to inhibit the recrystallization process, even at very high cooling rates. In intermetallics, recrystallization appears only to pro-ceed once growth is sufficiently fast that ordering is lost, although again it appears system dependent as to whether recrystallization occurs close to the order-dis-order transition temperature or significantly above it.
ACKNOWLEDGMENTS
Nafisul Haque is thankful to the Higher Education Commission (HEC) Pakistan and NED University of Engineering and Technology for financial support.
OPEN ACCESS
This article is distributed under the terms of the Creative Commons Attribution 4.0 International License (http://creativecommons.org/licenses/by/4.0/),
which permits unrestricted use, distribution, and re-production in any medium, provided you give appro-priate credit to the original author(s) and the source, provide a link to the Creative Commons license, and indicate if changes were made.
REFERENCES
1. S.E. Battersby, R.F. Cochrane, and A.M. Mullis:J. Mater. Sci., 1999, vol. 34, p. 2049.
2. K.I. Dragnevski, R.F. Cochrane, and A.M. Mullis:Mater. Sci. Eng. A, 2004, vol. 375, p. 479.
3. D. Li, K. Eckler, and D. Herlach:J. Cryst. Growth, 1996, vol. 160, p. 59.
4. D. Li, K. Eckler, and D. Herlach:Acta Mater., 1996, vol. 44, p. 2437.
5. J. Li, W. Jie, G. Yang, and Y. Zhou:Acta Mater., 2002, vol. 50, p. 1797.
6. R.F. Cochrane, S.E. Battersby, and A.M. Mullis:Mater. Sci. Eng. A, 2001, vol. 304, p. 262.
7. R. Wilnecker, D.M. Herlach, and B. Feuerbacher: Phys. Rev. Lett., 1989, vol. 62, p. 2707.
8. J. Walker:The Physical Chemistry of Process Metallurgy, Part 2, G.R. St Piere, ed., Interscience. New York, 1959.
9. B. Jones and G. Weston: The structural features of undercooled nickel and nickel-oxygen alloys. DTIC Document, 1970. 10. R.T. Southin and G.M. Weston:J. Aust. Inst. Met., 1973, vol. 18,
p. 74.
11. G. Powell and L. Hogan:Trans. Met. Soc. AIME, 1969, vol. 245, p. 407.
12. R.F. Cochrane and D.M. Herlach: Oxford. B H Kaldeich:147. 13. M. Schwarz, A. Karma, K. Eckler, and D.M. Herlach:Phys. Rev.
Lett., 1994, vol. 73, p. 1380.
14. J. Lipton, W. Kurz, and R. Trivedi:Acta Metall., 1987, vol. 35, p. 965.
15. A.M. Mullis and R.F. Cochrane:J. Appl. Phys., 1997, vol. 82, p. 3783.
16. A.M. Mullis and R.F. Cochrane: Acta Mater., 2001, vol. 49, p. 2205.
17. T. Ihle and H. Mu¨ller-Krumbhaar:Phys. Rev. Lett., 1993, vol. 70, p. 3083.
18. Y. Sawada:Physica A, 1986, vol. 140, p. 134.
19. S. Akamatsu, G. Faivre, and T. Ihle:Phys. Rev. E, 1995, vol. 51, p. 4751.
[image:7.594.124.507.36.225.2]20. I. Stalder and J. Bilgram:Europhys. Lett., 2001, vol. 56, p. 829. 21. A.M. Mullis, K.I. Dragnevski, and R.F. Cochrane: Mater. Sci.
Eng. A, 2004, vol. 375, p. 157.
22. K.I. Dragnevski, R.F. Cochrane, and A.M. Mullis: Phys. Rev. Lett., 2002, vol. 89, p. 215502.
23. E.G. Castle, A.M. Mullis, and R.F. Cochrane:Acta Mater., 2014, vol. 66, p. 378.
24. E.G. Castle, A.M. Mullis, and R.F. Cochrane:Acta Mater., 2014, vol. 77, p. 76.
25. R. Ahmad, R. Cochrane, and A. Mullis: J. Mater. Sci., 2012, vol. 47, p. 2411.
26. N. Haque, R.F. Cochrane, and A.M. Mullis:Intermetallics, 2016, vol. 76, p. 70.
27. K. Biswas, G. Phanikumar, D. Holland-Moritz, D.M. Herlach, and K. Chattopadhyay:Philos. Mag., 2007, vol. 87, p. 3817. 28. K. Biswas, G. Phanikumar, K. Chattopadhyay, T. Volkmann, O.
Funke, D. Holland-Moritz, and D. Herlach:Mater. Sci. Eng. A, 2004, vol. 375, p. 464.
29. R. Ahmad, R.F. Cochrane, and A.M. Mullis:Intermetallics, 2012, vol. 22, p. 55.
30. L. Cao, R.F. Cochrane, and A.M. Mullis:Metall. Mater. Trans. A, 2015, vol. 46A, p. 4705.
31. A. Nash and P. Nash:Binary Alloy Phase Diagrams, US National Bureau of Standards Monograph Series 25, vol. 13, ASM, Else-vier, Ohio, 1976, p. 35.
32. O. Oloyede, T.D. Bigg, R.F. Cochrane, and A.M. Mullis:Mater. Sci. Eng. A, 2016, vol. 654, p. 143.
33. L. Cao, R.F. Cochrane, and A.M. Mullis: Intermetallics, 2015, vol. 60, p. 33.
34. M. Libera, G. Olson, and S. Vander:Mater. Sci. Eng. A, 1991, vol. 132, p. 107.
35. N. Wang and B. Wei: Chin. Phys. Lett., 2004, vol. 21, p. 1120.
36. N. Haque, R.F. Cochrane, and A.M. Mullis:J. Alloys Compd., 2016, vol. 707, pp. 327–31.