Int. J. Electrochem. Sci., 9 (2014) 139 - 147
International Journal of
ELECTROCHEMICAL
SCIENCE
www.electrochemsci.orgVoltammetric and LC-MS/MS Method for the Determination of
Triclosan – A Comparative Study, Validation and Simultaneous
Application
Hana Dejmkova1,*, Jiri Kwiecien2, Karel Cizek2, Jiri Cermak2, Edita Vranova1, Petra Mala1, Jiri Zima1, Jiri Barek1
1
Charles University in Prague, Faculty of Science, University Research Centre „Supramolecular Chemistry“, Department of Analytical Chemistry, UNESCO Laboratory of Environmental Electrochemistry, Albertov 6, CZ-128 43 Prague 2, Czech Republic
2
Výzkumný ústav organických syntéz (Research Institute for Organic Syntheses), CZ 533 54 Rybitvi 296, Czech Republic
*
E-mail: [email protected]
Received: 1 October 2013 / Accepted: 24 October 2013 / Published: 15 November 2013
In this paper, two determination methods of polychlorinated diphenylether triclosan (5-chloro-2-(2,4-dichlorophenoxy)phenol), an antibacterial and antifungal agent, are developed, compared and used in concordance. The first one, differential pulse voltammetry (DPV) on carbon paste electrode (CPE), is simple, fast, portable and inexpensive and therefore suitable for field measurements, large scale monitoring and screening purposes. The other one, liquid chromatography with MS/MS detection, is much more sophisticated, selective, accurate and sensitive (unfortunately much more expensive as well) and can serve for more reliable determination of triclosan in samples selected as suspicious during the screening measurements. Optimum conditions for both the determinations are described and validation parameters in matrices of drinking and river water are given.
Keywords: differential pulse voltammetry; multiple reaction monitoring; pesticide; carbon paste electrode, triclosan.
1. INTRODUCTION
triclosan, a combination of both approaches can be considered. One is based on voltammetric determination which is inexpensive and sensitive enough to detect submicromolar concentrations of triclosan. If there is no voltammetric signal in the tested sample but a discernible signal after the standard addition of triclosan corresponding to determination limit, it can be concluded that triclosan is not presented at the concentration level equal or higher than determination limit of the used voltammetric method. However, if we observe a voltammetric signal at potential corresponding to triclosan, we must use more powerful (and more demanding and more expensive) liquid chromatography/mass spectrometry (LC-MS) method for a definitive proof of its presence in the sample. The same situation occurs in the case that voltammetric method is not sensitive enough from health-safety or legal point of view. In this work, we are trying to show such synergism on the combination of screening voltammetric method and LC-MS/MS method for the determination of triclosan in drinking and surface water.
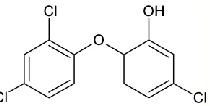
[image:2.596.248.353.542.595.2]Polychlorinated diphenylether triclosan (5-chloro-2-(2,4-dichlorophenoxy)phenol, see Figure 1) is an antibacterial and antifungal agent, used as disinfectant in a wide variety of applications, e.g. in personal care products, medicine, and packaging material [1,2]. Due to the vast applied amounts, its release in the environment, particularly through wastewaters, is considerable. Microbial degradation results in the formation of chlorophenols and dioxins [3,4]. Similar products can also result from the reaction with chlorine during water treatment [5]. Biodegradation products might have carcinogenic activity, they can act as endocrine disruptors, and cause allergic reactions. Triclosan has also a highly negative impact on the aqueous environment [6]. Its occurrence is limited in cosmetics to 0.3 % and dangerous level for aquatic fauna is ca. 0.2 mg/L [3]. The acceptable level for the presence of triclosan in drinking water is derived from the concentration related to no observed adverse effect level (NOAEL) of triclosan and it can reach several milligrams per liter [7]. In some particular cases, much lower concentrations can be harmful mainly for seawater organisms. The predicted no effect concentration (PNEC) of triclosan for freshwater is 0.07 μg/L and for sediment is 1 mg/kg. Triclosan is highly toxic in the marine environment [8], its PNEC is even 10 times lower than for freshwater, i.e. 6.9 ng/L.
Figure 1. Structural formula of triclosan.
However, the most useful feature of this electrode is the quick and easy renewal of the electrode surface. This feature successfully eliminates problems with the passivation of the electrode surface, connected mostly with the electrode reactions involving polymeric products, which is the typical behavior of oxidizable phenols and aromatic amines [13].
The most sensitive liquid chromatography/mass spectrometry (LC-MS) screening or quantitation techniques are those based on triple quadrupole (QQQ) LC-MS/MS instruments, where the second stage of MS (post-fragmentation from a collision cell) acts as an effective method of background chemical noise elimination that is not associated with the target precursor and fragment ions. This technique is commonly referred as Multiple Reaction Monitoring (MRM). Method of triclosan determination has an excellent selectivity for the analyte without complicated sample preparation [14, 15]. If the matrix is not too complex, the method can reach limits of detection in tens or hundreds of nanograms per liter without complicated sample preparation or pretreatment, such as preconcentration and purification. On the other hand, full cost on one analysis is much higher in comparison with the electrochemical method and the device must be installed in a clean environment of the laboratory, which understandably prevents it use for field measurements.
2. EXPERIMENTAL SECTION
2.1. Chemicals
Stock solution of triclosan (99.5 %, Dr. Ehrenstorfer) with concentration 300 ppm was prepared in methanol (LC-MS Chromasolv, Fluka). Phosphoric acid, acetic acid, boric acid, sodium hydroxide, and disodium hydrogen phosphate (all Lach-Ner, Czech Republic) served for the preparation of supporting electrolytes; formic acid (for mass spectrometry, Fluka), ammonium formate (p.a., Fluka), and methanol were used for the preparation of the mobile phase for chromatographic measurements. For the preparation of carbon paste, 250 mg of glassy carbon microparticles (diameter 0.4 –
prepared by reverse osmosis in apparatus Iwa30iol, Watek (output 18.2 MΩ).
2.2. Apparatus
Voltammetric measurements were performed on PalmSens portable potentiostat (PalmSens, Netherlands) with three-electrode arrangement, consisting of working carbon paste electrode (CPE), platinum auxiliary electrode and Ag/AgCl (3M KCl) reference electrode. Two types of CPE were employed: conventional-size CPE with Teflon body and stainless-steel piston (diameter of the working area 2 mm) and miniaturized version containing carbon paste in Teflon capillary of 0.5 mm diameter. DP voltammograms were measured using scan rate 20 mV/s, pulse amplitude 50 mV, and pulse duration 100 ms.
Agilent 6490 Triple Quadrupole MS. Column Zorbax Eclipse XDB-C8, Rapid resolution 4,6 × 50 mm, 3,5 µm was used for the separation.
2.3. Samples
Model samples were prepared from drinking tap water (Department of Analytical Chemistry, Hlavova 8, Prague) and river water (Vltava river, Vyton, Prague). Brief characterization of above aqueous samples is shown in Table 1. The content of ions which may have a significant influence to measured signal is especially important for LC-MS/MS measurements.
Table 1. Characterization of tested matrices
Sample Ca content
(mg/L)
Mg content (mg/L)
DOC a (mg/L)
σ b (mS/m)
pH
Deionized water 0.92 0.14 4.49 2.3 5.87 Drinking water 57.7 6.8 4.22 43.1 7.65 River water 24.9 6.85 15.5 30.0 7.40
a
Dissolved Organic Carbon; b electrical conductivity
2.4. Procedures
For DPV determination at CPE, 1 mL of 0.05M phosphate buffer pH 11 was added to 9 mL of spiked sample. The surface of carbon paste electrode was renewed for each measurement; from piston-driven CPE, ca 0.1 mm of paste was pressed out and wiped by wet filtration paper; capillary electrode was renewed by cutting off a thin slice of the capillary at its end.
Mobile phase for chromatographic measurement consisted of ultrapure water (A) and methanol (B). Gradient was as follows: 0 min 10% B, 1 min 10% B, 4 min 95% B, 8 min 95% B, 8.1 min 10% B, 10 min 10%B and stop time was 12 min. The flow rate of mobile phase was kept at 0.6 mL/min, the column Zorbax XDB-C8 4.6 × 50 mm, 3.5 μm was thermostated at 40 ºC and the injection volume was 10 L in all experiments. The measurement of mass spectra was performed in negative-ion mode with an electrospray ion source (ESI). The ion source temperature was set to 150 °C (0-350 °C), nebulizer was set to 55 psi (0-60 psi), the capillary voltage was 2500 V (0-6000 V), the needle voltage 2000 V (0-2000 V), gas flow 12 L/min (11-20 L/min), and the sheath gas temperature was optimized to 350 °C (0-400 °C), and sheath gas flow was set to 11 L/min (2-12 L/min).
Calibration dependences were evaluated by least squares linear regression method. The quantification limits (LOQ) were calculated as the concentration of the analyte which gave a signal ten times the standard deviation of the lowest evaluable concentration.
3. RESULTS AND DISCUSSION
3.1. Optimization of voltammetric determination
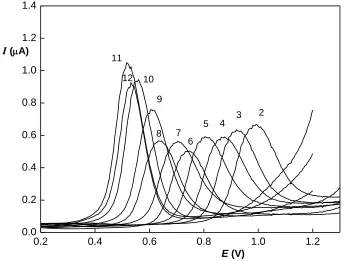
Two sections can be found in this range; under pH 8, i.e. in the range below pK of triclosan, the peak height is stable, while above pH 8 where triclosan is dissociated, peak height is rising with increasing pH, reaching its maximum at pH 11. The peak potential shifts in the whole potential range according to the equation Ep (mV)= – 53.4 pH + 1087 (R2 = 0,9892). For further determinations, pH 11 was
employed, but B-R buffer was replaced by less complex phosphate buffer of this pH.
Consecutive scans performed on the same electrode surface showed strong passivation properties of triclosan, as the peak height decreased to only 1 % of the original value after 15 scans , which is connected to the polymeric products of the electrode reaction, as mentioned previously. Similar behavior was observed also during voltammetric determination on other electrodes [16, 17].. Renewal of the electrode surface is therefore necessary after each measurement.
In our experience, electrodes of smaller dimensions can provide lower background current and lower noise and hence allow reaching lower detection limits. Therefore, while optimization measurements were performed using conventional-sized CPE, the validation procedure used a miniaturized version of CPE besides.
Figure 2. 1 DP voltammograms of triclosan (30 ppm) in B-R buffer of various pH (the pH value is marked above the curve).
3.2. Optimization of LC-MS/MS determination
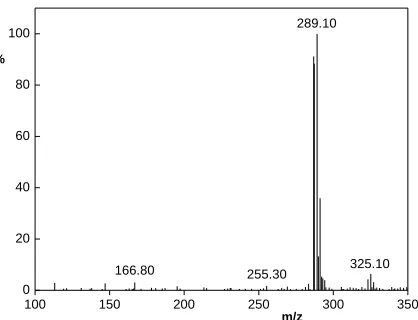
The most abundant ion (m/z 287, [M-H]-) in the negative ESI mass spectrum of triclosan has isotopic distribution typical for presence of three Cl atoms in molecular structure (see Figure 3).
0.2 0.4 0.6 0.8 1.0 1.2
0.0 0.2 0.4 0.6 0.8 1.0 1.2 1.4
7
2 3 4 5 6 8 9 10 12 11 I (A)
[image:5.596.127.472.330.591.2]
100 150 200 250 300 350
0 20 40 60 80 100
325.10 255.30
289.10
166.80 %
m/z
[image:6.596.195.404.79.239.2]
Figure 3. Mass spectrum of triclosan, injected 0.1 μL, concentration 11 ppm, negative mode.
The MassHunter Optimizer software gave optimal collision energy for the MRM transition 287→35 in negative mode equal to 10 V. The other parameters of the ion source are mentioned in the Procedure section.
3.3. Concentration dependences
Ionization efficiency in MS detection may be strongly dependent on the type of matrix and substances dissolved resulting in the matrix effect. In a lesser extent, also the electrode response might be influenced by the matrix. To examine this influence, concentration dependences were measured in the pure solvents and in two triclosan-free matrices, namely in drinking water and river water in the concentration range from 2000 ppb to the determination limit in the case of voltammetric determination and from 10 ppb to 0.1 ppb in case of mass spectrometric determination (Figure 4).
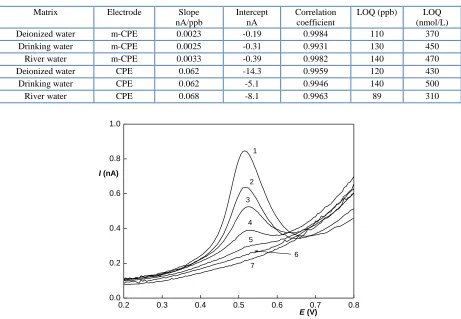
It can be seen that although the DPV dependences are linear, they have a rather high negative intercept. The reason for this is the shape of the voltammogram baseline, which is not sufficiently linear in the peak potential region, and this non-linearity causes the error in the evaluation. Nevertheless, this problem can be overcome by the subtraction of the blank evaluation. Miniaturized electrode shows better results than the conventional one, but not good enough to avoid the necessity of blank subtraction. The parameters of the obtained dependences are summarized in Table 1; selected obtained voltammograms are shown in Figure 5.
Determination limits (LOQ) of all DPV measurements reach similar values between approximately 90 and 140 ppb (i.e. between 310 and 500 nmol/L).
LOQ value may differ from matrix to matrix even day to day. In the case of determination of triclosan in waters, the long-term LOQ value is approximately 0.3 ppb (i.e. 1 nmol/L).
6.4 6.5 6.6 6.7 6.8 6.9 7.0
0 20 40 60 80 100
%
7 2
3
4
5 6
8 9 1
[image:7.596.179.418.135.312.2]t (min)
[image:7.596.69.530.408.727.2]Figure 4. Responses of triclosan in ultrapure water, MRM technique, concentration 10 (1), 7 (2), 5 (3), 2 (4), 1 (5), 0.7 (6), 0.5 (7), 0.2 (8), and 0.1 (9) ppb.
Table 1. Selected parameters of the DPV concentration dependences of triclosan.
Matrix Electrode Slope
nA/ppb
Intercept nA
Correlation coefficient
LOQ (ppb) LOQ
(nmol/L)
Deionized water m-CPE 0.0023 -0.19 0.9984 110 370
Drinking water m-CPE 0.0025 -0.31 0.9931 130 450
River water m-CPE 0.0033 -0.39 0.9982 140 470
Deionized water CPE 0.062 -14.3 0.9959 120 430
Drinking water CPE 0.062 -5.1 0.9946 140 500
River water CPE 0.068 -8.1 0.9963 89 310
0.2 0.3 0.4 0.5 0.6 0.7 0.8
0.0 0.2 0.4 0.6 0.8 1.0
I (nA)
7 2
3
4
5
6 1
E (V)
[image:8.596.146.448.124.344.2]
3.4. Determination in real matrices
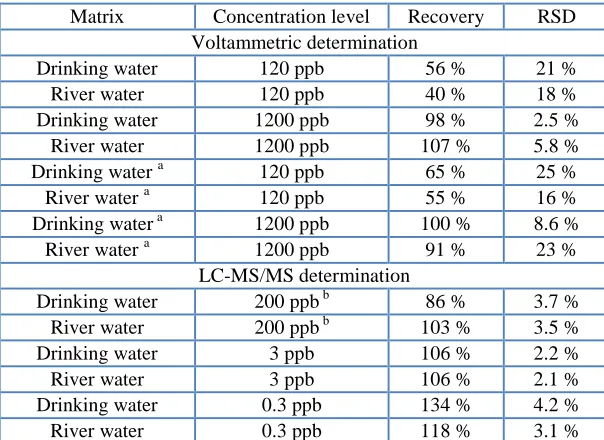
Table 2. Performance parameters of the developed methods on various concentration levels.
Matrix Concentration level Recovery RSD Voltammetric determination
Drinking water 120 ppb 56 % 21 % River water 120 ppb 40 % 18 % Drinking water 1200 ppb 98 % 2.5 % River water 1200 ppb 107 % 5.8 % Drinking water a 120 ppb 65 % 25 % River water a 120 ppb 55 % 16 % Drinking water a 1200 ppb 100 % 8.6 % River water a 1200 ppb 91 % 23 %
LC-MS/MS determination
Drinking water 200 ppb b 86 % 3.7 % River water 200 ppb b 103 % 3.5 % Drinking water 3 ppb 106 % 2.2 % River water 3 ppb 106 % 2.1 % Drinking water 0.3 ppb 134 % 4.2 % River water 0.3 ppb 118 % 3.1 %
a
Measured using miniaturized CPE; b Highly fortified matrix had to be 100times diluted by ultrapure water prior to the analysis.
Three concentration levels were chosen for evaluation of repeatability. The lowest concentration 0.3 ppb for LC-MS/MS determination and 120 ppb for voltammetric determination represented supposed LOQ level. The second sample was prepared at level of 3 ppb for LC-MS/MS determination and 1200 ppb for voltammetric determination, which was supposed to be a value ten times higher than LOQ. The highest level was used for LC-MS/MS determination only and it was represented by a matrix fortified with a standard solution of triclosan at 200 ppb, which is in the range suitable for direct electrochemical analysis. This sample had to be diluted hundred times by ultrapure water before the standard addition followed by LC-MS/MS determination.
Each fortified sample was analyzed five times by the method of standard addition. In the case of voltammetric determination, two 10L additions of 200 ppm methanolic solution of triclosan were made into 10 mL of sample. In the case of LC-MS/MS determination, 50L addition into 950 L of sample was made; the concentration of aqueous spiking solution was 6 ppb and 60.0 ppb of triclosan for supposed low and high concentration of triclosan, respectively. Recovery and repeatability of the determination is summarized in Table 2. It is apparent that the performance of voltammetric method is worse in the lower concentration range, with recovery only about 50 % and high relative standard deviation (RSD); both the precision and trueness improve at higher concentration. The difference between traditional and miniaturized electrodes is small. LC-MS/MS determination provides accurate results in the whole concentration range.
4. CONCLUSIONS
due to the low acute toxicity of triclosan, sufficient for its determination in selected matrices. On the other hand, repeatability and recovery of this method is lower, particularly at concentrations close to LOQ. LOQ of LC-MS/MS method is several orders of magnitude lower and the repeatability is higher. However, the requirements of the instrumentation are higher both in terms of costs and handling. This combination of voltammetric screening method and LC-MS/MS method for accurate determination can be used with advantage.
ACKNOWLEDGEMENTS
This work was financially supported by the Technology Agency of the Czech Republic (project TA01020565), Ministry of Education, Youth and Sports (MSM 0021620857) and by Charles University in Prague (SVV267215).
References
1. A. B. Dann, A. Hontela, J. Appl. Toxicol., 31 (2011) 285.
2. U. S. Enviromental Protection Agency, Triclosan - Occupational and Residential Exposure Assessment, Washington, DC, (2008),
oehha.ca.gov/prop65/public_meetings/052909coms/triclosan/ciba9.pdf (accessed 20.1.2013) 3. H. Winter, S. Miller, C. Tixier, L. Pillonel, Environ. Sci. Technol., 36 (2002) 4998.
4. D. G. Lee, F. Zhao, Y. H. Rezenom, D. H. Russell, K-H. Chu, Water Research, 46 (2012) 4226. 5. K. L. Rule, V. R. Ebbett, P. J. Vikesland, Envirol. Sci. Technol., 39 (2005) 3176.
6. G. Bedoux, B. Roig, O. Thomas, V. Dupot, B. Le Bot, Environ. Sci. Pollut. Res., 19 (2012) 1044. 7. U. S. Enviromental Protection Agency, Reregistration Eligibility Decision for Triclosan
www.epa.gov/oppsrrd1/REDs/2340red.pdf (accessed 20.1.2013)
8. European Chemicals Agency, apps.echa.europa.eu/registered/data/dossiers/DISS-9ea3b5cc-80fb- 15ea-e044-00144f67d031/AGGR-9d720024-d49b-45ad-b86d-68887e0beb02_DISS-9ea3b5cc-80fb-15ea-e044-00144f67d031.html#AGGR-9d720024-d49b-45ad-b86d-68887e0beb02 (accessed 20.1.2013).
9. J. Barek, K. Peckova, V. Vyskocil, Curr. Anal. Chem., 4 (2008)242.
10.I. Svancara, K. Kalcher, A. Walcarius, K. Vytras, Electroanalysis with Carbon Paste Electrodes, CRC Press, Boca Raton (2012).
11.I. Svancara, K. Vytras, J. Barek, J. Zima, Crit. Rev. Anal. Chem., 31 (2001)311. 12.J. Zima, I. Svancara, J. Barek, K. Vytras, Crit. Rev. Anal. Chem., 39 (2009) 204.
13.H. Lund, O. Hammerich, Organic Electrochemistry, 4th ed., Marcel Dekker, New York (2001). 14.W. Hua, E. R. Bennett, R. J. Letcher, Environ. Int. 31 (2005) 621.
15.Y. Yu, Q. Juany, J. Cui, K. Zhang, C. Tang, X. Peng, Anal. Bioanal. Chem. 399 (2011) 891. 16. M. A. Ghanem, R. G. Compton, B. A. Coles, E. Psillakis, M. A. Kulandainathan, F. Marken,
Electrochim. Acta 53 (2007) 1092.