Int. J. Electrochem. Sci., 8 (2013) 8264 - 8271
International Journal of
ELECTROCHEMICAL
SCIENCE
www.electrochemsci.org
Enhanced Electrochemical Properties of Size-Controlled TiO
2Nanowire Electrodes for Lithium-Ion Batteries
Biao Han1,2, Young-Woo Lee1, Si-Jin Kim1, Bo-Mi Hwang1, Seong-Bae Kim1,2, Woo-Seong Kim2, Kyung-Won Park1,*
1
Department of Chemical Engineering, Soongsil University, Seoul 156-743, Republic of Korea 2
Daejung Energy Materials, 740-49, Sinheung-dong, Iksan, Jeonbuk 570-140, Republic of Korea *
E-mail: kwpark@ssu.ac.kr
Received: 12 March 2013 / Accepted: 6 May 2013 / Published: 1 June 2013
Size-controlled single-crystalline TiO2 nanowires (TNW-3, TNW-6, TNW-9, TNW-12, and TNW-24) have been successfully synthesized by hydrothermal process without any surfactant and template as a fucntion of reaction time such as 3, 6, 9, 12, and 24 h, respectively. The single-crystalline TNWs are dominantly exposed to the (110) plane and grown to the one-dimensional structure along the [001] axis exhibiting the single-crystalline nature. The average lengths of the 3, 6, 9, TNW-12, and TNW-24 are ~11.0, ~16.5, ~37.6, ~80.7, and ~129.8 nm, respectively, with almost the same diameter of ~9.0 nm. The 1st capacities of the TNW-3, TNW-6, TNW-9, TNW-12, and TNW-24 are 138.7, 147.2, 163.2, 181.7, and 185.7 mAh g-1, respectively, representing that the capacity of TNWs increases with increasing reation time. At high current rates such as 5, 10, and 20 C, the TNWs can display an excellent high-rate performance. The improved lithium-ion intercalation properties of the TNWs at high current rates may be attributed to relatively improved charge transport in the optimized 1-D nanostructure.
Keywords: Rutile, TiO2, Nanowire, Lithium, Intercalation
1. INTRODUCTION
current rate, and increase interfacial contact area with electrolyte [7,8]. Transition-metal oxides such as TiO2 have been extensively studied as electrode materials for Li-ion batteries because of their high theoretical capacity, safety, low cost, and environmental friendliness [9-11].
One-dimensional (1-D) TiO2 nanomaterials such as nanorods, nanowires, and nanotubes have been investigated in order to achieve LIBs with high energy density, high rate capacity, and long cyclability, because of fast electronic-ionic transport and relaxation of the strain of the electrodes during Li intercalation process [12,13]. Recently, considerable efforts for the synthesis of 1-D nanostructure TiO2 have been made using synthetic methods ranging from vapor-phase techniques to solution-growth processes [14-17]. In particular, in the case of nanobelts or nanotubes, it is well known that various types of TiO2 nanostructures can be synthesized through strong acid treatment under hydrothermal or non-hydrothermal conditions [18-20]. Among the 1-D nanostructures, the nanowire electrode shows particular properties such as rapid electron collection of carriers and charge transport assisted by its one-dimensional structure [21-25]. Although numerous efforts have been made to further increase the surface area of anodic TiO2 nanowires, which is favorable for surface reactions and related applications, few reports of growth mechanism of the TiO2 nanowires have been reported until now.
Herein, we synthesized size-controlled single-crystalline rutile TiO2-NWs (TNWs) for LIBs via hydrothermal process as a function of reaction time. The structural characterization of the TNWs was carried out using high-resolution transmission electron microscopy (HR-TEM) and X-ray diffraction (XRD) analysis. To evaluate the performance for lithium intercalation properties in LIBs, charge-discharge, rate cycling curves, and electrochemical impednace spectroscopy (EIS) of the electrodes were measured using a lithium coin cell.
2. EXPERIMENTAL PART
2.1. Synthesis of TiO2 nanowires
For size-controlled TNWs, 8 mL of titanium(IV) isopropoxide (TTIP (97 wt%), Aldrich) was dropped in 40 mL of 5 M hydrochloric acid (HCl (36 wt%), Aldrich) with constant stirring at 25 oC for 1 h and then kept at 120 oC for different reaction time such as 3, 6, 9, 12, and 24 h. After the hydrothermal process, the resulting precipitates were cooled to 25 oC and washed several times with ethanol and distilled water. The TNW powders were obtained after drying in a 60 oC oven.
2.2 Structural analysis
40 kV and 100 mA. The 2θ angular scan from 20˚ to 60˚ was explored at a scan rate of 5˚ min-1 . The resolution in the scans was kept at 0.02°.
2.3. Preparation of the electrodes
The electrodes were prepared by mixing 70 wt% TNWs as an active material, 20 wt% acetylene black as a conducting agent, and 10 wt% polyvinylidene fluoride (PVDF) as a binder. In order to obtain the slurry, several drops of N-methylpymolidinone were added into the mixture of nanowires with acetylene black and PVDF. The prepared slurry was homogenized by stirring and then coated on 11 µm thick copper foil substrates. The electrode with an area of 1.32 cm2
was dried at 70 oC vacuum oven. The TNW electrodes were evaluated with respect to a lithium foil (FMC Corporation) as a counter electrode. The coin cells were assembled inside an Ar-filled glove box (< 5 ppm, H2O and O2). The positive and negative electrodes of the cells were separated from one another by a porous polypropylene membrane (Wellcos, Co.) and an electrolyte solution consisting of 1.1 M LiPF6 in ethylene carbonate: diethylcarbonate (1:1) solvent mixture.
2.4 Electrochemical measurement
The electrochemical properties of the assembled cells were recorded with charge/discharge curves in a voltage window between 3.0 and 1.0 V. The charge-discharge tests were galvanostatically cycled between 3.0 and 1.0 V for 50 cycles at a current rate of 1 C. These charge-discharge curves were also obtained at various current rates from 0.5 to 20 C in order to confirm the rate capability. For EIS measurements, the excitation potential applied to the cells was 5 mV and the frequency ranged from 100 kHz to 10 mHz. All the electrochemical measurements were carried out at 25 oC.
3. RESULTS AND DISCUSSION
[image:4.596.128.455.144.578.2]
V<001> < V<111>. Accordingly, {001} and {111} faces disappear while {110}, {100} and {101} faces are easily exposed during growth process [26], which are well consistent with the TEM image in the Fig. 1.
Figure 1. TEM image, HR-TEM image, and size-distribution of the 3((a), (f), and (k)), TNW-6((b), (g), and (l)), TNW-9((c), (h), and (m)), TNW-12((d), (i), and (n)), and TNW-24((e), (j), and (o)).
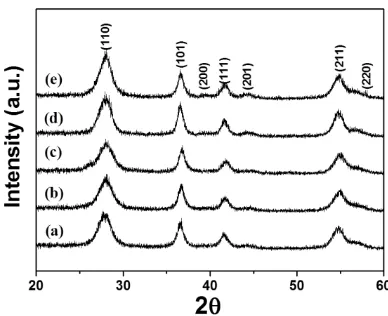
Powder XRD patterns of the TNWs represent the rutile phase with tetragonal crystal structure (a=b=0.452 nm, c=0.294 nm) as indicated in Fig. 2. The unit cell parameters for the TNWs are in agreement with those of the bulk TiO2 rutile phase with space group of P42/mnm (JCPDS No.
TNWs is related to growth rate. This suggests that as the reaction time increases, the (110) of the TNWs becomes dominant surface structure compared to the (101).
[image:5.596.198.392.135.293.2]Figure 2. XRD patterns of (a) TNW-3, (b) TNW-6, (c) TNW-9, (d) TNW-12, and (e) TNW-24.
Figure 3. Intensity ratio of (110) to (101) plane measured by XRD patterns Fig. 2.
[image:5.596.175.392.357.524.2] [image:5.596.185.394.581.740.2]
Li et al. reported that since octahedral structures of Ti4+ center could increase the probability of edge-shared bonding between two octahedrons, the face of rutile TiO2 was predominantly formed with tetragonal structure according to the order of corner, the edge and the face [27]. Accordingly, it is concluded that the single-crystalline TNWs are dominantly exposed to the (110) plane and grown to the one-dimensional structure along the [001] axis.
The 1st discharge-charge curves of the TNWs at a current density of 1 C are indicated in Fig. 4. The 1st capacities of the TNW-3, TNW-6, TNW-9, TNW-12, and TNW-24 are 138.7, 147.2, 163.2, 181.7, and 185.7 mAh g-1, respectively, representing that the capacity of TNWs increases with increasing reation time. Fig. 5 shows cycling performance of the TNWs at a current rate of 1 C. In particular, the TNW-12 and TNW-24 exhibit much improved performance up to 50 cycles with a reversible capacity of 165.6 and 166.2 mAh g-1, respectively, resulting from relavitely well-defined 1-D electrode structure favorable to lithium-ion intercalation as previously confirmed by TEM and XR1-D analysis. Fig. 6 shows Nyquist plots of the TNWs in the frequency range between 100 kHz and 10 mHz, consisting of a semicircle in the high frequency region and a straight line in the low frequency region.
Figure 5. Comparison of cycling performance of the TNWs at a current rate of 1 C for 50 cycles.
[image:6.596.182.394.340.500.2] [image:6.596.182.398.561.733.2]
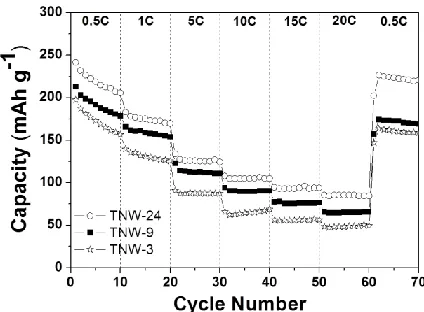
Figure 7. Rate and cycling performance of the TNWs at different current rates between 0.5 and 20 C.
The intercept impedance on the real axis corresponding to the solution resistance is almost the same as the samples. The value of the diameter of the semicircle on the Z axis is related to the charge transfer resistance (Rct). The values of Rct of the TNW-3, TNW-9, and TNW-24 are 127.4, 86.8, and 33.1 , respectively, representing much improved charge transport in the TNWs prepared with increasing reation time.
To investigate rate and cycling performance of the TNWs, the discharge-charge rates were increased from 0.5 to 20 C. As indicated in Fig. 7, the specific charge capacities of the 3, TNW-9, and TNW-24 are 158.6, 171.4, and 219.3 mAh g-1 at 0.5 C; 88.7, 118.6, 128.2, 10 C; 48.5, 65.7, and 84.3 mAh g-1 at 20 C. This represents that even at high current rates such as 5, 10, and 20 C, the TNWs can display an excellent high C-rate performance. When the current rate is returned to 0.5 C after 60 cycles at different current rates, the TNW-24 exhibits still large capacity (219.3 mAh g-1). The improved lithium-ion intercalation properties of the TNWs at high current rates may be attributed to relatively improved charge transport in the optimized 1-D nanostructure.
4. CONCLUSIONS
In summary, we have prepared size-controlled TNWs with enhanced lithium intercalation properties using hydrothermal process as a fucntion of reaction time. It is observed that the single-crystalline TNWs are dominantly exposed to the (110) plane and grown to the one-dimensional structure along the [001] axis exhibiting the single-crystalline nature. The relatively well-defined TNWs prepared for long reaction time show higher capacity and improved high C-rate performance as compared to the TNWs synthesized for short reaction time, resulting from improved lithium ion motion in the electrodes during intercalation process.
ACKNOWLEDGMENTS
[image:7.596.181.393.85.241.2]
References
1. T.-H. Park, J.-S. Yeo, Y. Ohata, M.-H. Seo, j. Miyawaki, I. Mochida and S.-H. Yoon, Int. J. Electrochem. Sci., 8 (2013) 249.
2. Y. Sun, J. Zhang, T. Huang, Z. Liu and A. Yu, Int. J. Electrochem. Sci., 8 (2013) 2918.
3. Y.-K. Zhou, L. Cao, F.-B. Zhang, B.-L. He and H.-L. Li, J. Electrochem. Soc., 150 (2003) A1246. 4. A. Fujishima and K. Honda, Nature, 238 (1972) 37.
5. X. Chen and S. S. Mao, Chem. Rev., 107 (2007) 2891.
6. C.-T. Dinh, T.-D. Nguyen, F. Kleitz and T.-O. Do, ACS Nano, 3 (2009) 3737.
7. Y. Yao, J. Zhang, T. Huang, H. Mao and A. Yu Int. J. Electrochem. Sci., 8 (2013) 3302. 8. Q. Cai, M. Paulose, O. K. Varghese and C. A. Grimes, J. Mater. Res., 20 (2005) 230. 9. C. Wu and Y. Xie, Chem. Commun., (2009) 5943.
10. J.-H. Lee, Sens. Actuators B-Chem., 140 (2009) 319.
11. X. W. Lou, L. A. Archer and Z. Yang, Adv. Mater., 20 (2008) 3987.
12. P. Segovia, D. Purdie, M. Hengsberger and Y. Baer, Nature, 402 (1999) 504.
13. D. J. Hornbaker, S.-J. Kahng, S. Misra, B. W. Smith, A. T. Johnson, E. J. Mele, D. E. Luzzi and A. Yazdani, Science, 295 (2002) 828.
14. A. I. Hochbaum and P. Yang, Chem. Rev., 110 (2010) 5272. 15. B. Liu and E. S. Aydil, J. Am. Chem. Soc., 131 (2009) 3985.
16. D. V. Bavykin, J. M. Friedrich and F. C. Walsh, Adv. Mater., 18 (2006) 2807. 17. A. Kumar, A. R. Madaria and C. Zhou, J. Phys. Chem. C, 114 (2010) 7787. 18. Y. Li, X. Lv and J. Li, Appl. Phys. Lett., 95 (2009) 113102.
19. A. Mohammadpour, P. R. Waghmare, S. K. Mitra and K. Shankar, ACS Nano, 4 (2010) 7421. 20. J. Li, W. Wan, H. Zhou, J. Li and D. Xu, Chem. Commun., 47 (2011) 3439.
21. Y. Wang, M. Wu and W. F. Zhang, Electrochim. Acta, 53 (2008) 7863.
22. Z. Hong, M. Wei, T. Lan, L. Jiang and G. Cao, Energy Environ. Sci., 5 (2012) 5408.
23. Z. R. Tian, J. A. Voigt, J. Liu, B. Mckenzie and H. Xu, J. Am. Chem. Soc., 125 (2003) 12384. 24. S. H. Kang, S.-H. Choi, M.-S. Kang, J.-Y. Kim, H.-S. Kim, T. Hyeon and Y.-E. Sung, Adv.
Mater., 20 (2008) 54.
25. M. Law, L. E. Greene, J. C. Johnson, R. Saykally and P. Yang, Nat. Mater., 4 (2005) 455. 26. W.-J. Li, E.-W. Shi and Z.-W. Yin, J. Cryst. Growth, 208 (2000) 546.
27. K. D. Benkstein, N. Kopidakis, J. van de Lagemaat and A. J. Frank, J. Phys. Chem. B, 107 (2003) 7759.