Optimisation of Flow Resistance and Turbulent Mixing
over Bed Forms
A. Arfaiea, A.D. Burnsa,1,∗, R.M. Dorrellb, D.B. Inghamc, J.T. Eggenhuisend, W.D. McCaffreye
aSchool of Chemical and Process Engineering, University of Leeds, Leeds LS2 9JT, UK bInstitute of Energy and Environment, University of Hull, Hull, HU6 7RX cDepartment of Mechanical Engineering, University of Sheffield, Sheffield, S10 2TN, UK
dDepartment of Earth Sciences, Utrecht University, PO Box 80021, 3508 TA Utrecht, Netherlands
eSchool of Earth and Environment, University of Leeds, Leeds LS2 9JT, UK
Abstract
Previous work on the interplay between turbulent mixing and flow
resis-tance for flows over periodic rib roughness elements is extended to consider
the flow over idealised shapes representative of naturally occurring
sedimen-tary bed forms. The primary motivation is to understand how bed form
roughness affects the carrying capacity of sediment-bearing flows in
environ-mental fluid dynamics applications, and in engineering applications involving
the transport of particulate matter in pipelines. For all bed form shapes
con-sidered, it is found that flow resistance and turbulent mixing are strongly
correlated, with maximum resistance coinciding with maximum mixing, as
was previously found for the special case of rectangular roughness elements.
Furthermore, it is found that the relation between flow resistance to eddy
viscosity collapses to a single monotonically increasing linear function for all
bed form shapes considered, indicating that the mixing characteristics of the
flows are independent of the detailed morphology of individual roughness
elements.
∗Corresponding author.
Email address: [email protected](A.D. Burns)
Keywords: Turbulent flow, Roughness, CFD, Bed forms
1. Introduction
Many industrial and environmental flows are subject to diminished or
enhanced turbulence, and flow resistance due to presence of rough surfaces.
In heat transfer applications, rib roughened surfaces are employed to enhance
heat transfer characteristics in heat exchanger design [1]. Experimental and
numerical studies have been performed to investigate the enhancement of
heat transfer by the presence of roughness elements of a wide range of shapes
[2, 3]. Furthermore, analytical and numerical optimisation studies have been
performed in order to search for roughness shapes which optimise both heat
transfer and friction loss performances [4].
Applications in the natural environment include the evolution of ribbed
scales in sharks [5], and the formation of bed forms, such as dunes, in
sed-iment carrying flows [6]. Previous work of Arfaie et al. [7, 8] has shown
that there are optimal patterns of large-scale roughness elements, such as
ribs, to maximise turbulence or to minimize flow resistance. This conclusion
apparently supported the work of Eggenhuisen and McCaffrey [9], who
pro-posed that run-out lengths of particulate gravity currents are enhanced by the
presence of rugose bed forms on the ocean floor, such as scours and dunes.
Eggenhuisen and McCaffrey conducted gravity current experiments where
the flow was perturbed by the presence of a single rectangular roughness
el-ement. They observed that the profiles for vertical turbulent normal stresses
showed enhanced mixing compared to unperturbed turbulence profiles and
concluded that enhanced mixing via bed forms result in a net distribution
of sediments towards the upper region of the flow, and thus a reduction in
density stratification and an increase in the run-out distance of the flow.
Turbidity current run-out length is controlled by the balance of
poten-tial to kinetic energy conversion as a function of the rate of energy
dissipa-tion through drag, diffusion and viscous dissipadissipa-tion. The potential energy
is controlled by the balance of turbulent particle diffusion with gravitational
settling. Thus maximizing flow turbulence is expected to increase the eddy
diffusivity of particles, the potential energy of the flow and hence promote
greater run out [10–13].
Arfaie et al. [7] sought to find further support for this hypothesis by
performing a series of numerical investigations to study the effect of lower
boundary roughness on turbulent flow in a two-dimensional channel.
Peri-odic arrays of rectangular roughness elements were considered over a wide
range of roughness spacing to height ratios, w/k. Computations of volume
averaged eddy viscosity were performed over this range in order to
estab-lish the optimum spacing that produces maximum turbulence enhancement
and mixing. This was found to occur when w/k is approximately equal to
7. Moreover, this value is only weakly dependent on Reynolds number, and
the decay rate of turbulence enhancement as a function of w/k beyond the
optimum spacing is slow. In addition to this, computations of friction factor
as a function of w/k indicated that maximum resistance to flow also occurs
at the same value of w/k= 7. Consequently, the implications on particulate
gravity current run-out length were inconclusive, as optimized turbulence
mixing tends to act to keep particles in suspension, hence increasing run-out
length, whilst optimized resistance acts as a large drain on turbulence kinetic
energy, hence decreasing run-out length.
The purpose of this paper is to extend the work of Arfaie et al. [7] to
consider the flow over idealised bed form shapes encountered in
geophysi-cal flows, such as dunes, anti-dunes, and symmetric triangular bed forms.
This builds on work by McLean et al. [14] who constructed semi-analytical
models based on boundary layer theory for velocity profiles, and boundary
shear stresses for flows over two-dimensional dunes. They emphasized the
importance of splitting the total drag force on the bed into the pressure drag,
or form drag, and the viscous drag, or skin friction. The former is largely
responsible for draining the flow of mean kinetic energy, whilst the latter
is largely responsible for erosion of particles from the bed into suspension,
hence increasing potential energy. Subsequent developments are reviewed by
Best [6] in the context of dunes in rivers. Furthermore, similar CFD research
has been carried out to model air flows and sediment transport over aeolian
dunes [15–18] and air pollution dispersion over urban canyons [19–21]. We
perform computational fluid dynamics (CFD) calculations to obtain detailed
information on the flow over a variety of idealized two-dimensional dunes.
The results are then used to obtain information on the resistive drag and
turbulence mixing characteristics as a function of dune shapes and aspect
ratios, with particular emphasis on the correlation between flow resistance
and turbulent mixing for the different shapes.
In addition to the environmental flow applications considered here, dunes
deposited from suspended particles have a significant effect on the flow
resis-tance and sediment carrying capacity of engineering conduits and pipelines,
such as those employed in sewage systems [22–24]. May [22] reported on
experimental results and models for the effects of a wide range of dune types
deposited by non-cohesive particles in sewage systems, noting that their
ef-fects were indeed significant, as minimum slope and flow velocities need to
be specified in order for sewers to become self-cleansing. This work was
ex-tended to cohesive particles by Skipworth et al. [23]. Coleman et al. [24]
performed experiments that indicated that dunes deposited in closed
con-duits have much in common with dunes formed under free surface flows.
2. Methods
2.1. Numerical Method
Simulated flow over complex bedforms was modelled using the numerical
method employed by Arfaie et al. [7]. Further details may be found in the
PhD thesis of Arfaie [8]. Arfaie et al used a commercial CFD code ANSYS
CFX-14.0 [25] to compare the predictions of a wide range of Reynolds
Aver-aged Navier−Stokes (RANS) based turbulence models with the experimental
results of Djenidi et al. [26] and the numerical Large Eddy Simulations of
Cui et al. [27]. The standard k-ε model [28], used herein, was found to give
adequate predictions of flow velocity profiles, and to provide the best
com-promise between accuracy and computational efficiency in order to permit
the exploration of a wide parameter space.
2.2. Idealised Bedforms
The rib roughness elements studied by Arfaie et al. [7] are generalised
to idealised shapes, similar to those studied by Moon et al. [2]. The shapes
considered here are intended to represent bed forms occurring in the natural
environment, see figure 1. The shapes S1 are the rectangular roughness
elements considered by Arfaie et al. [7]. ShapesS2−S4 represent symmetric
bed forms, anti-dunes and dunes respectively. Shapes S5−S7 combine the
simple shapes S1−S4 to approximate more realistic natural lower boundary
rugosities of symmetric dunes, anti-dunes and normal dunes, respectively.
Arfaie et al. [7] employ the categorisation of Perry et al. [29] of roughness
elements into two distinct types of roughness, namely, d−type and k−type,
where d and k denote channel height and roughness height, respectively.
For a sufficiently low width-to-height ratio, w/k . 2, the flow undergoes a
skimming flow regime, in which there is little interaction from the vicinity of
the roughness element to the outer flow region. This is known as d−type
roughness. Thek−typeroughness regime is associated withw/k&4, where
the flow in the roughness cavity begins to interact with the main body of
the flow. See Jimenez [30] for a detailed discussion of d−type and k−type
roughness regimes. Here, the roughness element height is denoted by h,
and we perform a study of the effect of axial roughness length to height ratio
(c/h). The upper flat surface length of the roughness elementcis varied while
the roughness element height is held fixed to cover aspect ratios c/h=1, 2
,4 and 8 for each of the bed geometries. The width-to-height ratio w/h is
kept fixed at the value w/h= 7 which was determined by Arfaie et al. [7] to
give optimal turbulent mixing and flow resistance for rectangular roughness
elements. We have not established that this is optimal for all the shapes
considered here; it is kept fixed in order to reduce the number of simulations
that need to be performed.
Figure 1: (a) Schematic illustration of the computational domains shown by the dashed lines for pressure driven flow over idealized bedforms under a periodic condition. (b) Channel flow configuration with roughness segment S5 positioned at the solid bed.
2.3. Model Assumptions
A shear flow of pure seawater over the idealised bed forms is considered.
It is assumed that the particle concentrations are sufficiently small that they
do not have a significant influence on the flow field. There is strong evidence
that this configuration also gives insight into behaviour of dilute sediment
gravity flows over bed forms; the velocity profiles of such flows in the inner
wall region (below peak velocity) resemble those in fully developed channel
flows (Kneller et al. [31], Eggenhuisen and McCaffrey [9], figure 2).
[image:6.612.207.403.189.444.2]d Turbulent Transition region
Laminar
U∞ U=0.99Um
x/H
Um
Outer Region Inner Region
u
Viscous sublayer
[image:7.612.117.503.133.258.2]y/H
Figure 2: The structure of turbidity currents modified from the work by Kneller et al. [31] and Simpson [32]. Note: the velocity profile below the velocity maximum approximates that of a shear flow.
Numerical simulations were conducted for fully-developed turbulent flow
over a range of idealized bed forms, see figure 1. The flow field was assumed
to be periodically repetitive in the stream-wise direction. Consequently, the
computational domain was restricted to describe the flow over a single
rough-ness element, as shown in figure 1 (a). The lower boundary was comprised
of a hydraulically rough bed of one of formsS1-S7, whilst the upper
bound-ary was flat, with no-slip boundbound-ary conditions imposed on both upper and
lower boundaries. The flow was driven by applying a constant mean
pres-sure gradient ∂p/∂x added as a source term in the x−momentum equation.
The derived periodic pressure field therefore represents fluctuations about
a mean pressure field which is linear in the x-direction. The flow was of
density ρ=1027 kg m−3and kinematic viscosity ν = 1.36×10⁻⁶m2s−1,
typ-ical of seawater. A value of ∂p/∂x =0.5 kg m−2s−2 was chosen to achieve
a high friction shear Reynolds number Reτ ≈ 105, where Reτ = (uτH/2)ν
is based on the shear velocity uτ =
√
H/(ρ(∂p/∂x) and half-channel height
H/2. This was motivated by the findings of Arfaie et al. [7] that turbulent
flow over rugose bed forms is only weakly dependent upon Reynolds number.
3. Results and Discussion
3.1. Velocity Fields
Here we analyze how the various idealized bed form shapes modulate the
flow velocity field. Velocity magnitude contours are plotted as a function
of bed form topography and aspect ratio. Shapes 1-4 in figure 3 behave as
k−type roughness elements as the cavity lengthw is larger than the height
h, (w/h = 7). The d−type surfaces (S5-S7) in figure 4 are arguably closer
to the flat wall case and consequently are less effective at slowing down the
flow than the k −type surfaces. Therefore, wall shear stress is greater in
d−type bed forms rather thank−type bed forms.
Small secondary recirculating regions are observed behind the
down-stream edge of shapes S1-S4 and S7. The structure of these vortices
de-pends significantly on the fluid-facing slope angle. For example, shapes S1
andS4 with downstream edges at 90 degrees to the horizontal produce larger
vortices compared to shape S2, whilst shape S5 has no recirculation region
at all. Comparison of streamlines for shapes S3 and S6 indicates that the
development of the secondary vortex on the slope facing bed forms does not
depend significantly on the spacing between two bed forms. The flow
stream-lines in figure 3 show that, for k −type roughness, the flow separates near
the bed form crest, followed by reattachment of the flow on the flat bed next
to the adjacent bed forms.
Moreover, the streamlines of shapeS1 show that as the aspect ratio c/h
increases, the focal point of the recirculation region shifts more towards the
leading face of the downstream rib, approaching intermediate type roughness
behavior. This behavior is also apparent for shape S4 where the streamlines
become more parallel as aspect ratio values increase from 1 to 8.
c/h=1
c/h=2
c/h=4
c/h=8
Velocity Magnitude:
k-type roughness elements
S1
S2
S3
[image:9.612.93.738.132.454.2]S4
Figure 3: Matrix view of the velocity magnitudes with flow streamlines overk-type bed forms with varying aspect ratioc/h.
S5
S6
S7
c/h=1
c/h=2
c/h=4
c/h=8
[image:10.612.93.733.150.404.2]Velocity Magnitude:
d-type roughness elements
Figure 4: Matrix view of the velocity magnitudes with flow streamlines overd-type bed forms with varying aspect ratioc/h.
3.2. Mean Flow and Flow Resistance
3.2.1. Mean Flow
In comparison to a flat bed, the presence of bed forms modulates the flow.
Both figures 3 and 4 show that as flow obstruction and thus frictional drag
is reduced, i.e. as aspect ratio c/h increased, the mean axial flow velocity
increases significantly. Also, the re-attachment length increases for allk−type
bed forms with the increase in aspect ratio. The behavior in reattachment
is attributed to shallowing of the lee slope reducing turbulence intensity
and diffusivity in the space between the recirculation region and the next
roughness element.
1 0 0 1 0 1
0 . 3 0 . 4 0 . 5 0 . 6 0 . 7 0 . 8
0 . 2
U
rou
g
h
/U
fl
a
t
[image:11.612.116.498.325.541.2]c / h
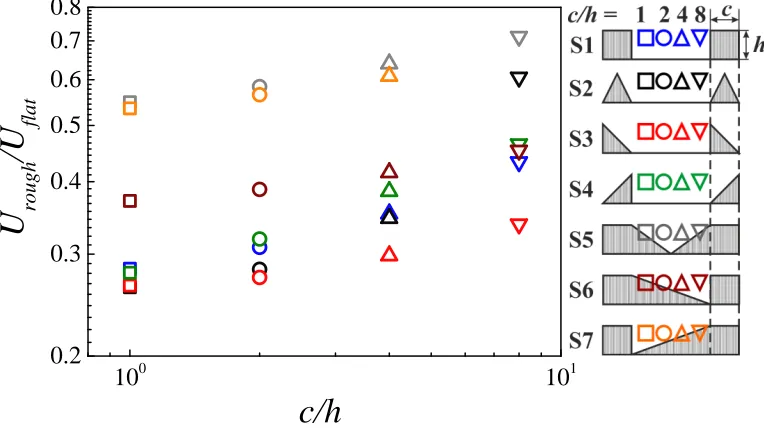
Figure 5: Normalised stream-wise mean velocity as a function of aspect ratio for all bed roughness cases.
The cross-sectionally averaged stream-wise velocity for flow over bed
forms is denoted by Urough. The corresponding quantity for the flat bed
case is denoted by Uf lat, and we use this to normalise the averaged
veloc-ity in the rough bed cases. The ratio Urough/Uf lat is plotted against aspect
ratio c/h for all lower roughness boundaries in figure 5. Due to
obstruc-tion of the flow by bed roughness elements Urough/Uf lat is strictly less than
unity. The maximum average velocity across all aspect ratios is seen for the
smoothed roughness elementS5, reducing flow separation, and the minimum
for pointed roughness element S3, enhancing flow separation.
Figure 5 indicates that shape S2 has a greater gradient in velocity with
respect to change in aspect ratio compared to that of other bed shapes.
This result agrees with the DNS results of Orlandi et al. [3] in which a higher
average flow velocity is seen over triangular bars compared to square bars. In
addition, there is an increase in velocity between thed−typeand thek−type
flows. However, the magnitude of this shift decreases with the increase in
aspect ratio. The value of Urough/Uf lat in the idealized asymmetric duneS4
is greater than that of the idealized symmetric dune S2.
3.2.2. Flow Resistance
As all simulations are performed under a fixed imposed pressure gradient,
the results described above on variation of mean velocity with shape and
aspect ratio are a consequence of the variation of resistance to flow as these
quantities are varied. The resistance to flow over the various bed geometries
is computed using the Darcy-Weisbach friction factor f defined in equation
(1), based on the specified mean pressure gradient ∂p/∂x and the averaged
stream velocity U
f = (H/2)(−∂p/∂x)
0.5ρU2 (1)
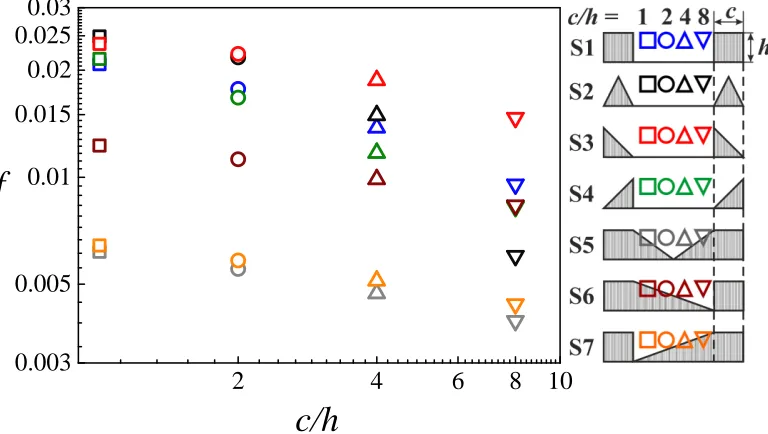
Figure 6 plots friction factor against aspect ratio of each of the bed form
shapes. The results show that the friction factor decreases with increasing
aspect ratio for all bed form shapes. The maximum flow resistance occurs
for the transport of fluid over shape S3 and the minimum flow resistance
occurs for shapeS5. The friction factor is greater fork−type (with spacing)
roughness elements than d−type (without spacing) cases.
2 4 6 8 1 0 0 . 0 0 5
0 . 0 1 0 . 0 1 5 0 . 0 2 0 . 0 2 5 0 . 0 3
0 . 0 0 3
f
[image:13.612.114.498.130.347.2]c / h
Figure 6: Darcy-Weisbach friction factor as a function of aspect ratio for flows over different roughness elements.
3.2.3. Skin Friction and Form Drag
In order to understand the dynamics of natural flows over bed forms,
it is necessary to partition the total shear stress at the bottom boundary
into the separate components of skin friction and form drag [14]. The skin
friction is the component due to tangential stresses (viscous forces), and this
is a determining factor for the rate of entrainment of sediment from the bed
into the main flow. The form drag is the component due to normal stresses
(pressure forces). For flow over blunt roughness elements, this is usually
the dominant contributor to the overall drag force, due to flow separation
generating large differences in pressure between the front and the back of the
element.
The skin friction and form drag are determined by integrating the viscous
and pressure forces along the wall, as described in equations (2) and (3)
respectively
⃗ Fv =
∫
w
τw⃗s.⃗xds (2)
⃗ Fp =
∫
w
p⃗n.⃗xds (3)
The relative change in the skin friction and form drag are determined
by non-dimensionalising the friction components (2) and (3) with the force
applied to the lower boundary,
Ds= |
⃗ Fv|
1/2ρu2
fAw
(4)
Df =
|F⃗
p|
1/2ρu2
fAp
(5)
Here uf is the area-weighted average velocity u of the fully developed
flow at the outlet of the flat bed case. The skin friction (4) employs the
wetted areas Aw, which for aspect ratios c/h = 1,2,4,8 are given by Aw =
9,11,15,23 m2 respectively. The form drag (eqn. 5) employs the projected
area Ap, which is equal to 1 m2 for all bedform simulations.
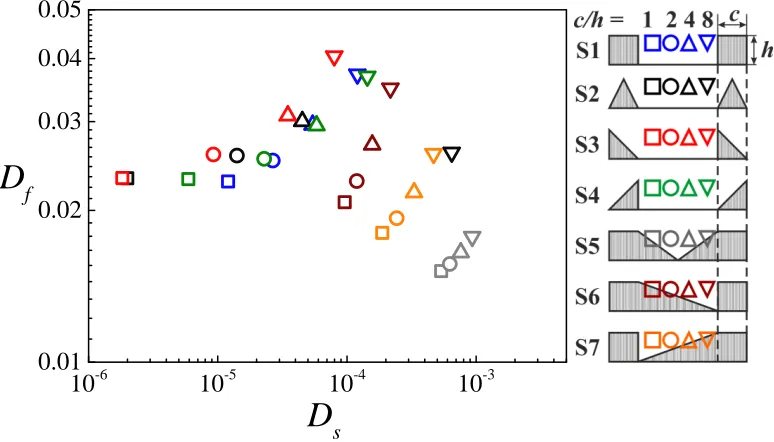
Figure 7 plots absolute values of the form drag against skin friction for
all bed form shapes and aspect ratios. Both skin friction and form drag are
found to increase with increase in aspect ratio for all bed form shapes. The
increase is due to the integral of the pressure and viscous forces for the
ex-tended surface produced by the increase in aspect ratioc/h. Further, figure 7
indicates that the value of skin friction is greater ford−typethan fork−type
bed forms. This is primarily due to either the lack of flow separation (S5 and
S6), or flow separation with reattachment on the downstream sloped edge
next adjacent element (S7) leading to a low pressure gradient. Consequently
the value of form drag is greater for thek−type than thed−typebed forms.
1 0 - 6 1 0 - 5 1 0 - 4 1 0 - 3 0 . 0 2
0 . 0 3 0 . 0 4 0 . 0 5
0 . 0 1
D
f [image:15.612.112.499.129.350.2]D
sFigure 7: Form drag versus skin friction for all bed forms and aspect ratios.
3.3. Turbulent Mixing
Arfaie et al. [7] measured the amount of turbulent mixing in a
periodi-cally rectangular rib roughened channel using the non-dimensionalised eddy
viscosity µ+,
µ+= µt
ρU(H/2) (6)
Here we use µ+ to evaluate the turbulent mixing potential of different bed
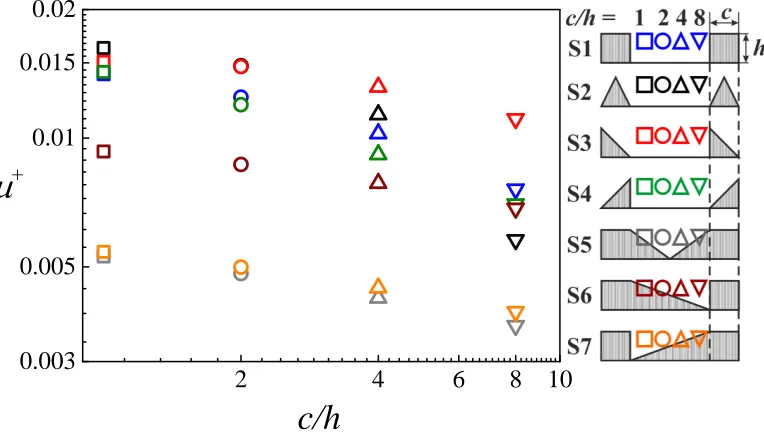
geometries. Figure 8 plots the average value of µ+ as a function of c/h for
all bed geometries. The overall results suggest that bedforms with high flow
resistance also result in high turbulent mixing. The data further shows that
µ+ is reduced as the aspect ratio of the bed forms is increased. The lowest
turbulent mixing occurs for bed form shapes with closed spacing (S5-S7) and
the highest for bed forms (S1-S4). The comparison of figure 7 and 8 suggests
that turbulent mixing depends more on form drag than skin friction.
2 4 6 8 1 0 0 . 0 0 5
0 . 0 1 0 . 0 1 5 0 . 0 2
0 . 0 0 3
+c / h
[image:16.612.116.498.129.347.2]
Figure 8: Normalised eddy viscosity as a function of aspect ratioc/h.
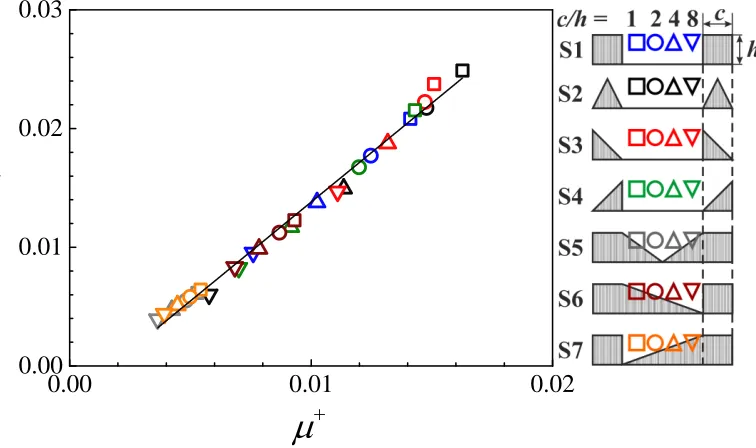
An important conclusion that can be made is that the strong
correla-tion between turbulent mixing and flow resistance found by Arfaie et al. [7]
for rectangular bedforms is also seen for the full range of bed form shapes
considered here. Figure 9 plots the non-dimensionalised measures of flow
re-sistance (friction factor f) and turbulence mixing (normalized eddy viscosity
µ+) against each other for all bedform shapes and aspect ratios considered
here. Significantly, the data effectively collapse onto the same straight line
for all bed form shapes. This result is reminiscent of the observation that
the friction factor for turbulent flow in a rough conduit correlates well with
flow Reynolds number and roughness height, but is apparently independent
of roughness morphology at least up to 5% relative roughness [33]. Figure 9
indicates that this degree of universality may extend to the larger roughness
elements considered here.
Shape S5 produces the least flow resistance and mixing. The low value
of vertical mixing in this case appears to be caused by the lack of flow
0 . 0 0 0 . 0 1 0 . 0 2 0 . 0 1
0 . 0 2 0 . 0 3
0 . 0 0
f
[image:17.612.119.497.129.353.2]
+Figure 9: Friction factor as a function of normalized eddy viscosity for all bedforms.
aration and the closed gap between two adjacent bed forms. Moreover, the
results indicate that flow separation has an insignificant effect on the value
of upward sediment mixing for the skimming flow type (S5-S7), where the
flow reattaches on the slope of the downstream roughness element. Figure 9
further illustrates that the blunt facing bed formsS5 andS7 achieve a higher
turbulent mixing than the slope facing bed form S6. k−type surfaces also
show an increase in µ+ and f with the orientation of the downstream facing
flow (or stoss side). For instance, shapes S2 and S4 lead to reductions in
the values of mixing and flow resistance compared to shape S1 andS2 (with
90◦ side facing flow angle). For the k−type surfaces the effect of flow
sepa-ration on the flow resistance and turbulent mixing is also weak. This effect
is described for shape S3 at c/h=2 (with flow separation) and c/h=4 (with
absence of flow separation) in figure 3.
3.4. Discussion
The rate of sediment entrainment is a function of the skin friction.
There-fore figure 7 predicts that the sediment entrainment rate is greater for bed
forms S5-S7 (d −type) than for S1-S4. The results also predict that the
suspension of the sediment should be greater for k−type than for d−type
surfaces. Both the sediment suspension and entrainment rate are predicted
to increase with the decrease in slope angle.
Finally, in accord with the results of Arfaie et al. [7] we cannot conclude
that any of the shapes considered definitively promote or reduce run out
length, due to the subtle interplay that occurs between the competing effects
of flow resistance and turbulent mixing on the overall kinetic and potential
energy budgets.
Note that this work has considered integrally averaged measures of flow
resistance and turbulent mixing for flows of pure liquid, neglecting details
of particle transport. The results suggest that, in order to elucidate further
the effects of bed form roughness on the energy budget of sediment-bearing
flows, such as turbidity currents, further work is needed that investigates the
details of particle concentrations, sedimentation and flow capacity. This will
be the subject of further investigations.
4. Conclusions
Numerical simulations have been performed at a high Reynolds number
for shear flow over a series of lower boundary roughness elements comprising
a range of idealized bed form shapes, of varying crestal length to height ratio
c/hat a fixed width to height ratio (w/h). The total basal shear stress is split
into skin friction and form drag, with sediment entrainment proportional to
skin-friction and turbulent mixing proportional to the sum of skin friction
and form drag. Here we show how the respective magnitudes of these friction
components vary as a function of scale of various bed form roughness shapes,
with bothd−type andk−typecharacteristics. Sediment erosion is expected
to be greatest in the d−type bed forms where skin friction is observed to
be largest. The results also demonstrate how bed forms affect the balance of
energy lost (through frictional effects) as a function of the potential energy
gained (through turbulent mixing).
The results indicate that, for all bed form shapes considered, both the
friction factor and the dimensionless eddy viscosity decrease with increasing
aspect ratio. Thus, flow resistance and turbulent mixing are strongly
cor-related, with maximum resistance coinciding with maximum mixing for all
shapes considered. Figure 9 indicates that the relation between flow
resis-tance to eddy viscosity collapses to a single monotonically increasing linear
function for all bed forms considered. This result is significant, as it supports
the conjecture that the relations between frictional and mixing
characteris-tics of the flows that we have considered are independent of the detailed
morphology of the individual roughness elements.
Software availability
Software: ANSYS-CFX
Programming languages: Fortran 90/77 and CEL
Discretization technique: Finite volume
Current version: 14.0
Availability: Download definition file from https://drive.google.com/
drive/folders/1XHNEXllzCivBDtAMycox1QRV--d_BB5D?usp=sharing
Operating system: Linux and Windows
License: Commercial
HPC: Dual socket with quad-core Intel X5560 (2.8GHz) processors per server;
12GB of DDR3 1333MHz memory per server, 24GB flash disk and QDR
Connect-X infiniband (ARC1 University of Leeds).
Parallel Run Mode: MPI (8 nodes and 8 processes per node used)
Contact address: ANSYS UK Ltd, Abingdon, United Kingdom
Telephone: +44 (0) 800 048 0462
Fax: None
Email: [email protected]
Web page: https://www.ansys.com
Year First available: 1991
Plotting tool: Tecplot, https://www.tecplot.com/
Acknowledgements
This research was funded by the Turbidites Research Group industry
con-sortium (Anadarko, BG, BHP Billiton, BP, ConocoPhillips, Maersk, Marathon,
Nexen, Statoil, Tullow and Woodside.)
References
[1] R. Webb, E. Eckert, Application of rough surfaces to heat exchanger
design, International Journal of Heat and Mass Transfer 15 (1972) 1647–
1658.
[2] M.-A. Moon, M.-J. Park, K.-Y. Kim, Evaluation of heat transfer
per-formances of various rib shapes, International Journal of Heat and Mass
Transfer 71 (2014) 275–284.
[3] P. Orlandi, D. Sassun, S. Leonardi, Dns of conjugate heat transfer in
presence of rough surfaces, International Journal of Heat and Mass
Transfer 100 (2016) 250–266.
[4] H.-M. Kim, K.-Y. Kim, Shape optimization of three-dimensional
chan-nel roughened by angled ribs with rans analysis of turbulent heat
trans-fer, International Journal of heat and mass transfer 49 (2006) 4013–4022.
[5] T. Fletcher, J. Altringham, J. Peakall, P. Wignall, R. Dorrell,
Hydro-dynamics of fossil fishes, in: Proc. R. Soc. B, volume 281, The Royal
Society, 2014, p. 20140703.
[6] J. Best, The fluid dynamics of river dunes: A review and some future
research directions, Journal of Geophysical Research: Earth Surface 110
(2005).
[7] A. Arfaie, A. Burns, R. Dorrell, J. Eggenhuisen, D. Ingham, W.
McCaf-frey, Optimised mixing and flow resistance during shear flow over a rib
roughened boundary, International Communications in Heat and Mass
Transfer 58 (2014) 54–62.
[8] A. Arfaie, Numerical Modelling of the Influence of Lower Boundary
Roughness on Turbulent Sedimentary Flows, Ph.D. thesis, University of
Leeds, 2015.
[9] J. T. Eggenhuisen, W. D. McCaffrey, The vertical turbulence
struc-ture of experimental turbidity currents encountering basal
obstruc-tions: implications for vertical suspended sediment distribution in
non-equilibrium currents, Sedimentology 59 (2012) 1101–1120.
[10] J. T. Eggenhuisen, W. D. McCaffrey, P. D. Haughton, R. W. Butler,
Small-scale spatial variability in turbidity-current flow controlled by
roughness resulting from substrate erosion: field evidence for a feedback
mechanism, Journal of Sedimentary Research 80 (2010) 129–136.
[11] J. T. Eggenhuisen, W. D. McCaffrey, P. D. Haughton, R. W. Butler,
Shallow erosion beneath turbidity currents and its impact on the
ar-chitectural development of turbidite sheet systems, Sedimentology 58
(2011) 936–959.
[12] K. M. Straub, D. Mohrig, J. Buttles, B. McElroy, C. Pirmez,
Quan-tifying the influence of channel sinuosity on the depositional
mechan-ics of channelized turbidity currents: A laboratory study, Marine and
Petroleum Geology 28 (2011) 744–760.
[13] T. Tokyay, G. Constantinescu, E. Meiburg, Lock-exchange gravity
cur-rents with a high volume of release propagating over a periodic array of
obstacles, Journal of Fluid Mechanics 672 (2011) 570–605.
[14] S. McLean, S. Wolfe, J. Nelson, Spatially averaged flow over a wavy
boundary revisited, Journal of Geophysical Research: Oceans 104 (1999)
15743–15753.
[15] S. Feng, H. Ning, Computational simulations of blown sand fluxes over
the surfaces of complex microtopography, Environmental Modelling &
Software 25 (2010) 362–367.
[16] D. R. Parsons, G. F. Wiggs, I. J. Walker, R. I. Ferguson, B. G.
Gar-vey, Numerical modelling of airflow over an idealised transverse dune,
Environmental Modelling & Software 19 (2004) 153–162.
[17] S. Takahashi, M. Du, P. Wu, T. Maki, S. Kawashima, Three dimensional
numerical simulation of the flow over complex terrain with windbreak
hedge, Environmental modelling & software 13 (1998) 257–265.
[18] S. J. Wakes, T. Maegli, K. J. Dickinson, M. J. Hilton, Numerical
mod-elling of wind flow over a complex topography, Environmental Modmod-elling
& Software 25 (2010) 237–247.
[19] Y. Yang, Y. Shao, Numerical simulations of flow and pollution
disper-sion in urban atmospheric boundary layers, Environmental Modelling
& Software 23 (2008) 906–921.
[20] E. Solazzo, X. Cai, S. Vardoulakis, Improved parameterisation for the
numerical modelling of air pollution within an urban street canyon,
En-vironmental Modelling & Software 24 (2009) 381–388.
[21] A. Chu, R. C.-W. Kwok, K. Yu, Study of pollution dispersion in urban
areas using computational fluid dynamics (cfd) and geographic
mation system (gis), Environmental Modelling & Software 20 (2005)
273–277.
[22] R. May, Sediment transport in pipes, sewers and deposited beds,
Tech-nical Report, HR Wallingford, 1993.
[23] P. J. Skipworth, S. J. Tait, A. J. Saul, Erosion of sediment beds in
sewers: Model development, Journal of environmental engineering 125
(1999) 566–573.
[24] S. E. Coleman, J. J. Fedele, M. H. Garc ı´ a, Closed-conduit bed-form
initiation and development, Journal of Hydraulic Engineering 129 (2003)
956–965.
[25] ANSYS CFX Theory Guide, v14, Ansys Inc (2011).
[26] L. Djenidi, R. Elavarasan, R. Antonia, The turbulent boundary layer
over transverse square cavities, Journal of Fluid Mechanics 395 (1999)
271–294.
[27] J. Cui, V. C. Patel, C.-L. Lin, Large-eddy simulation of turbulent flow
in a channel with rib roughness, International Journal of Heat and Fluid
Flow 24 (2003) 372–388.
[28] B. E. Launder, D. B. Spalding, The numerical computation of turbulent
flows, Computer methods in applied mechanics and engineering 3 (1974)
269–289.
[29] A. E. Perry, W. H. Schofield, P. N. Joubert, Rough wall turbulent
boundary layers, Journal of Fluid Mechanics 37 (1969) 383–413.
[30] J. Jimenez, Turbulent flows over rough walls, Annu. Rev. Fluid Mech.
36 (2004) 173–196.
[31] B. C. Kneller, S. J. Bennett, W. D. McCaffrey, Velocity structure,
turbulence and fluid stresses in experimental gravity currents, Journal
of Geophysical Research: Oceans 104 (1999) 5381–5391.
[32] J. E. Simpson, Effects of the lower boundary on the head of a gravity
current, Journal of Fluid Mechanics 53 (1972) 759768.
[33] J. B. Taylor, A. L. Carrano, S. G. Kandlikar, Characterization of the
effect of surface roughness and texture on fluid flowpast, present, and
future, International journal of thermal sciences 45 (2006) 962–968.
![Figure 2: The structure of turbidity currents modified from the work by Kneller et al. [31]and Simpson [32]](https://thumb-us.123doks.com/thumbv2/123dok_us/1892915.146978/7.612.117.503.133.258/figure-structure-turbidity-currents-modied-work-kneller-simpson.webp)