http://eprints.whiterose.ac.uk/152614/ Version: Accepted Version
Article:
Fingleton, B., Olner, D. and Pryce, G. orcid.org/0000-0002-4380-0388 (Accepted: 2019) Estimating the local employment impacts of immigration : a dynamic spatial panel model. Urban Studies. ISSN 0042-0980 (In Press)
© 2019 The Authors. This is an author-produced version of a paper accepted for
publication in Urban Studies. Uploaded in accordance with the publisher's self-archiving policy.
[email protected] https://eprints.whiterose.ac.uk/
Reuse
Items deposited in White Rose Research Online are protected by copyright, with all rights reserved unless indicated otherwise. They may be downloaded and/or printed for private study, or other acts as permitted by national copyright laws. The publisher or other rights holders may allow further reproduction and re-use of the full text version. This is indicated by the licence information on the White Rose Research Online record for the item.
Takedown
If you consider content in White Rose Research Online to be in breach of UK law, please notify us by
Estimating the Local Employment Impacts of Immigration: A Dynamic Spatial Panel Model
Journal: Urban Studies Manuscript ID CUS-280-19-03.R1 Manuscript Type: Article
<b>Discipline: Please select a keyword from the following list that best describes the discipline used in your paper.:
Economics
World Region: Please select the region(s) that best reflect the focus of your paper. Names of individual countries, cities & economic groupings should appear in the title where appropriate.:
Western Europe
Major Topic: Please identify up to 5 topics that best identify the subject of your article.:
Employment/Labour, Migration, Race/Ethnicity, Demographics, Diversity/Cohesion/Segregation
You may add up to 2 further relevant keywords of your choosing below::
Estimating the Local Employment Impacts of Immigration
A Dynamic Spatial Panel Model
Abstract:
This paper highlights a number of important gaps in the UK evidence base on the employment
impacts of immigration, namely: (i) the lack of research on the local impacts of immigration—
existing studies only estimate the impact for the country as a whole; (ii) the absence of
long-term estimates –research has focussed on relatively short time spans – there are no estimates
of the impact over several decades, for example; (iii) the tendency to ignore spatial dependence
of employment which can bias the results and distort inference—there are no robust spatial
econometric estimates we are aware of. We aim to address these shortcomings by creating a
unique dataset of linked Census geographies spanning 5 Censuses since 1971. These yield a
large enough sample to estimate the local impacts of immigration using a novel spatial panel
model which controls for endogenous selection effects arising from migrants being attracted to
high-employment areas. We illustrate our approach with an application to London and find that
no migrant group has a statistically significant long-term negative effect on employment. EU
migrants are found to have a significant positive impact. Our approach opens up a new avenue
of inquiry into sub-national variations in the impacts of immigration on employment.
Keywords: Employment/Labour, Migration, Race/Ethnicity, Demographics,
Diversity/Cohesion/Segregation, Spatial Panel Model, Lump of Labour Fallacy
1. Introduction
A steady flow of articles from the UK populist press over the past decade have claimed or
implied that migrants are taking the jobs of UK born workers.1 This claim, and the debates
surrounding it, have shaped the political agenda on immigration making it one of the defining
issues in the Brexit2 referendum. Similar debates have been prominent in other countries that
1 E.g. “Immigration is reducing jobs for British workers and David Cameron must act now”, Daily
Mail, 11th January 2012; “Job hopes of 4 million Brits hit by an ‘unlimited’ pool of EU migrants who
are willing to work for low wages”, Daily Mail, 17 May 2018.
2 “Brexit” is the shorthand term used to denote Britain’s exit from the European Union. 2
have experienced large inflows of migrants, particularly North America (Borjas 2017) and
Western Europe (Geddes and Scholten, 2016).
The usual counter from economists is that such claims tend to fall prey to the “lump of labour
fallacy” (Scholss, 1891): the fallacious assumption that there is a fixed amount of work, and
hence a fixed number of jobs, in the economy. Under this assumption, a job offered to a migrant
worker is necessarily a job opportunity taken away from UK-born workers. The lump of labour
assumption is dubious for a number of reasons. First, migrants are also consumers and so a rise
in immigration potentially boosts aggregate demand for goods and services, which in turn
creates more employment as firms hire more workers to meet the additional demand. Second,
economic migrants are often more entrepreneurial than native workers, setting up new
businesses and generating new employment opportunities (Levie, 2007). Third, skilled
migrants make a disproportionate contribution to innovation (Kerr and Lincoln 2010) which is
likely to improve UK competitiveness, increasing long-run wages and employment (Devlin et
al. 2014). Fourth, migrants often fill jobs that UK workers are unable or reluctant to accept, so
without those migrants, much of the work would either not be done at all or be done by
machines. Fifth, an increase in the share of migrants increases the probability that natives stay
in school longer (Hunt, 2017), potentially boosting their long-term employability and
productivity. Sixth, migrants increase cultural diversity which in turn has the potential to boost
innovation, social capital, tolerance, overseas trade links and growth (Elias and Paradies, 2016).
Seventh, because they tend to be highly mobile and responsive to wage differentials, migrants
help “grease the wheels of the labour market” (Borjas 2001) by responding to higher wages
produced by regional labour shortages, improving labour market efficiency which in turn helps
foster productivity and growth. Finally, because migrants are typically young and mobile, they
can help rebalance the demographic profile of an ageing workforce (Bijak et al. 2007), reducing
the dependency ratio, again boosting productivity, competitiveness, and long-term employment
growth.
The extent to which these positive impacts offset the number of jobs taken by migrants is not
something that can be predicted by theory alone as the overall outcome depends on various
contextual factors including the mix of skills among migrant and native workers and the types
of jobs generated. So what does the evidence to date tell us? UK empirical studies have
consistently shown the impacts of migration on employment to be negligible or zero. For
example, after reviewing the evidence to date, the most recent report of the Migration Advisory
Committee (MAC 2018), billed as the “most comprehensive-ever analysis of migration to
Britain” (Economist, 20183), concluded that migrants have negligible impact on the
employment and unemployment outcomes of the UK-born workers (MAC 2018 p.2).
Our contention in this paper is that the broad consensus in the empirical literature belies a
number of significant weaknesses in the methods used and in the scope of estimates. In
particular, we argue that the existing literature has so far failed to provide robust evidence on
the local and long-term impacts of immigration, and has overlooked spatial-spillover effects
between localities.
The aims of our the approach offered in this paper are twofold: (1) to propose a way of linking
data over a much longer timespan (half a century) that would facilitate a new generation of
research in the UK providing localised longer term estimates of the impacts of immigration
based on large samples; and (2) to develop a way of incorporating both spatial autocorrelation
and endogeneity in a spatial dynamic framework.
The paper is structured as follows. In section 2 we provide a brief review of the literature with
a view to identifying key data/methodological deficiencies. Section 3 describes our approach
to creating a linked Census database that has the temporal and spatial attributes needed for
robust long-term, large sample, local modelling. In Section 4 we set our strategy for
econometric estimation which we illustrate in Section 5 with an application to London for the
period 1971 to 2011. Section 6 concludes with a brief summary of the findings and limitations.
2. Literature Review
This literature review highlights the shortcomings that our estimation strategy will seek to
address. Our focus is on the UK where our data are from, but similar methodological limitations
apply to the evidence from other countries, particularly US studies from which the UK research
draws much of its methodological inspiration. For a more general overview of the literature on
the employment impacts of immigration, see recent reviews by MAC (2012),4 Portes (2018)
and MAC (2018).
3 https://www.economist.com/britain/2018/09/20/what-immigration-system-should-britain-adopt-after-brexit
4 Migration Advisory Committee (2012) ‘Analysis of the Impacts of Migration’, cited in Devlin et al.
2014.
Empirical research on the labour market effects of immigration in the UK is a surprisingly
recent field. In their 2005 paper, Dustmann et al. noted that “While there are many empirical
studies for the US, and some work for European countries, no analysis exists for Britain”
(Dustmann et al. 2005, p.F325). They also argue that Britain’s specific migration history,
settlement patterns and migration history greatly inhibit the usefulness of inferring labour
impacts of immigration from studies based on other countries. Since then, a significant number
of studies have emerged (see systematic review by Devlin et al. 2014) which provide estimates
at the level of the UK as a whole.
This brings us to the first significant shortcoming in the existing literature – the lack of research
on how the impacts of immigration varies geographically within the UK. Finding ways to
measure local impacts is important because “assessing aggregate national impacts may mask
impacts that vary markedly across localities” (Devlin et al. 2014, p.2).5 Overlooking local
variation in the impact of immigration may have pressing social and political implications. For
example, opposition to immigration and support for Brexit varies greatly across the UK, and it
is possible that this is partly due to the greater anxiety about the employment impacts of
immigration in some areas which may in some cases reflect genuine differences across regions.
Addressing those anxieties would entail more than simply addressing the ignorance of voters
about the economic benefits of immigration if the local impacts deviate from the national
picture. It also raises important questions of social justice and what the appropriate political
response should be if some areas benefit from immigration while others face negative impacts,
such as a reduction in job availability for native workers.6 Clear evidence on the issue could,
for example, reinforce the case for a more comprehensive approach to regional economic
policy and geographic redistribution. This is particularly true if the negative local impacts of
immigration are persistent rather than temporary labour market adjustments. There is a strong
imperative, therefore, to find a reliable approach to estimate the local employment impacts of
immigration in the long term.
Probably the main reason for the focus on macro estimation in the literature is lack of data
availability at the local level. For example, most UK econometric studies on the employment
impact of migration rely on the Labour Force survey, which has the advantage of providing
5 Devlin, C., Bolt, O., Patel, D., Harding, D. and Hussain, I. (2014) “Impacts of migration on UK
native employment: An analytical review of the evidence”, Home Office Occasional Paper 109.
6 We define “native workers” as those born in the UK, irrespective of race and ethnicity. 2
detailed information on individual employment attributes. However, since the LFS only
provides geographical information at regional level, there is no scope for sub-regional analysis.
Even if it were possible to obtain sub-regional location identifiers in the LFS, the sample size
(roughly equal to 0.5% of the UK population – Dustmann et al. 2005) would be too small to
capture migration effects. Dustmann et al. (2003, p.56), for example, give a breakdown of the
LFS sample sizes by region which shows that, in 2000 there were just 47 migrants in
Merseyside, of which 16 were ethnic minority immigrants, 11 of whom arrived in the UK after
1981. Similarly, the East Yorkshire and Humberside sample for that year included just 77
migrants, of whom 6 were ethnic minorities that arrived after 1981. These sample sizes are far
too small to derive meaningful econometric estimates of local effects, leading Devlin et al.
(2014, p.36) to conclude that robust estimation of migration impacts is not feasible at the local
level. Unsurprisingly, then, there are no robust estimates of the regional or sub-regional
employment impacts of migration that we are aware of, only national estimates based on
regional variation. This is problematic because national level estimates will mask the variation
in effects between local labour markets.
Another key challenge in this area of research is how to take into account the endogeneity that
arises from migrants being drawn to areas of high employment. A standard solution to this,
following Card (2001), is to use historical settlement patterns of migrants as instruments, the
rationale being that new migrants will be drawn to existing settlements of their own group
where familiar cultural norms and similar linguistic backgrounds will make it easier for them
to find supportive social networks (Dustmann et al 2005, p. F328). One of the aims of our
approach is to introduce these causal inference approaches into a Census-based model of the
local impacts of immigration. This approach requires following areas over time, which means
developing a panel of consistent areal units spanning multiple Census years, which is a major
undertaking.
The dominant method for estimating employment effects of immigration is to estimate “the
spatial correlation between immigrant labour inflows and changes in native or overall labour
market” (Dustmann et al 2005, p. F328). Dustmann et al. (2005), for example, estimate a
regression of employment, Eit, on immigrant share, it … where = 1, 2, …, 17 is the UK i
region and = 1983, 1984, … 2000 is the year. This creates a panel of regions over time with t
17x18 = 306 observations. After differencing the equation, the estimated coefficient on it is
estimated essentially from the relationship between the regional variation in employment rates
and the immigrant share. However, this approach ignores the potential for spatial dependence
in employment, the dependent variable, which is very likely to be spatially autocorrelated
(Molho, 1995; McMillen, 2004) leading to bias in estimated parameters and less reliable
inferences (Anselin 1988). The lack of research on the consequences of spatial spillovers for
the estimation of employment impacts of immigration is probably due in part to the limitations
in the methodological tools available. It is only relatively recently that spatial temporal models
have emerged that allow researchers to incorporate spatial autocorrelation in dynamic models
in a methodologically robust way.
While the mainstream econometrics literature has tended to overlook issues of spatial
dependence, spatial econometric papers have tended to “neglect the issue of endogeneity, other
than that arising from spatial lags of the dependent variable” (Chen et al. 2013, p.4). There
have beena number of attempts to develop spatial panel models which account for endogeneity
on the right hand side of the regression equation (Anselin & Lozano-Gracia, 2008; Fingleton
& Le Gallo, 2008; Kelejian & Prucha, 1998, 1999; Chen et al. 2013), but these have not, as far
as we are aware, been applied to the problem of estimating the employment impacts of
immigration. Crucially, accounting for spatial dependence is likely to be all the more important
when attempting to estimate the local effects of immigration as the spatial dynamics of
employment are likely to be increasingly spatially dependent the smaller the geographical units
being considered.
A further shortcoming of the existing literature worth noting is the short time span considered
in existing empirical papers. While the short term impacts of immigration are important, the
full effect of immigration on the labour may take several decades to emerge. For example, the
impact of migration on the propensity for natives to stay in school longer (Hunt 2017) may
affect the employment outcomes of natives, labour market productivity and economic
competitiveness over many decades, and may also affect the employment outcomes of their
children. Because of the reliance on survey data such as the Labour Force Survey, much of the
research has tended to look at relatively short time. For example, Dustmann et al. (2005) use
data on employment over the 1983 to 2000 period and include three and four year lags. Gilpin
et al. (2006) look at data for 2004 to 2005. Lemos and Portes’ (2008) data runs from
2004-2006. Reed and Latorre’s (2009) data spans seven years (2000 to 2007). Nathan (2011) looks
at long-run impacts in British cities but this actually only spans the period 1994–2008.
Migration Advisory Committee (2012) Analysis of the Impacts of Migration covers a much
longer period (1975-2010) but does not include robust controls (such as instrumental variables)
for endogeneity. None of these studies account for spatial dependence in employment.
In summary, then, our review of the existing literature on the impacts of immigration identifies
three key weaknesses:
1. Lack of evidence on local impacts: perhaps the single most important limitation of
existing research is that it has tended to only provide robust estimates of employment
impacts of immigration at the national level. While the impact of migration on
employment and the economy as a whole may be positive overall, it is possible that the
local impacts vary considerably. There is a strong social justice and political imperative
to find ways to provide robust spatially disaggregated estimates of migration impacts.
2. Spatial spill-overs (spatial autocorrelation): existing mainstream approaches to
estimating the impacts of immigration on employment in the UK have emerged in
isolation from the spatial econometrics literature which has provided a large theoretical
and empirical body of evidence on the methodological problems associated with
ignoring the issue of spatial autocorrelation in the dependent variable.
3. Short time spans and temporal lags: while the short term impacts of immigration are
important, the full effect of immigration on the labour market may take several decades
to emerge. Most of the existing literature, however, focuses on relatively short time
horizons for labour market adjustment, and there are no studies we are aware of that
provide robust long term estimates at the local level, or that account for endogeneity.
In the remainder of the paper we describe our proposed method for estimating local impacts of
immigration, one that exploits the large samples and long timespan that can be achieved by
linking Census data at the small area level over five decades. But first we describe the dataset
needed to estimate this kind of model and how it can be compiled from existing data resources.
It is to this task which we now turn.
3. Data Linkage
Our definition of migrants is based on the country of birth variable from UK Census data. We
define a migrant as someone born outside of the UK. While digital UK Census data exists going
back to 1971, no two decades have the same definitions for country of birth. They also never
use exactly the same geographical boundaries between decades; boundaries used in 1971, 1981
and 1991 in particular are very different to those used in 2001 and 2011.
Any time-based analysis requires variables and geographies to both be harmonised: country of
birth categories must be consistent and geographical zones must not change between Censuses.
A contribution of this paper is to present such a harmonised dataset over a five Census period
from 1971 to 2011. We focus in this paper on London as this represents a large labour market
area with high population density yielding a large number of aerial units with large samples
and relatively high numbers of migrants. Although this paper looks only at London, the
harmonised dataset is now freely available7 for the whole of Great Britain. It should now be
possible, therefore, to apply the model proposed below to other parts of the country.
Country of birth data has been harmonised at the lowest level that maximises the number of
categories. For example, while later Censuses have many European countries listed, the earliest
(1971) has only a single category for Europe. This single category imposes itself on all other
decades when matching. Note, however, that while we have linked the data back to 1971, in
order to include lagged employment, all the other variables in the model only go as far back
1981.
We use an altered version of 1991 wards as our common geographical zone. This choice was
determined by the nature of data in the 1991 Census, where data are presented in two forms:
'Small Area Statistics' (SAS) tables are at small geographies but do not contain enough
information due to disclosure restrictions. 'Local Base Statistics' (LBS) have more information
for country of birth but only at 1991 ward geography level. Choosing this geography as the
common basis for the whole dataset allows us to maximise country of birth categories across
all five Censuses.
However, LBS tables also have their own disclosure restrictions where some wards have values
set to zero if counts are lower than 1000 people or 320 households. This is solved by creating
a new variant of the 1991 ward geography. This takes advantage of the fact that zero-count
LBS wards have their populations assigned to neighbouring wards. It is possible to work out
which wards these are by comparing to population counts in the SAS tables. SAS geographical
zones can be aggregated to wards and their counts subtracted from surrounding wards to detect
which contain the re-assigned LBS counts. Once those wards are identified, neighbours are
combined into a single new "ward" containing the correct population count. This is only done
for small minority of wards overall but is a necessary step to avoid missing values.
7https://github.com/SheffieldMethodsInstitute/HarmonisedCountryOfBirthDatasets 2
Census variables can then be assigned to this new geography. For 1991, borders match
precisely, accounting for the new aggregated zones. For the other four Censuses, much smaller
geographies are used as the source and so the majority are entirely contained within wards.
Others that overlap ward boundaries have their values split according to zone area.
The same process is also used for Census employment data, though this is easier than country
of birth as there is rather less difficulty in harmonising employment proportions over time.
Proof of Concept Application to London Wards
It is beyond the scope of the current paper to develop local estimates of the local employment
impacts of immigration for the whole of the UK. Rather, we seek to demonstrate proof of
concept by applying our proposed method to a single region. We have selected London because
it is the preeminent destination of migrants in the UK and as such is of interest in its own right:
“The case of London is worth further study. Immigrant concentration in London as a
whole far exceeds that elsewhere in any other city of the UK. Concentration and inflows
of immigrants into London also differ widely according to area.” (Dustmann et al, 2003,
p.51)
London also has a large number of wards, the basic aerial unit of analysis used in our
longitudinal linkage of 5 Censuses, so it guarantees large samples for estimation. Nevertheless,
our illustrative application to London should be extendable to other regions of the UK provided
they have a sufficient number of wards and sufficient variation in migrant proportions across
those wards. This may mean that some regions will need to be clustered in order to achieve
sufficiently large samples and variation, but such applications of our method will nevertheless
offer for the first time the opportunity to study sub-national variation in the impacts of
immigration on employment. Descriptive statistics on the data used in the model are given in
the Supplementary Material.
Variable Selection
The advantage of our longitudinally-linked ward-level Census data is that it offers both long
time spans and the potential for comprehensive geographical coverage. However, it also brings
with it significant limitations, most notably with respect to the choice of explanatory variables.
In the modelling strategy described below we seek to explain the role of migration in
determining the level of employment in each ward. Our selection of explanatory variables is
limited to those variables we can extract or derive from the Census, namely: migrants born in
Ireland, India, Pakistan, Europe and the Rest of the World, the number of UK-born residents
and the unemployment rate location quotient (explained in the Econometric Strategy section
below).
4. Econometric Strategy
Our approach is based on a dynamic spatial panel model developed by Baltagi et al (2019) to
estimate the relationship between the number of people from different countries of birth and
the level of employment, controlling for a number of effects. The approach adopted is designed
with a view to being able to use the model to simulate different employment outcomes on the
basis of different totals of migrants in the future.
The estimates below are for a time-space dynamic panel model for i1,...,N where N is the
number of districts, in this case N= 760 which are the wards of Greater London. Also
where = 5, corresponding to the census years 1971,1981,1991, 2001 and 2011.
1,...,
t T T
(1)
1 1 1 2,..., ; 1,...,
it it i t it i t it
y y w y x βw y t T i N
In equation(1) yit lnEit which is the log of the level of employment in ward at time . i t E
is defined as the total economically active minus the number unemployed. xit is a (1 x K=7)
vector and containing, for ward at time , the logs of the levels of migrants born in Ireland, i t
India, Pakistan, Europe and the Rest of the World, together with the log of the number of
UK-born residents and the log of the unemployment rate location quotient. The location quotient is
defined as the share of the economically active that are unemployed in ward at time i t
divided by the share at time in Greater London as a whole. We have included the spatial lag t
of the temporal lag w yi t1 which helps eliminate bias in the estimation of ,β and 1 . Baltagi
et al (2019) give more detail of the rationale for its inclusion, based on equilibrium arguments,
showing that we would expect to obtain a negative parameter relating to this variable. wi is
a (1 xN) vector which corresponds to the th row of the (i N xN ) matrix WN . WNis based
on a first order contiguity matrix, so that prior to standardisation wij = 1 if districts and i j
share a boundary and wij= 0 otherwise. This is subsequently row-standardised so that rows sum
to 1. is the autoregressive time dependence parameter, 1 is the spatial lag parameter and
is the time-space diffusion parameter.
2
In (2) we assume that there is a spatial moving average error process, so that:
(2)
2
it uit i t w u
Which implies that the errors in contiguous districts are interdependent. This local spillover of
unobserved variables and shocks captured by the errors mitigates against the absence of
spatially lagged regressors (w xi it) from equation (1), which typically would be advocated to
control for local spillovers. As pointed out by Pace et al.(2012), Baltagi et al(2019), and
Fingleton et al(2018), adopting the established convention (Kelejian and Prucha,1998, 1999)
which advises that optimal instruments should include spatial lags of regressors(xit) such as
, the presence of spatially lagged regressors in (1) would require the use of (w xi it)
as instruments, but this appears to result in a weak instrument problem. The
2 3
(w x w xi it, i it)
innovation uit is a compound process thus
(3)
it i it
u
In which the component i is a ward-specific time invariant effect assumed to be 2 (0, )
iid
and it is the remainder effect assumed to be iid(0,2). iand itare independent of each
other and among themselves. The icontrol for unobserved heterogeneity across wards and
the itaccount for random shocks across time and location.
Given BN
IN 1WN
and CN
IN WN
in which IN is an identity matrix ofdimension N, we can rewrite equation(1) as
(4)
1 1 1
1
t N N t N t N t
y B C y B x B ε
Under this specification, the short run matrix of partial derivatives is:
(5)
1 1
... k N
k Nk t
d d
dx dx
y y
B
Equation (5) is a matrix of partial derivatives of yt at time t with respect to the k’th
explanatory variable , giving the percent change in employment due to a 1% change in the k
’th explanatory variable (for example the number of migrants born in Ireland, etc). Note that in
conventional econometrics this elasticity would be simply the scalar k, but here we are taking
account of spillover effects, resulting in the (Nx N) matrix kBN1in which the derivative
varies according to the ward incurring the change in the ’th explanatory variable and the ward k
in which we measure the response. A simplified average measure of the total effect of a 1%
change in the k’th explanatory variable in all wards at time t is the total short-run elasticity
(tse), which is the mean column sum of kBN1, thus
(6) 1 1 N k Nij i k B tse N
As shown in Fingleton and Szumilo(2019), this is exactly equal to the mean difference between
the predicted log employment given by
in which1
ˆ ˆ
y y /
N
B A
k it it
i tse N
(7)
1 1 1 1 2 ˆ ˆ ˆ ˆ ˆ ˆ ˆ ˆˆ ˆ ( )
ˆ ˆ
1
A
t N N t t N
B
t N N t t kt N
N N N
kt
y B C y x H μ
y B C y x x H μ
H I W
x
Matrix HN is defined so that it is non-singular and the time-invariant district heterogeneity
effect μ is based on averaging simulated outcomes of 1
1
N N t N t t t
μ H B y C y x ν
taken over different realizations of ~N(0,ˆ2) .
The total short run elasticity tsek gives the % change in employment given a temporary, one
period, 1% change in variable k across N wards. In contrast the total long run elasticity tlekis
the % change given a permanent 1% change in variable k across N wards. In this case the
matrix of derivatives becomes:
(8)
11
... k N
k Nk
d d
dx dx
y y
C B I
Again the corresponding tlekis given by the mean difference between the predicted log
employment, in this case after iterating
(9) 1 1 1 1 ˆ ˆ ˆ ˆ ˆ ˆ ˆ ˆ
ˆ ˆ ( )
A
N N t N
B
N N t k N
y B C y x H μ
y B C y x x H μ
over 1,...,T where T is a large number, withxk 1 for all for migrant group k .
Observe that xt doesn’t change, so the log levels of the number of migrants from each origin
is held constant as varies, and thus the total long run elasticity of employment with respect
to migrant group isk
(10)
1
ˆ ˆ
y y /
N
B A
k it it
i
tle N
Figure 1 illustrates the simulated paths of employment for two arbitrary London wards. Thus
we see the paths of ward ( ‘01ABFF’), with no change in European migrant numbers, as given i
by yˆ ,Ai 1,...,T and with a permanent 1% increase in European migrant numbers, given by
. Also shown are the paths for ward (‘01ABFR’), given by and ˆ ,Bi 1,...,T
y j yˆ ,Aj 1,...,T
. We see convergence well before T =50 and, because or row standardisation, ˆ ,Aj 1,...,T
y
each ward has the same long run elasticity (equal to the mean of 0.28 given in Table 2) as given
by the path differences.
Below we give the outcome of testing for dynamic stability and stationarity of the model. The
rules are: (11)
max min max minvector of eigenvalues of
1 if 0
1 if 0
1 if 0
1 if 0
e e e e e W
Equivalently, dynamic stability and stationarity requires that the largest characteristic root of
is less than 1. Given that these rules are adhered to, the paths of the dependent variable
for each ward become stable, converging to levels as given by the prediction equation. Thus,
the rules need to be satisfied to allow a long run elasticity to exist.
Further technical details on the rationale for the structural model specification, inference and
estimation are presented in Supplementary Material.
5. Illustrative Application to London
The estimates given in Tables 1 and 2 are for two estimators with corresponding long run
elasticities and indications that we have dynamic stability and stationarity. Two alternative
assumptions are made for the moments conditions underpinning the parameter estimates. One
is that the regressors are exogenous. This means that the whole temporal sequence of the
regressors is independent of the (differenced) errors and hence the dependent (endogenous)
variable, log employment level, so that the matrix of instruments includes
.
2
, , , 1,...,
t N t N t t T
x W x W x
In contrast, the endogenous variables y W yt, N t and W yN t1 are lagged by two decadal Census
periods (i.e. 20 years) to retain zero covariance with the difference errors. Assuming variables
are endogenous, it is standard to use only observations that are lagged by two time periods in
order to satisfy moments conditions. For example:
( ) 0, , 1,..., 2; 3,...,
( ) 0, 1,..., 2; 3,...,
il it
i l it
E y i l T t T
E l T t T
w y
(12)
For these to hold, following Arellano and Bond(1991), we require that it is serially
uncorrelated so that E(it,it2)0, but unfortunately the test statistic
is not defined with so few periods. We simply assume that the
2 cov( it, it 2) / . . m s e
moments conditions hold by virtue of the length of time between and t t2 .
The second assumption is that, alternatively, the regressors are themselves endogenous. This
seems reasonable in the context, for as Bond(2002) observes, ‘strict exogeneity rules out any
feedback from current or past shocks to current values of the variable, which is often not a
natural restriction in the context of economic models relating several jointly determined
variables’. Accordingly, we prefer to assume that our regressors are endogenous, in other words
variation in the regressors both causes, and is caused by, variation in the level of employment.
For example, a reasonable proposition is that the number of resident migrants born in, for
example, Ireland will partly depend on the employment level of the ward. Consequently we
assuming feedback from the depend variable, and hence shocks embodied within the dependent
variable, to the regressors, and assuming that this is not the case tends to magnify the causal
impact of the regressors, as we show subsequently. In order to allow for endogeneity, the
regressors are also lagged by two periods hoping to retain zero covariance as required by the
moments conditions. Therefore, the set of instruments only includes
, and this has the beneficial advantage of reducing the number of
2
, , , 1,..., 2
t N t N t t T
x W x W x
instruments from 121 in the case of assuming exogeneity, to 51, thus helping to minimise weak
instrument problems that tend to occur with a surfeit of instruments.
We see the effects of the different estimation techniques in Tables 1 and 2 below. Note first
that we are controlling for temporal and spatial spillovers. In other words, employment levels
tend to have some kind of memory, regardless of the other factors affecting them. The level of
employment in a ward is significantly related to the level observed in the previous Census.
They also are spatially organised, tending to occur in clumps across space as employment in
one district may cause, or be caused by, employment in a nearby, contiguous ward. These are
more or less autonomous processes which we have attempted to isolate so as to obtain the real
effect of different country of birth concentrations. Also, some of the heterogeneity across
wards, which is assumed to be constant over time, is represented by the term 2 which denotes
the variance of μi . So with this error component we pick up the net effect of unobserved
factors that make each ward distinctive and which also influence each ward’s employment
level. In addition, this is spatially dependent, according to a spatial moving average error
process, with the negative coefficient indicating positive local error interdependence,
recognising that proximate wards tend to have similar socio-economic and environmental
attributes that are omitted as explicit regressors and therefore present in the errors.
Additionally, we have controlled for the level of unemployment, or rather the log of the location
quotient for unemployment in each census year. Higher levels of unemployment may be a
characteristic of different ethnic groups, so the idea here is to isolate the unemployment effect
on the level of employment so as to get a sharper focus on each country of birth group per se,
rather than its higher or lower unemployment level. By introducing the different country of
birth population levels, one can see if they carry any additional information about the level of
employment, over and above that carried by the other variables in the model. So, for example,
does knowing the level of Irish-born migrants in a district provide any additional information
about the employment level given knowledge of the other variables (unemployment LQ,
Indian-born residents etc)?
Table 1 gives the parameter estimates and elasticities assuming that the regressors are
exogenous. Evidently there are some significant causal impacts, though as we show below
some of these are illusory. Controlling for the temporal and spatial spillover effects due to
and , evidently the long run elasticity indicates that a 1% increase in migrants ,
t N t
y W y W yN t1
from Ireland leads to a 0.079% fall in the level of employment. The elasticities for Indian,
Pakistani, European, rest of the World and UK borne residents are all positive.
We next consider the outcomes under an assumption that the regressors are endogenous. For
example, the statistically significant effects obtained assuming exogeneity may be the results
of reverse causation, where an increase in the level of employment causes country of birth
numbers to increase, maybe attracted by employment opportunities. For example Indian-born
residents may be sorted into areas with a high level of employment rather than causing a high
level of employment.
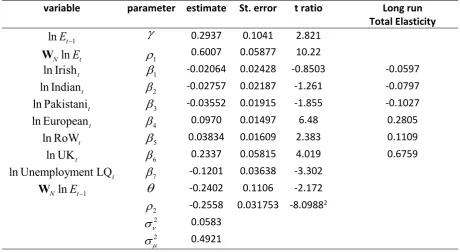
Table 2 gives the details, indicating that allowing for reverse causation, or bidirectional effects,
there are no significant changes in local employment levels as a result of change in the levels
of Irish, Indian and Pakistani-born residents. In other words, the significant negative
relationship between Irish-born migrants and employment level, and the positive relation
between Indian-born migrants and employment level, given in Table 1, appears to be the
outcome of sorting, with Irish migrants attracted to lower employment wards, and Indian
migrants attracted to higher employment wards. These different outcomes may be the
consequence of social segregation processes and differences in the housing markets as they
impact the distribution of these migrant groups. Once we control for sorting or selection
effects, as in Table 2, the links between Irish, Pakistani and Indian migrant numbers and
employment levels become insignificant, suggesting that the number of Irish or Indian migrants
do not cause variation in employment levels. On the other hand, the significant relations
between European, UK and rest of the World residents and employment evident in Table 1 do
not disappear after controlling for endogeneity. From Table 2 it appears that there are causal
effects whereby a 1% increase in the number of residents born in Europe, the Rest of the World
or in the UK leads to rising employment levels. A permanent 1% increase in European- born
migrants causes the level of employment to rise by 0.28%. For the UK born, the impact is a
0.67% increase in employment, and for migrants from the rest of the World, a 1% increase
causes employment to increase by 0.11%.
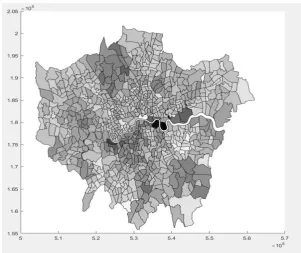
In order to highlight the scope of the methodology, the not insubstantial causal effect of a 1%
change in the number of European migrants, and to illustrate possible Brexit-induced impacts,
we compare the equilibrium level of employment with the anticipated level if the number of
European migrants became 1% lower than the 2011 level in each London ward. Figure 2(a)
shows the outcome, which is a variegated pattern of job-reduction. The anticipated job-loss is
about 500 in the financial district of Canary Wharf, with Figure 2(b) illustrating that more than
200 of the 760 wards are predicted to have a job loss of at least 130. Summing over the 760
wards gives an overall total job loss of 117,410 from a total of 4,185,100 predicted total
London-wide jobs. Of course, this preliminary analysis could be extended to explore the
impact of changes in migrant populations in individual or groups of wards, and allow different
assumptions about other drivers of employment levels.
6. Conclusion
This paper has highlighted important deficiencies in the UK evidence base on the employment
impacts of immigration. Perhaps most problematic of these is the dearth robust estimation of
the local impacts of immigration—existing studies only estimate the impact for the country as
a whole. While the impact of migration on employment and the economy as a whole may be
positive, it is possible that the local impacts vary considerably. This potentially raises questions
of social justice and whether there is a political imperative for regions that have gained from
immigration to compensate areas that have lost out.
We also noted that existing studies tend to focus on short- and medium-term effects – we are
not able to find any UK studies that provide robust estimates of the employment impact after
several decades, for example. This is important as some of the impacts of immigration may
take many years to affect employment outcomes. Existing studies also tend to ignore spatial
dependence of employment which can bias the results and distort inference.
Our goal has been to aim to address these shortcomings by creating a unique dataset of linked
Census geographies spanning 5 Censuses since 1971. These linked datasets yield a large
enough sample to estimate the local impacts of immigration using a novel spatial panel model
which controls for endogenous selection effects arising from migrants being attracted to
high-employment areas. We illustrated our approach with an application to London and found that
no migrant group had a statistically significant long-term negative effect on employment.
European migrants and those born in the Rest of the World were found to have a significant
positive impact. It would be of interest to see whether these findings are replicated in other city
regions of the UK.
Our approach is not without limitations. Because our focus has very much been on the
employment outcomes of immigration, there are a number of important effects we do not
consider including hours worked, wages, productivity and the wider economic and social
impacts of immigration. Our approach does have the scope to introduce additional covariates,
including a more disaggregated breakdown of migrant groups, were data available, and this
could challenge the conclusions of our analysis. However, we are aware of no source of data
on these variables at the local level over the timespan of our study period. There is perhaps an
unavoidable trade-off, therefore, between having a richer model (with wages etc.) for a shorter
time period for the UK as a whole, and having a more parsimonious model that provides large
sample estimates at the local level over a longer time horizon. We argue that in demonstrating
how the latter can be achieved we provide an important complementary perspective on
migration research, and one that opens up a new avenue of inquiry into sub-national variations
in the impacts of immigration on employment.
Another limitation of our study is that, despite uniquely spanning five Censuses, the number
of periods at our disposal is insufficient to formally test the assumptions made regarding the
viability of the moments equations used in model estimation. This might be possible given
additional periods, but the data set at our disposal currently is at the cutting edge of the
data-technology: it is probably not feasible to add locally geocoded Census data on the variables in
our model before 1971. However, when the 2021 Census data comes on line, it should be
possible to add this extra wave of data to the model which may make it possible to formally
test the moments equations.
Funding Acknowledgement
This research was funded by the Economic and Social Research Council (ESRC) through the
Urban Big Data Centre (Grant Reference: ES/L011921/1) and the Understanding Inequalities
(Grant Reference: ES/P009301/1) projects.
References
Arellano, M. and Bond, S. (1991) ‘Some tests of specification for panel data: Monte Carlo
evidence and an application to employment equations’, The Review of Economic
Studies, vol. 58(2), pp 277–297.
Baltagi, B.H., Fingleton, B. and Pirotte, A. (2019) ‘A time–space dynamic panel data model
with spatial moving average errors’, Regional Science and Urban Economics. 76:
13-31. https://doi.org/10.1016/j.regsciurbeco.2018.04.013.
Bond, S. (2002) ‘Dynamic panel data models: A guide to micro data methods and practice’,
Portuguese Economic Journal , vol. 1, pp 141–162.
Bijak, J., Kupiszewska, D., Kupiszewski, M. et al. (2007) Population and labour force
projections for 27 European countries, 2002-052: impact of international migration on
population ageing, Eur J Population 23: 1.
Borjas, G. (2001) ‘Does Immigration Grease the Wheels of the Labor Market?’, Brookings
Papers on Economic Activity, 2001(1), pp 69–119.
Borjas, G. (2017) The Immigratin Debate we Need, The New York Times, 27th Feb 2018t
Card, D. (2001) ‘Immigrant Inflows, Native Outflows, and the Local Market Impacts of Higher
Immigration’, Journal of Labor Economics, Vol. 19, No. 1. (Jan., 2001), pp22-64.
Chen, Y., Fingleton, B., Pryce, G., Chen, A. & Djordjević, S. (2013) Implications of Rising
Flood Risk for Residential Real Estate Prices & the Location of Employment, J.
Property Research, 30 (4). pp. 298-323.
Dustmann, C., Fabbri, F. and Preston, I. (2005) ‘The Impact of Immigration on the UK Labour
Market’, Economic Journal, vol. 115, pp F324–F341.
Elias, A. and Paradies, Y. (2016) The regional impact of cultural diversity on wages: evidence
from Australia", IZA Journal of Migration, DOI 10.1186/s40176-016-0060-4
Fingleton, B., Le Gallo J. and Pirotte, A. (2018) ‘A multidimensional spatial lag panel data
model with spatial moving average nested random effects errors’, Empirical
Economics, Vol. 55, pp 113–146.
Fingleton, B., and Szumilo, N. (2019) ‘Simulating the impact of transport infrastructure
investment on wages: A dynamic spatial panel model approach’, Regional Science and
Urban Economics, vol. 75, pp 148–164.
Geddes, A. and Scholten, P. (2016) The Politics of Migration and Immigration in Europe, Sage,
London.
Gilpin, N., Henty, M., Lemos, S., Portes, J. and Bullen, C. (2006) ‘The Impact of Free
Movement of Workers from Central and Eastern Europe on the UK Labour Market’,
Department for Work and Pensions Working Paper No. 29. London: Department for
Work and Pensions.
Hunt, J. (2017) The Impact of Immigration on the Educational Attainment of Natives, J. Human
Resources 52, 1060-1118
Kelejian, H. H. and Prucha, I. R. (1998) ‘A Generalized Spatial Two-Stage Least Squares
Procedure for Estimating a Spatial Autoregressive Model with Autoregressive
Disturbances’, Journal of Real Estate Finance and Economics, vol. 17, pp 99–121.
Kelejian, H. H. and Prucha, I. R. (1999) ‘A Generalized Moments Estimator for the
Autoregressive Parameter in a Spatial Model’, International Economic Review, vol. 40,
pp 509–533.
Kerr, W. R., and Lincoln, W. F. (2010) “The supply side of innovation: H-1B visa reforms and
U.S. ethnic invention.” Journal of Labor Economics 28:3, 473–508.
Lemos, S. and Portes, J. (2008) ‘The impact of migration from the new EU member states on
native workers’. London: Department for Work and Pensions.
Levie, J. (2007) Immigration, In-Migration, Ethnicity and Entrepreneurship in the United
Kingdom, Small Bus Econ 28: 143.
McMillen, D.P. (2004) Employment Densities, Spatial Autocorrelation, and Subcenters in
Large Metropolitan Areas, Journal of Regional Science, 44, 225-244.
Migration Advisory Committee (2012) ‘Analysis of the Impacts of Migration’, accessed on 1st
February 2019
https://assets.publishing.service.gov.uk/government/uploads/system/uploads/attachme
nt_data/file/257235/analysis-of-the-impacts.pdf
Molho, I. (1995) Spatial Autocorrelation in British Unemployment, Journal of Regional
Science, 35, 641-658.
Nathan, M. (2011) ‘The long term impacts of migration in British cities: Diversity, Wages,
Employment and Prices’. SERC Discussion Paper No. 67.
Pace, R. K., LeSage, J. P., Zhu, S. (2012) ‘Spatial Dependence in Regressors and its Effect on
Performance of Likelihood-based and Instrumental Variable Estimators’ In Terrell, D.
and Millimet, D. (eds.) Advances in econometrics vol. 30, Thomas B. Fomby, R. Carter
Hill, Ivan Jeliazkov, Juan Carlos Escanciano and Eric Hillebrand. Emerald Group
Publishing Limited, Bingley, pp 257–295
Portes, J. and French, S. (2005), ‘The impact of free movement of workers from central and
eastern Europe: Early evidence’, London: Department for Work and Pensions
Department of Work and Pensions, Working Paper No. 18.
Reed, H. and Latorre, M. (2009) ‘The economic impacts of migration on the UK labour
market’, Institute for Public Policy Research.
Roodenburg, H., Euwals, R. and ter Rele, H. (2003) ‘Immigration and the Dutch economy‘,
CPB Netherlands Bureau for Economic Policy Analysis.
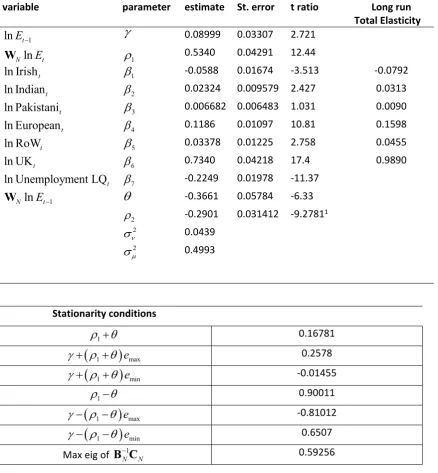
Table 1 Parameter Estimates & Elasticities Assuming Exogenous Regressors
variable parameter estimate St. error t ratio Long run
Total Elasticity
1
lnEt 0.08999 0.03307 2.721
ln
N Et
W 1 0.5340 0.04291 12.44
ln Irisht 1 -0.0588 0.01674 -3.513 -0.0792
ln Indiant 2 0.02324 0.009579 2.427 0.0313
ln Pakistanit 3 0.006682 0.006483 1.031 0.0090
ln Europeant 4 0.1186 0.01097 10.81 0.1598
ln RoWt 5 0.03378 0.01225 2.758 0.0455
ln UKt 6 0.7340 0.04218 17.4 0.9890
ln Unemployment LQt 7 -0.2249 0.01978 -11.37
1
ln
N Et
W -0.3661 0.05784 -6.33
2
-0.2901 0.031412 -9.27811
2
0.0439
2
0.4993
Stationarity conditions
1
0.16781
1
emax 0.2578
1
emin -0.01455
1
0.90011
1
emax -0.81012
1
emin 0.6507
Max eig of B CN1 N 0.59256
1 Given a bootstrap sampling distribution, the GM estimation method for is used to obtain 100 estimates
2
under the null of zero error dependence and the mean and variance of the null distribution used to calculate the t ratio.
Table 2 Parameter Estimates & Elasticities Controlling for Selection Effects
variable parameter estimate St. error t ratio Long run
Total Elasticity
1
lnEt 0.2937 0.1041 2.821
ln
N Et
W 1 0.6007 0.05877 10.22
ln Irisht 1 -0.02064 0.02428 -0.8503 -0.0597
ln Indiant 2 -0.02757 0.02187 -1.261 -0.0797
ln Pakistanit 3 -0.03552 0.01915 -1.855 -0.1027
ln Europeant 4 0.0970 0.01497 6.48 0.2805
ln RoWt 5 0.03834 0.01609 2.383 0.1109
ln UKt 6 0.2337 0.05815 4.019 0.6759
ln Unemployment LQt 7 -0.1201 0.03638 -3.302
1
ln
N Et
W -0.2402 0.1106 -2.172
2
-0.2558 0.031753 -8.09882
2
0.0583
2
0.4921
2 Given a bootstrap sampling distribution, the GM estimation method for is used to obtain 100 estimates
2
under the null of zero error dependence and the mean and variance of the null distribution used to calculate the t ratio.
Stationarity conditions
1
0.36058
1
emax 0.65425
1
emin 0.069051
1
0.84089
1
emax -0.54722
1
emin 0.8175
Max eig of B CN1 N 0.32256
F b d n
European migrants
0 5 10 15 20 25 30 35 40 45 50
time 8.4
8.5 8.6 8.7 8.8 8.9 9 9.1 9.2 9.3
lo
g
e
mp
lo
yme
n
t
Simulated paths of employment : Two London Wards
ward 01ABFR with increase
ward 01ABFR without increase
ward 01ABFF with increase
ward 01ABFF without increase
Figure 2: Simulated ! " #$ %&'(" ")n European Migrants
(a) Map of Employment Loss Across London Wards
(b) Frequency Distribution of Job-Loss