transformations in novel reduced activation Si-Fe-V-Cr (-Mo) high entropy alloys
.
White Rose Research Online URL for this paper:
http://eprints.whiterose.ac.uk/148391/
Version: Published Version
Article:
Gandy, A.S. orcid.org/0000-0003-3692-6211, Jim, B., Coe, G. et al. (5 more authors)
(2019) High temperature and ion implantation-induced phase transformations in novel
reduced activation Si-Fe-V-Cr (-Mo) high entropy alloys. Frontiers in Materials, 6. 146.
ISSN 2296-8016
https://doi.org/10.3389/fmats.2019.00146
eprints@whiterose.ac.uk https://eprints.whiterose.ac.uk/
Reuse
This article is distributed under the terms of the Creative Commons Attribution (CC BY) licence. This licence allows you to distribute, remix, tweak, and build upon the work, even commercially, as long as you credit the authors for the original work. More information and the full terms of the licence here:
https://creativecommons.org/licenses/
Takedown
If you consider content in White Rose Research Online to be in breach of UK law, please notify us by
doi: 10.3389/fmats.2019.00146
Edited by:
Tadeusz Hryniewicz, Koszalin University of Technology, Poland
Reviewed by:
Gloria Pena Uris, University of Vigo, Spain Alexander John Knowles, University of Birmingham, United Kingdom
*Correspondence:
Amy S. Gandy a.gandy@sheffield.ac.uk
Specialty section:
This article was submitted to Environmental Materials, a section of the journal Frontiers in Materials
Received:26 February 2019
Accepted:07 June 2019
Published:28 June 2019
Citation:
Gandy AS, Jim B, Coe G, Patel D, Hardwick L, Akhmadaliev S, Reeves-McLaren N and Goodall R (2019) High Temperature and Ion Implantation-Induced Phase Transformations in Novel Reduced Activation Si-Fe-V-Cr (-Mo) High Entropy Alloys. Front. Mater. 6:146. doi: 10.3389/fmats.2019.00146
High Temperature and Ion
Implantation-Induced Phase
Transformations in Novel Reduced
Activation Si-Fe-V-Cr (-Mo) High
Entropy Alloys
Amy S. Gandy1*, Bethany Jim1,2, Gabrielle Coe1, Dhinisa Patel1, Liam Hardwick1,
Shavkat Akhmadaliev3, Nik Reeves-McLaren1and Russell Goodall1
1Department of Materials Science and Engineering, University of Sheffield, Sheffield, United Kingdom,2Department of
Materials, University of Oxford, Oxford, United Kingdom,3Institute of Ion Beam Physics and Materials Research,
Helmholtz-Zentrum Dresden-Rossendorf, Dresden, Germany
For fusion to be realized as a safe, sustainable source of power, new structural materials need to be developed which can withstand high temperatures and the unique fusion radiation environment. An attractive aspect of fusion is that no long-lived radioactive wastes will be produced, but to achieve this structural materials must comprise reduced activation elements. Compositionally complex alloys (CCAs) (also called high entropy alloys, HEAs) are promising candidates for use in extreme environments, including fusion, but few reported to date have low activation. To address these material challenges, we have produced novel, reduced activation, HEAs by arc-melting, and investigated their thermal stability, and radiation damage resistance using 5 MeV Au2+ ion implantation.
Whilst the alloys were designed to form single phase BCC, using room temperature and non-ambientin situX-ray diffraction we have revealed the thermodynamically stable structure of these alloys is in fact a sigma phase. We propose that a BCC phase is formed in these alloys, but at high temperatures (>1000◦C). A BCC phase was also formed during heavy ion implantation, which we propose to be due to the rapid heating and cooling that occurs during the thermal spike, effectively freezing in the BCC phase produced by an implantation induced phase transformation. The BCC phase was found to have high hardness and a degree of ductility, making these new alloys attractive in the development of reduced activation HEAs for nuclear applications.
Keywords: high entropy alloy (HEA), reduced activation, phase transformation, ion implantation, thermal stability, nuclear, radiation damage
INTRODUCTION
wear and corrosion (Yeh et al., 2004; Senkov et al., 2013a), although brittle behavior (Salishchev et al., 2014) and low thermal conductivity (Yan et al., 2018) have also been reported, which are undesirable properties for nuclear applications. Suppression of radiation-induced damage accumulation has recently been observed in several HEA systems (Egami et al., 2014; Xia et al., 2015; Zhang et al., 2015; Lu et al., 2016; Kombaiah et al., 2018). The reported superior properties have highlighted CCAs as candidates for applications in extreme environments, such as plasma facing materials (PFMs) in a fusion reactor. PFMs must be able to withstand neutron fluxes higher than in any current nuclear fission reactor, and maintain their properties whilst subjected to high heat loads. Another critical requirement of potential PFMs is that they have low neutron activation and generate only short-lived (<100 years) radionuclides, following
removal from the fusion core. Absorption of fusion neutrons by some common constituent CCA elements, such as Co and Ni, results in transmutation and production of long-lived radionuclides (Gorley, 2015). Therefore, new CCAs need to be developed which preserve the excellent mechanical properties and radiation stability, whilst meeting the requirement for low activation. To address this challenge, we have produced and investigated two new HEAs from the systems SiFeCrVMo and SiFeCrV; the first forms a more traditional HEA type alloy, with five components, the latter is a reduced activation version of the system without molybdenum. Mo is not a reduced activation element but we employ both these alloys as examples of novel HEAs, to investigate the high temperature thermal stability and radiation damage resistance that can be achieved.
BCC structured metals have been found to display superior resistance to radiation damage compared to FCC metals. Garner et al. (2000)reported that following fast fission reactor neutron irradiation between 400◦C and 550◦C in 304L austenitic (FCC) stainless steel and 9–12%Cr ferritic/martensitic (BCC) steels, the void swelling rate per displacements per atom (dpa) was approximately 50 times higher for the FCC stainless steel compared to BCC ferritic/martensitic steels. Furthermore, radiation-induced defect cluster sizes and densities have been found to differ between FCC and BCC alloys.Zinkle and Snead (2014) reported the formation of significantly higher defect cluster densities in FCC austenitic steel compared to BCC ferritic steels, following low-temperature neutron irradiation. It is hypothesized that the formation of fewer, finely dispersed defect clusters in BCC structured alloys may enable greater defect recombination during dynamical and thermal annealing (Zinkle and Snead, 2014). Furthermore, as radiation-induced embrittlement is due to the pinning of dislocations by defect clusters, the production of fewer defect clusters in BCC alloys is expected to suppress radiation-induced embrittlement, thus extending the lifetime of the alloy in operation.
To date, radiation damage studies on CCAs have mainly focused on FCC structured alloys.Zhang et al. (2015)reported that radiation damage resistance in the NiCoFeCr HEA was due to chemical disorder and compositional complexity, which reduces the electron mean free path and thermal conductivity, leading to much slower energy dissipation and, consequently, slower damage accumulation during ion irradiation. However,
Egami et al. (2015)using a density functional theory approach, reported that atomic-level stresses and local lattice distortion facilitated amorphisation and subsequent recrystallisation of CoFeNi and NiCoFeCr HEAs, resulting in the “wiping-out” of structural defects. More recently, Owen et al. (2017) used total neutron scattering measurements to determine the lattice strain in the equiatomic CrMnFeCoNi HEA, and reported, contrary to the mechanism proposed by Egami et al. (2015), no clear evidence that the local lattice strain was anomalously large. The irradiation stability in the high activation AlxCoCrCuFeNi system was investigated byXia et al.
(2015), who observed enhanced irradiation induced swelling in BCC Al1.5CoCrCuFeNi, compared to FCC Al0.1CoCrCuFeNi,
following 3 MeV Au ion implantation, to 50 dpa, at room temperature, a swelling behavior contrary to other BCC alloys (Zinkle and Snead, 2014). It is evident therefore that the link between CCA composition and structure, and their resistance to radiation damage is not well understood.
In this study, the two alloys (from the systems SiFeCrV and SiFeCrVMo) were computationally designed to produce single-phase BCC alloys, in order to further investigate how BCC structured HEAs respond to radiation damage, produced in this work by 5 MeV Au2+
ion implantation at room temperature. The thermal stability of the alloys was determined by examining changes in crystal-structure and microstructure, using data collected from bulk andin-situmeasurements.
MATERIALS AND METHODS
Design of the Alloys
In order to explore further the behavior of CCAs during irradiation, alloys showing new characteristics are required. With the view that such alloys may be employed in plant for nuclear power generation, a procedure was followed, developed for the design of novel brazing filler metals (Snell, 2017) to attempt to create novel alloys which may have future potential for these applications. This approach uses a Python script written in-house to perform calculations across a large number of potential alloy systems and compositions. Initially, elements of potential interest are selected, which here were the set of elements known to have low neutron activation cross section (Cheng, 1989; Gorley, 2015) plus some additional elements adopting body centered cubic structures at room temperature (Mo, Nb). A preponderance of BCC-stable elements was maintained in the list, intended to drive the preferential formation of this structure, but the search was otherwise deliberately quite wide-ranging, to identify and explore alloys which had not previously been the subject of research. From the full list, the script selects combinations of 4 or 5 of these elements, and calculates, for each possible composition with each element present in a quantity between 5 and 40%, the average atomic size mismatch,δand the enthalpy of mixing,1Hmix. The
average atomic size mismatch,δis defined as:
δ=100
v u u t n X
i=1
ci1−ri ¯ r
2
whereciis the atomic fraction of theith element,riis its radius and the average radius is given by:
¯ r=
n
X
i=1
ciri (2)
The enthalpy of mixing, 1Hmix, is estimated following the
method introduced by Miedema (Miedema, 1973a,b), extended to multicomponent systems by using the coefficients ( ij)
reported inTakeuchi and Inoue (2005)and the equation:
1Hmix=4 n
X
i=1,i<j
cicjij (3)
Once these quantities have been determined, they can be used to rank the likely formation of a single phase alloy in each system. In other work on HEAs particular ranges where favorable compositions are more likely to lie are defined (e.g., Ye et al., 2016). However, as in this wide alloy search with multiple different elements the behavior can be very different, and we further wish to identify the most promising alloys. We have therefore elected to apply different criteria, first setting the limits that 0< 1Hmix<5 kJ/mol, and then, for the alloys that meet
this condition, of minimizing the absolute value of the atomic size mismatch.
The method identified the systems of Si-Fe-V-Cr-Mo and Si-Fe-V-Cr with alloys of the specific composition Si0.05Fe0.35V0.16Cr0.35Mo0.09 and Si0.06Fe0.38V0.18Cr0.38 (atomic
percent, at%) as the optimized compositions, based on this approach. As the procedure carries out this optimization on alloys by varying the composition, it is noteworthy, though not surprising, that the alloys are non-equiatomic in composition (of the type described as Complex Concentrated Alloys, CCAs, rather than equiatomic as entropy-maximizing HEAs will be).
While it must be acknowledged that there are other ways of performing these calculations (e.g., the Miedema enthalpy of mixing can be calculated in several different ways (Gallego et al., 1988; Wang et al., 2007) and other criteria which have been successfully used to predict such alloys (e.g., Poletti and Battezzati, 2014; Leong et al., 2017), we have found that these approaches give a good combination of suitable accuracy to facilitate experimentation, and speed of calculation, even in systems containing unusual pairs of elements where, for example, the lack of data preclude the use of CALPHAD. The approach is not a rigorous prediction, and will not successfully predict optimized alloys in all cases, yet it is nevertheless useful to guide early stage experimental work toward systems which have been little considered.
Alloy Production and Characterization
To produce the alloys, elemental Si, Fe, V, Cr, and Mo (purity> 99.5 %) were weighed to obtain the desired stoichiometry,
and melted using an argon-backfilled vacuum arc melter (MAM1 Buehler). The alloys were re-melted and flipped five times to improve homogeneity. The Si0.05Fe0.35V0.16Cr0.35Mo0.09
alloy composition was produced as a 5 g ingot, and the
Si0.06Fe0.38V0.18Cr0.38alloy composition was produced as a 2.5 g
ingot. The smaller quantity was better adapted to the size of the arc melting equipment used, though 5g was possible and was used to facilitate greater accuracy in weighing out the small level additions (Si and Mo).
Due to the potential for volatilization of elements during arc melting, quantitative analysis of as-produced alloy compositions was conducted by X-ray fluorescence (XRF) using a PANalytical Zetium spectrometer and PANalytical’s Omnian analysis methodology. Small spot mapping was carried out under vacuum with a spot size of 500µm on a minimum of four
random points for each alloy. XRF results were used to calculate an estimate for the theoretical melting temperature (Tm) of the
alloys using the rule of mixtures.
The density of the as-cast alloys was determined using a Mettler Toledo NewClassic MF balance, applying the Archimedes method. Vickers hardness measurements were taken from a minimum of three random locations for each as-cast alloy. The measurements were made using a Zwick-Roell Hardness Tester with loads varying from 5 to 30 kg and a dwell time of 10 s. The variation in load was made to ensure the resultant indent was visible through the×10 magnification view finder without
causing significant damage to the sample. A Nikon Eclipse LV150N optical microscope was used to image hardness indents in greater detail.
To investigate thermal stability, the alloys were sectioned and annealed in a tube furnace under a flowing Ar atmosphere, with a Ti getter, for 48 h at either 0.5 Tm or 0.65 Tm (with Tm the
estimated value as described above). The samples were heated from room temperature, held at temperature for 48 h, and then slow cooled in the furnace.
X-ray diffraction (XRD) was used to determine the crystal structures of as-cast and thermally annealed samples, using a Bruker D2 Phaser with Cu Kαradiation. Phase analysis used the International Center for Diffraction Data’s (ICDD) PDF-4+ database, 2018 edition, and associated SIeve+ software.
Lattice parameters were obtained via least squares refinement using STOE’s WinXPOW software. High temperature XRD
(HTXRD) data was used to investigate temperature induced phase transitions in the SiFeVCr HEA. The alloy was first ball milled in a Retzch GmbH Cryomill to powderise the material. The sample was placed in a 50 ml steel grinding jar, with a 25 mm steel ball used as the grinding organ. Milling was performed over a period of 20 min, in 2 min intervals, and a grinding frequency of 25 Hz was used throughout. A final 2 min milling stage with liquid nitrogen cooling was performed, again with a frequency of 25 Hz. Non-ambient X-ray diffraction data were collected from the powdered alloy in situ, from 30 to 1000◦C under a vacuum of 1.5
× 10−5 mbar, using an Anton Paar HTK1200N furnace
mounted on a PANalytical X’Pert3 Powder diffractometer, using Cu Kα radiation and a PIXcel1D detector, in
Bragg-Brentano geometry.
TABLE 1 |Measured alloy compositions from XRF and EDX, and melting and annealing temperatures calculated using the rule of mixtures and XRF data.
Si (at %) Fe (at %) V (at %) Cr (at %) Mo (at %) Tm (◦C) 0.5 Tm (◦C) 0.65 Tm (◦C)
SiFeVCrMo (XRF) 2.30±0.11 36.90±0.90 14.79±0.17 35.09±0.39 10.92±0.55 1983 991 1289
SiFeVCrMo (EDX) 5.30±0.10 35.23±1.00 16.60±0.40 35.23±0.90 7.37±0.40
SiFeVCr (XRF) 2.16±0.18 42.56±0.48 17.94±0.32 37.33±0.73 0 1963 981 1276
SiFeVCr (EDX) 5.19±0.10 39.69±0.18 18.41±0.18 36.69±0.18 0
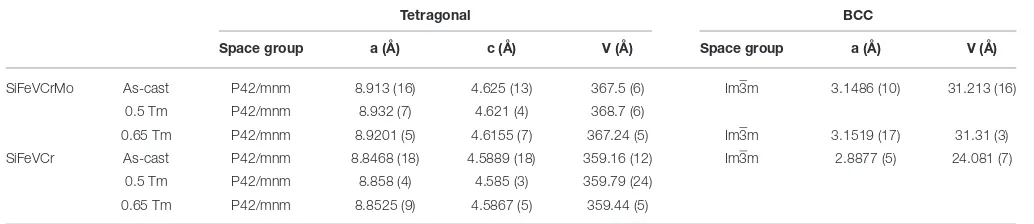
TABLE 2 |Refined structural parameters obtained from standard least squares refinement.
Tetragonal BCC
Space group a (Å) c (Å) V (Å) Space group a (Å) V (Å)
SiFeVCrMo As-cast P42/mnm 8.913 (16) 4.625 (13) 367.5 (6) Im3m 3.1486 (10) 31.213 (16)
0.5 Tm P42/mnm 8.932 (7) 4.621 (4) 368.7 (6)
0.65 Tm P42/mnm 8.9201 (5) 4.6155 (7) 367.24 (5) Im3m 3.1519 (17) 31.31 (3)
SiFeVCr As-cast P42/mnm 8.8468 (18) 4.5889 (18) 359.16 (12) Im3m 2.8877 (5) 24.081 (7)
0.5 Tm P42/mnm 8.858 (4) 4.585 (3) 359.79 (24)
0.65 Tm P42/mnm 8.8525 (9) 4.5867 (5) 359.44 (5)
Dispersive X-Ray (EDX) analysis was used to obtain elemental maps and spectra.
The as-cast SiFeVCrMo alloy was implanted at room temperature with 5 MeV Au2+ ions to a fluence of 5 × 10¹⁵
Au2+ ions per cm2 at the Ion Beam Centre in
Helmholtz-Zentrum Dresden-Rossendorf, Germany. The implantation was carried out using a scanning beam, the beam spot size was about 3–5 mm on the target, the irradiated area was 50 mm in diameter, and the beam was moved fast by scanning in X and Y directions. The ion flux was approximately 1.6 × 10¹¹
Au2+ ions per second per cm2, and the ion beam current
density was about 50 nA/cm2. Prior to implantation, the sample
surface was polished to a mirror finish, first using a range of SiC papers with decreasing grit size, followed by a final polishing stage using colloidal silica. The same method was used to prepare the samples for SEM, XRF and XRD. The implantation induced damage profile was determined using results from the Monte Carlo code SRIM (Ziegler et al., 1985). The calculation type “detailed calculation with full damage cascade” was chosen, a displacement energy, Ed, of 50 eV
was set for each element, and the experimentally determined density of 7.2 g/cm3 was used. Grazing incidence XRD
(GI-XRD) was used to determine the crystal structure of the Au2+ ion implanted SiFeVCrMo sample. In GI-XRD, the penetration depth of the X-rays can be tuned so as to probe only the near-surface implantation-induced damaged region. The X-ray penetration depth was calculated using linear attenuation theory, from which an incident angle of 1.659◦ was determined to correspond to a penetration depth up to 500 nm below the surface, allowing the maximum level of damage produced, as calculated using results from the SRIM simulation, to be probed. GI-XRD of the SiFeVCrMo alloy before and after Au2+ion implantation was performed on a PANalytical X’pert3
diffractometer, using Cu Kαradiation and a PIXcel1D detector
in 0D mode.
RESULTS AND DISCUSSION
Phase Analysis
Quantitative analysis, using XRF, was performed on as-cast alloy specimens. Results are presented in Table 1, and show
reasonable agreement with the targeted alloy compositions, though both alloys are slightly richer in Fe and Cr than anticipated and somewhat Si deficient. From these quantitative results, theoretical melting temperatures were calculated using the rule of mixtures (understanding that this is a very approximate estimation), and used to set the required annealing temperatures (Table 1).
Room temperature XRD data were also collected to characterize the phases present in both the as-cast and thermally annealed alloys. The refined structural parameters obtained from least squares refinement are presented in Table 2. In as-cast
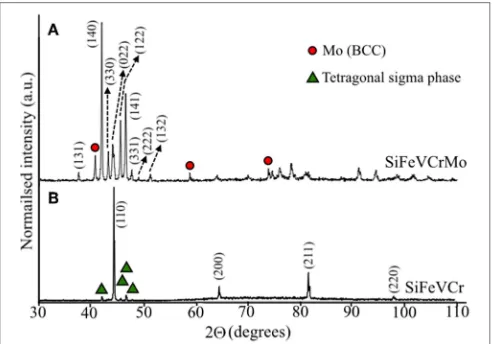
SiFeVCrMo,Figure 1A, most observed Bragg reflections could be indexed on a tetragonal unit cell, in the P42/mnm space
group, with lattice parameters a=8.913 Å, c=4.625 Å. A small
amount of a secondary BCC phase, in the Im3m space group, was also observed, with Bragg peak positions indexing well to Mo, and lattice parameter a=3.1486 Å, identified inFigure 1A
by circles. For as-cast SiFeVCr, Figure 1B, the predominant phase observed was BCC-type, indexing to the Im3m space group, and lattice parameter a=2.8877 Å. A small amount of
secondary tetragonal phase was observed in this sample. This phase, identified by triangles inFigure 1B, could also be indexed
in the P42/mnm space group, with lattice parameter a=8.8468
Å and c=4.5889 Å.
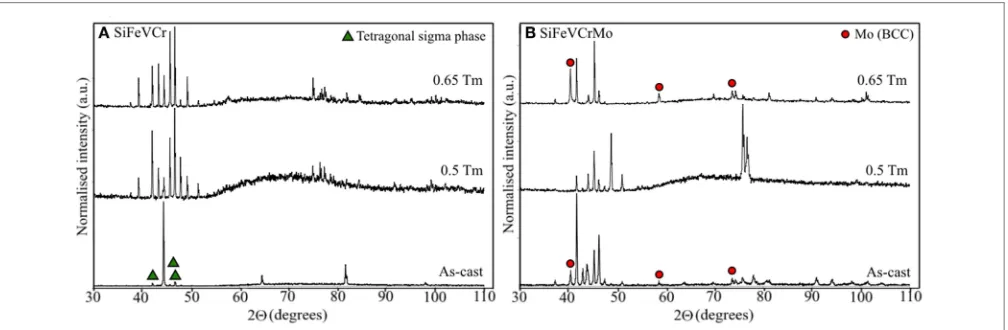
For SiFeVCr, XRD data collected following annealing at either 0.5 Tm(981◦C) or 0.65 Tm(1276◦C),Figure 2A, showed
predominantly a sigma-type phase. For this alloy, Bragg peaks could be well indexed using a P42/mnm unit cell with lattice
parameters a= 8.858 Å, c=4.585 Å for the sample annealed
FIGURE 1 |Room temperature XRD patterns from the as-cast SiFeVCrMo(A)
and SiFeVCr(B)samples. The circles indicate peaks attributed to BCC Mo. The triangles indicate peaks attributed to a tetragonal phase.
annealed at 0.65 Tm. There is no evidence of a BCC cell being
present following the annealing treatment, and no significant change in either peak position or intensity for samples annealed at either 0.5 Tmor 0.65 Tm.
Similarly, no peaks from a BCC-type phase were observed for the SiFeVCrMo sample annealed at 0.5 Tm(991◦C),Figure 2B.
Peaks could again be indexed using a single tetragonal sigma-type unit cell (space group P42/mnm), with lattice parameters
a = 8.932 Å, c = 4.625 Å. However, after annealing at 0.65
Tm(1289◦C) XRD data showed evidence of phase segregation,
with the re-emergence of peaks indexed to a Mo-type BCC phase (space group Im3m, and lattice parameter a = 3.1519
Å), and a significant shifting of peaks from the sigma phase to lower diffraction angles, indicating an increase in the lattice parameters for this phase and most likely a significant change in its composition. In metallic systems, the sigma phase does not have a specific stoichiometry and therefore can exist over a range of compositions (Hall and Algie, 1966). The sample annealed at 0.65 Tmwas indexed to the P42/mnm space group with lattice
parameter a=8.9291 Å and c=4.6155 Å.
From these room temperature data, it was unclear whether the BCC or sigma type phases were most thermodynamically stable, or whether one was a high temperature phase that had been quenched in on cooling. Metastability is observed in HEAs, especially in the small scale samples used for research purposes, such as the discovery of precipitation in CoCrFeNiMn when treated at moderate temperatures for extended times (Pickering et al., 2016). The variation in phase assemblages observed in the as-cast alloys here could be due to differential rates of cooling during alloy production. The SiFeVCrMo alloy was produced as a 5 g ingot, while the SiFeVCr alloy was produced as a 2.5 g ingot. Therefore, the smaller SiFeVCr alloy may have cooled more quickly during casting, effectively enabling the quenching in of a high temperature BCC phase.
To further investigate the thermodynamic stability of the phases observed, HTXRD data were collected under vacuum
on an as-cast SiFeVCr alloy sample that had been powdered by cryomilling (Figure 3). At 30◦C, the data could now be indexed
on a single BCC type unit cell, space group Im3m, with no observable peaks from any tetragonal sigma phase present. On heating, such peaks do begin to appear at 400◦C, and can indeed be indexed using the P42/mnm space group, appearing analogous
to the sigma phase found in FeCr0.5V0.5(Martens and Duwez,
1952). Peaks from a third phase, Cr2O3, appear on heating
from 600◦C, suggesting some level of surface oxidation occurring despite the sample being heated under vacuum. The peaks corresponding to the tetragonal phase become more prominent with increasing temperature, though it is difficult to determine whether a complete transformation from BCC to sigma phase occurs, due to the overlap of peaks at around 65◦2
θfrom the
BCC phase and Cr2O3, and at around 45 and 82◦2θfrom the BCC
and tetragonal phases. There is no evidence of a high temperature tetragonal to BCC phase transition, suggesting that, if it exists, it takes place at temperatures above 1000◦C in this alloy.
Non-ambient XRD data collected on subsequent cooling of the alloy from 1000◦C show peaks from both sigma and Cr
2O3
phases are retained to room temperature, with a slight shift in peaks to higher diffraction angles due to thermal contraction (Figure 4). As with Figure 3, due to overlapping of peaks in
Figure 4, it is difficult to unambiguously determine whether a BCC phase is present and has been retained at room temperature. The alloys were designed to form single phase BCC yet results from XRD data show that the thermodynamically stable phase is a sigma phase. This difference between designed and actual structure is due to the nature of the prediction, which is simplistic to give rapid exploration capability, and is primarily concerned with identifying compatible elements capable of mixing and forming a mutual solid solution. By choosing mostly BCC metals as the input, stability in a BCC form, rather than for example FCC, may be expected to dominate (Leong et al., 2017). However, as sigma phase is known to form in the Si-Fe-Cr and Si-Fe-V ternaries (Hall and Algie, 1966) a more stable option exists in this case: the sigma phase is an even lower energy structure, that is not assessed in our predictive calculations.
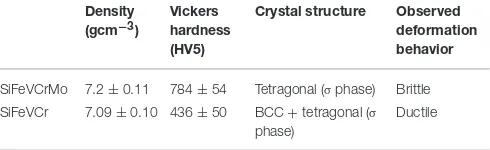
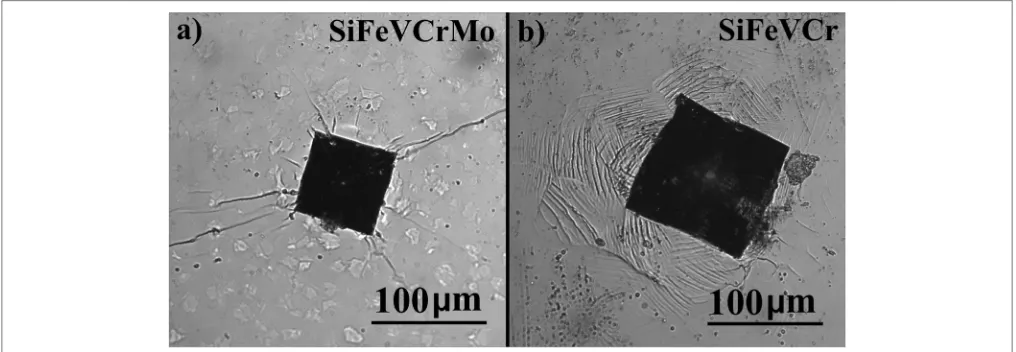
Mechanical Properties
Table 3gives the measured densities and Vickers Hardness values of both as-cast alloys, the crystal structures, as determined by room temperature XRD, and the deformation behavior observed surrounding the hardness indent, shown in the optical images inFigures 5a,b. Whilst the densities of both alloys are similar, 7.20 ± 0.11 gcm−3 for SiFeVCrMo, and 7.09 ± 0.10 gcm−3
for SiFeVCr, the SiFeVCrMo alloy was found to be much harder (784 ± 54 HV5, or 7.69 ± 0.53 GPa) than the
as-cast SiFeVCr alloy (436±50 HV5, or 4.28± 0.49 GPa). The
FIGURE 2 |Room temperature XRD patterns from(A)the SiFeVCr sample after annealing at 0.5 Tm(981◦C) and 0.65 Tm(1276◦C) for 48 h, and from(B)the
SiFeVCrMo sample after annealing at 0.5 Tm(991◦C) and 0.65 Tm(1289◦C) for 48 h. The circles indicate peaks attributed to BCC Mo and triangles to tetragonal
sigma phase.
FIGURE 3 |Non-ambient XRD data from FeSiVCr, showing single-phase BCC at room temperature up to 400◦C; BCC to tetragonal phase transition from
400◦C, and formation of C
r2O3at 600◦C. The triangles indicate peaks
attributed to a tetragonal phase, isostructural with FeCr0.5V0.5. The stars indicate peaks attributed to Cr2O3.
inFigure 5b, suggests ductile deformation during indentation. The sets of parallel lines surrounding the indent in Figure 5b
are therefore determined to be step edges, resulting from the interaction of dislocations with the surface as they propagate on crystallographic slip planes during loading. The hardness values of both alloys are greater than typical for conventional alloys, but are comparable to other HEAs reported. The hardness and yield stress, at room temperature, of as-cast SiFeVCr (BCC
+ σ phase) is comparable to the single-phase BCC structured
refractory Al0.4Hf0.6NbTaTiZr HEA, (Senkov et al., 2014) as well
as to NbTiVZr, NbTiV2Zr, CrNbTiZr and CrNbTiVZr, reported
to have very high Vickers microhardness of 3.29 GPa, 2.99 GPa, 4.10 GPa, and 4.72 GPa, respectively, attributed to the presence of disordered BCC solid solutions (Senkov et al., 2013b). The higher hardness of as-cast SiFeVCrMo (σphase) is comparable
to AlCoCrCuFe, which, after Spark Plasma Sintering, comprises an ordered BCC (B2) phase, Cu rich FCC (FCu) phase and aσ
phase (Praveen et al., 2012).
FIGURE 4 |Non-ambient XRD data collected during cooling to room temperature, from 1000◦C. Peaks from both sigma and Cr
2O3phases are
retained in all data.
Whilst the brittle nature of SiFeVCrMo is undesirable for use as a structural material, the high hardness and ductile behavior of SiFeVCr, as well as it being reduced activation, is promising for the use of this alloy as a plasma facing material. However, the desirable mechanical behavior of SiFeVCr is only observed in the proposed high temperature BCC phase. Further work is required to determine whether the proposed high temperature phase can be stabilized at lower temperatures by, for example, altering the alloy stoichiometry, as has been reported in other HEA systems (Leong et al., 2017). In addition, other mechanical properties, such as toughness, need to be evaluated in order to further develop these alloys.
Microstructure: Morphology
and Stoichiometry
TABLE 3 |Density and Vickers Hardness values of the as-prepared alloys.
Density (gcm−3)
Vickers hardness (HV5)
Crystal structure Observed deformation behavior
SiFeVCrMo 7.2±0.11 784±54 Tetragonal (σphase) Brittle SiFeVCr 7.09±0.10 436±50 BCC+tetragonal (σ
phase)
Ductile
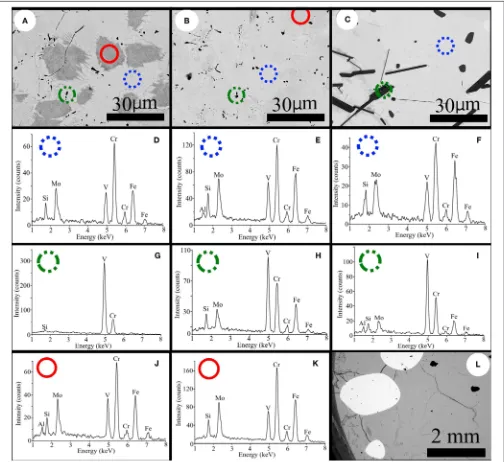
(BSE) and EDX maps and spectra were obtained.Figures 6–8
show the SEM/EDX data collected on the SiFeVCrMo (Figures 6,
7) and SiFeVCr (Figure 8) alloys. The microstructures of the two
as-cast alloys (Figures 6A, 8A,B) show some differences, with the SiFeVCr alloy comprising larger, more well defined regions of different contrast. Figures 6A–C show the microstructures observed in the as-cast, 0.5 Tm, and 0.65 Tm heat treated
SiFeVCrMo alloys, respectively. The contrast in BSE images is due to variations in atomic number, with lighter regions indicating the presence of heavier elements, and darker regions indicative of lighter elements. To aid identification of regions with different contrast, the contrast in the BSE images presented here was enhanced by readjusting gray-scale levels using paint.net. The microstructure of the as-cast alloy (Figure 6A)
and alloy following annealing at 0.5 Tm(Figure 6B) comprises
three regions, shown in the image as light gray, dark gray, and black contrast. It is noted that the contrast variation between light and dark gray regions is not as well defined in the 0.5 Tmheat treated alloy compared to the as-cast alloy, suggesting
the formation of a more homogenous alloy following annealing. Following annealing at 0.6 Tm(Figure 6C), the alloy comprises
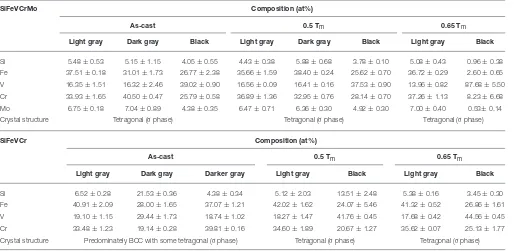
only two distinct regions, defined here as light gray and black. To determine the compositions of the different regions, EDX spot maps were collected in each region, using a spot size of diameter 5µm. The spot size, collection time and magnification were the same for all spectra collected.Table 4gives the average compositions of the phases identified by SEM/EDX. For each phase, data was collected from two locations, with the errors quoted being one standard deviation. The crystal structures as determined by XRD are included for reference. Indicative locations from where the EDX data were collected are shown by the circles on each BSE image, with the blue dotted circles indicating light gray regions, the red solid circles indicating dark gray regions, and the green circles with combined dotted and solid lines indicating black regions. InFigures 6,8, EDX spectra
are presented under the alloys from which they were collected, and circles on each spectrum identify the collection region. In
Figure 6, EDX spectra (d–f) were collected from the light gray regions, (g–i) from the black regions, and (j, k) from the dark gray regions. The Al present in some of the EDX spectra is attributed to contamination during sample preparation where the samples are fixed to an Al sample holder during grinding and polishing.
From the compositional data presented inTable 4, no clear relationship between the light and dark gray phases is evident, with variations in compositions observed within the same phase across samples. The EDX data does indicate that both phases are rich in Fe and Cr, relative to the other elements, and it is clear that the black regions in all three alloys (as-cast, 0.5 Tmand 0.65
Tm) are rich in V, relative to the light and dark gray phases. After
annealing at 0.6 Tm, the V rich phases grow in size, and form
two distinct morphologies, either roughly circular or platelet.
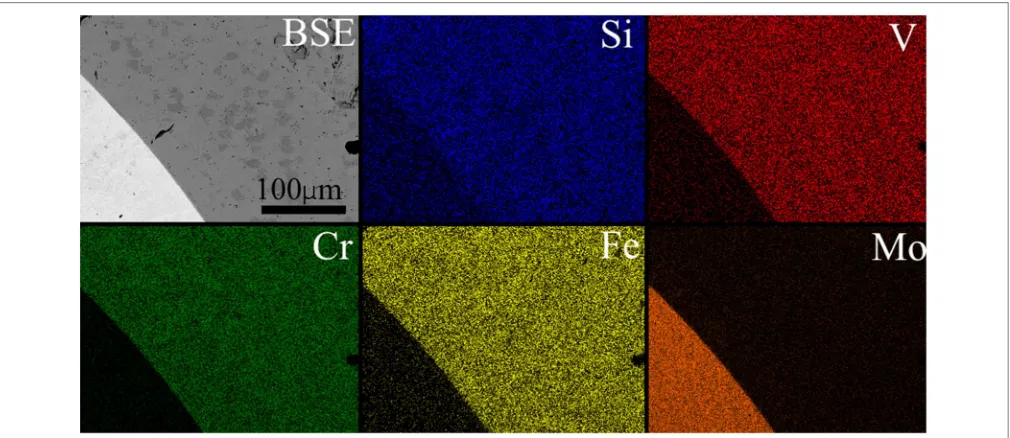
Figure 6L shows a lower magnification BSE image of the as-cast alloy, which clearly shows regions of light contrast.Figure 7
shows elemental maps from this region to show the spatial distribution of elements. The light contrast here is attributed to residual Mo, which did not fully alloy during arc melting. Because of this residual Mo, EDX data was collected from both SiFeVCrMo and SiFeVCr, from an area of approximately 200
µm2, in order to determine the nominal composition of both
HEAs. The data is presented inTable 1, to compare with XRF
data from both alloys. A greater amount of Si is detected by EDX in both HEAs, which we attribute to contamination from the SiC paper used to prepare the sample surfaces for SEM. There is relatively little difference between the concentration of Mo detected by XRF and EDX, suggesting that the random XRF spot maps (with spot size of 500µm) that were collected from the alloy did not intersect any residual Mo.
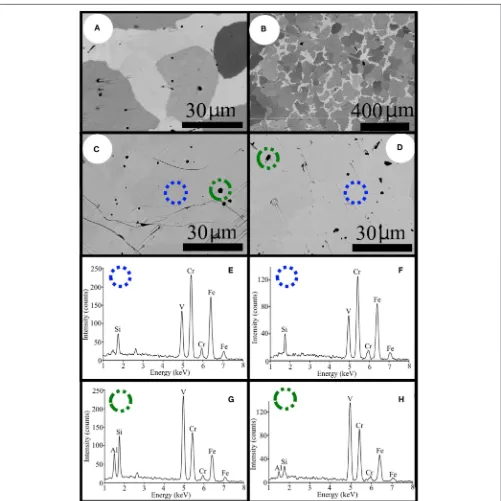
The microstructures of the as-cast, 0.5 Tm and 0.65 Tm
heat treated SiFeVCr alloys are shown in Figures 8A,C,D, respectively. A lower magnification BSE image of the as-cast alloy is given inFigure 8B. Similar to the SiFeVCrMo alloy, the as-cast alloy comprises multiple regions of varying contrast, indicative of the formation of an inhomogeneous alloy. Following annealing at 0.5 Tm and 0.65 Tm, the variations in contrast are reduced,
suggesting some homogenization occurs during annealing. Small black regions are visible in all three alloys that do not grow in size significantly during annealing. EDX spectra from the lighter gray matrix (e) and (f), and the small black regions (g) and (h), are presented for the 0.5 Tmand 0.65 Tmheat treated SiFeVCr alloys.
Quantitative EDX data from all three samples (as-cast, 0.5Tmand
0.65Tm) is presented inTable 4. As with the SiFeVCrMo samples,
the lighter gray regions comprise all five elements and are rich in Fe and Cr, and the black regions are rich in V relative to the other elements.
The room temperature XRD pattern from the as-cast SiFeVCrMo alloy (Figure 1A) and SEM/EDX data suggests that, within the sensitivity of the techniques, a single-phase tetragonal alloy has been produced: whilst extra peaks corresponding to BCC Mo are present, the SEM/EDX data suggests these are attributed to unalloyed Mo. For both SiFeVCrMo and SiFeVCr alloys, whilst the SEM/EDX data show regions of varying contrast indicative of differences in composition, there is no evidence of secondary phases (other than Mo) in the XRD patterns. Sigma phases can form over a range of compositions, therefore it is unsurprising that in SiFeVCrMo and SiFeVCr the structure type remains the same across regions of different compositions, e.g., in both the CrFe-rich and V-rich regions.
Heating the alloys in flowing Ar to 0.5 Tm and 0.65 Tm
resulted in some homogonization of the as-cast morphologies. Furthermore, whilst the small V rich phases present in the SiFeVCrMo alloy grew in size and changed morphology, this growth was suppressed in the SiFeVCr alloy, suggesting Mo somehow aids diffusion of V, or reduces the stability of V in the solid solution. Heating BCC SiFeVCr to above 400◦
FIGURE 5 |Optical microscope images of indentations following Vickers Hardness testing in the as-cast samples, showing evidence of(a)brittle fracture in SiFeVCrMo and(b)ductile behavior in SiFeVCr.
temperature tetragonal to BCC phase transition was observed in the HTXRD data, we conclude that this transition, if it exists, occurs at temperatures >1000◦C. The Fe-V, Fe-Si and Fe-Cr
binary phase diagrams all show BCC phases at high temperatures. The binary Fe-V phase diagram shows the formation of a BCC phase across the entire compositional range at temperatures greater than 1252◦C (Andersson, 1983). In the Fe-rich region of the Fe-Si phase diagram, BCC alloys exist in both ordered (B2 and D03) and disordered (A2) structures (von Goldbeck, 1982a), and in Fe-Cr, the sigma phase transforms into a BCC phase by a congruent reaction BCC↔σat temperatures between 820 and 825◦C (von Goldbeck, 1982b; Mikikits-Leitner et al., 2010; Jacob et al., 2018). It has previously been reported that the α (BCC) to σ phase transition, in an Fe-Cr alloy, was time and temperature dependant, with S-shaped kinetic curves indicative of a nucleation and growth process, with maximum transformation rate at 750◦C (Baerlecken and Fabritius, 1955). Elements such as Si (Yukawa et al., 1972) and Mo (Kubaschewski, 1982) have been found to accelerate theαtoσphase transition.
In this work, peaks corresponding to the sigma phase appear in non-ambient XRD data at 400◦C, increase in intensity and become predominant at 600◦C, compared to the original BCC phase present, indicative of nucleation and growth of the sigma phase within the BCC matrix. The stability of sigma phase at low temperatures, compared to other reported FeCr alloys, could be due to the addition of Si, V and Mo, reducing the activation energy of sigma phase formation, although it is noted that sigma phase is produced at about 500◦C in a 47 wt%Cr alloy, as indicated in the Fe-Cr binary phase diagram.
MeV Au2+Ion Implantation and Grazing Incidence
X-Ray Diffraction
The radiation stability of the as-cast SiFeVCrMo alloy was investigated using 5 MeV Au2+
ion implantation. In order to design a simplified implantation experiment, this alloy was chosen for implantation as it formed as a single phase tetragonal structure which we have determined to be the stable phase in
this alloy system, and had the least amount of V precipitation, compared to the annealed samples. Discrete phases, such as precipitates have been found to alter the radiation damage response of alloys, such as in oxide dispersion strengthened (ODS) steels (Song et al., 2018), where alloys containing nano-particles are produced to improve high temperature mechanical properties of the alloy. The implantation conditions chosen here (5 MeV Au2+ ions implanted at room temperature with 5×10¹⁵ Au2+ ions/cm2) are not representative of the fusion
environment, but, in the absence of accessible fusion neutron irradiation facilities, heavy ions are often used as analogs for energetic particles produced during radioactive decay, including transmutation, such as neutrons or alpha-daughter recoil nuclei. Results from the Monte Carlo code SRIM were used to calculate the damage produced by 5 MeV Au2+ ion implantation, to a fluence of 5× 10¹⁵ Au ions/cm2.Figure 9 shows the damage profile calculated using results from the SRIM simulation. These results indicated that a damaged region extending from the surface to a depth of approximately 900 nm would be produced, with a peak damage of about 30 dpa located at a depth of approximately 400 nm below the surface. GI-XRD was used to determine any ion implantation induced structural modifications up to a depth of approximately 500 nm below the surface of the alloy.Figure 10Ashows the GI-XRD patterns from the ion
implanted sample, with the GI-XRD pattern from the as-cast alloy inFigure 10Bfor comparison. Due to peak broadening due to data collected in grazing incidence, least squares refinement was not performed on the GI-XRD data. However, in agreement with results from room temperature XRD data in Figure 1A,
and by using the SIeve+ software and ICDD database, the
diffraction pattern from the as-cast alloy was found to be analogous to the sigma phase found in FeCr0.5V0.5 (Martens
and Duwez, 1952). The GI-XRD pattern following heavy ion implantation was determined to be analogous to the BCC structured Cr0.6Mn0.4alloy (Pearson and Hume-Rothery, 1953),
FIGURE 6 |Backscattered electron images of SiFeVCrMo(A)as-cast,(B)after annealing at 991◦C (0.5 T
m) for 48 h, and(C)after annealing at 1289◦C (0.65 Tm) for
48 h. EDX spectra(D,G,J)collected from the as-cast sample,(E,H,K)from the sample annealed at 0.5 Tm, and(F,I)from the sample annealed at 0.65 Tm. A low
magnification image of the as-cast alloy is shown in(L).
During ion implantation, elastic interactions between Au2+ ions and atoms in the alloy results in numerous atomic displacements. The displacement energy, Ed, is the energy
required to displace an atom from its lattice site by an energetic particle. If the energy transferred from the Au2+ ion to an atom in the alloy is greater than Ed, then the atom will be
displaced from its position and travel through the lattice. This displaced atom, called the primary knock-on atom (PKA), can go on to displace a significant number of other atoms in the alloy, if it has sufficient energy. Each elastic interaction results in the transference of kinetic energy from the PKA to other
atoms, until the PKA and displaced atoms have energy less than Ed. This process is called a collision or displacement
FIGURE 7 |Lower magnification backscattered electron image of as-cast SiFeVCrMo, with elemental maps showing the special distribution of elements.
The resultant implantation induced damage can take many forms, depending on the sample material, implanted ion species and energy, and temperature of the sample during ion implantation. Radiation enhanced diffusion results in phase separation and transformation in many alloys (Doyle et al., 2018), including the formation of a secondary brittle Ni3Al phase
following 5 MeV Ni+ ion implantation in the Ni-12.8 at%Al solid solution (Rehn, 1982), and can result in stress corrosion cracking in irradiated stainless steel due to Cr diffusion away from grain boundaries (Hackett et al., 2009). During radiation enhanced diffusion, atoms of different atomic sizes can diffuse at different rates and by different mechanisms (vacancy- or interstitially-mediated) leading to the local rearrangement of atoms, and the formation of regions either rich or depleted in certain elements. Due to the local change in composition, solubility limits may be exceeded and the formation of secondary phases occurs. Secondary phase formation has been observed in the Al0.12NiCoFeCr HEA following Ni+ ion implantation at
500◦C up to 100 dpa (Kombaiah et al., 2018).
Implantation induced phase transformations have been observed in Ni2Al3, following Xe or Ne ion implantation at
liquid nitrogen temperatures (Nastasi and Meyer, 1991). Ni2Al3
has a trigonal crystal structure, which transforms upon ion implantation to an ordered cubic phase, NiAl, which possess a CsCl structure. The phase transition is reported to be driven by the similarity in the crystal structures, possessed by Ni2Al3 and NiAl, and the ordering of Ni vacancies in Ni2Al3
and disordering of vacancies in NiAl. Displacement of atoms during ion implantation results in the loss of vacancy ordering, transforming the Ni2Al3in NiAl.
Implantation induced amorphisation has been observed in some metallic systems, including 2 MeV proton irradiated
Zr−1.6Sn−0.6Nb−0.2Fe−0.1Cr to a dose of 8.2 dpa
(Shen et al., 2014) and Zr(Fe,Cr)2 precipitates in Zircaloy-4,
during 2 MeV proton irradiation to 5 dpa at a temperature of 310◦C (Zu et al., 2005). Whilst, ion implantation induced amorphisation has not been directly observed in HEAs, it has been proposed as a damage recovery mechanism. Egami et al. (2014) reported that, due to local strain facilitating amorphisation, both local melting and recrystallization occur more easily in HEAs during the thermal spike. They suggest that this rapid recrystallization wipes out implantation induced structural defects, making HEAs radiation damage resistant.
It is clear that ion implantation-induced damage can take on many forms in alloys, e.g., secondary phase formation and phase segregation, crystal structure transformations, and ultimately amorphisation. In absence of any evidence of ion implantation induced amorphisation in SiFeVCrMo, we propose that an implantation induced sigma to BCC phase transition occurred, similar to that seen in Ni2Al3, rather than the
FIGURE 8 |Backscattered electron images of SiFeVCr,(A,B)as-cast,(C)after annealing at 981◦C (0.5 T
m) for 48 h, and(D)after annealing at 1276◦C (0.65 Tm) for
48 h. EDX spectra(E,G)collected from the sample annealed at 0.5 Tm, and(F,H)from the sample annealed at 0.65 Tm.
CONCLUSION
The thermal stability and radiation damage resistance of novel high entropy alloys, one comprising solely reduced activation elements, have been examined using 5 MeV Au 2+ ion implantation, room temperature andin situXRD, and SEM/EDX analysis. It was found that for both alloys the thermodynamically
TABLE 4 |Summary of crystal structures as determined by XRD and phase compositions as determined by SEM/EDX.
SiFeVCrMo Composition (at%)
As-cast 0.5 Tm 0.65 Tm
Light gray Dark gray Black Light gray Dark gray Black Light gray Black
Si 5.48±0.53 5.15±1.15 4.05±0.55 4.43±0.38 5.88±0.68 3.78±0.10 5.08±0.43 0.96±0.38
Fe 37.51±0.18 31.01±1.73 26.77±2.38 35.66±1.59 38.40±0.24 25.62±0.70 36.72±0.29 2.60±0.65
V 16.35±1.51 16.32±2.46 39.02±0.90 16.56±0.09 16.41±0.16 37.53±0.90 13.96±0.82 87.68±5.50
Cr 33.93±1.65 40.50±0.47 25.79±0.58 36.89±1.36 32.95±0.76 28.14±0.70 37.26±1.13 8.23±6.68
Mo 6.75±0.18 7.04±0.89 4.38±0.35 6.47±0.71 6.36±0.30 4.92±0.30 7.00±0.40 0.53±0.14
Crystal structure Tetragonal (σphase) Tetragonal (σphase) Tetragonal (σphase)
SiFeVCr Composition (at%)
As-cast 0.5 Tm 0.65 Tm
Light gray Dark gray Darker gray Light gray Black Light gray Black
Si 6.52±0.28 21.53±0.36 4.38±0.34 5.12±2.03 13.51±2.48 5.38±0.16 3.45±0.30
Fe 40.91±2.09 28.00±1.65 37.07±1.21 42.02±1.62 24.07±5.46 41.32±0.52 26.86±1.61
V 19.10±1.15 29.44±1.73 18.74±1.02 18.27±1.47 41.76±0.45 17.68±0.42 44.56±0.45
Cr 33.48±1.23 19.14±0.28 39.81±0.16 34.60±1.89 20.67±1.27 35.62±0.07 25.13±1.77
Crystal structure Predominately BCC with some tetragonal (σphase) Tetragonal (σphase) Tetragonal (σphase)
FIGURE 9 |Calculated damage profile, in displacements per atom (dpa), and range of implanted Au2+ions, in ions/cm2, from SRIM simulation of 5 MeV
Au2+ion implantation to a fluence of 5×10¹⁵Au ions/cm2.
was found to have desirable mechanical properties, based on hardness measurements and observation of the indents. As the BCC phase was formed at high temperatures as well as under ion irradiation, these alloys represent promising developments in the search for reduced activation alloys for advanced nuclear systems.
DATA AVAILABILITY
The datasets generated for this study are available on request to the corresponding author.
FIGURE 10 |Room temperature grazing incidence XRD patterns from SiFeVCrMo, before(B)and after(A)room temperature ion implantation with 5 Mev Au2+ions, to a fluence of 5×10¹⁵Au2+ions/cm2, showing the transformation from tetragonal to BCC following ion implantation.
AUTHOR CONTRIBUTIONS
AG and RG contributed conception and design of the study. DP produced the alloys. GC and BJ undertook sample preparation, SEM and XRD. DP, GC, BJ, and NR-M indexed XRD patterns. NR-M performed the HT-XRD. LH powderised the SiFeVCr sample. SA performed the Au2+
contributed to manuscript revision, read and approved the submitted version.
ACKNOWLEDGMENTS
The authors would like to acknowledge the financial support of the EPSRC Centre for Doctoral Training in Advanced Metallic Systems (EP/L016273/1). AG would like to acknowledge funding from EPSRC grant EP/R021864/1. RG would like to acknowledge a Fellowship supported by the Royal Academy of
Engineering under theRAEng/Leverhulme Trust Senior Research Fellowshipsscheme. This work has been carried out within the framework of the EUROfusion Consortium and has received funding from the Euratom research and training programme 2014–2018 under grant agreement No 633053. The views and opinions expressed herein do not necessarily reflect those of the European Commission. This research was performed in part at the MIDAS Facility, at the University of Sheffield, which was established with support from the Department of Energy and Climate Change.
REFERENCES
Andersson, J. O. (1983). A thermodynamic evaluation of the iron-vanadium system.Calphad7, 305–315. doi: 10.1016/0364-5916(83)90010-X
Baerlecken, E., and Fabritius, H. (1955). Umwandlungskinetik der Sigma phase in einer Eisen-Chrom-Legierung mit 48% Chrom.Arch. Eisenhuttenw. 26, 679–686. doi: 10.1002/srin.195502095
Cheng, E. T. (1989). “Activation cross-sections for safety and environmental assessments of fusion reactors,” in Proceedings of a Specialists Meeting on Neutron Activation Cross Sections for Fission and Fusion Energy Applications
(Argnonne National Laboratory).
Doyle, P. J., Benensky, K. M., and Zinkle, S. J. (2018). Modeling the impact of radiation-enhanced diffusion on implanted ion profiles.J. Nucl. Mater.509, 168–180. doi: 10.1016/j.jnucmat.2018.06.042
Egami, T., Guo, W., Rack, P. D., and Nagase, T. (2014). Irradiation resistance of multicomponent alloys. Metall. Mater. Trans. A 45:180. doi: 10.1007/s11661-013-1994-2
Egami, T., Ojha, M., Khorgolkhuu, O., Nicholson, D. M., and Stocks, G. M. (2015). Local electronic effects and irradiation resistance in high-entropy alloys.JOM
67, 2345–2349. doi: 10.1007/s11837-015-1579-1
Gallego, L. J., Somoza, J. A., Alonso, J. A., and Lopez, J. M. (1988) Prediction of the glass formation range of transition metal alloys.J. Phys. F18, 2149–2157. doi: 10.1088/0305-4608/18/10/006
Garner, F. A., Toloczko, M. B., and Sencer, B. H. (2000). Comparison of swelling and irradiation creep behavior of fcc-austenitic and bcc-ferritic/martensitic alloys at high neutron exposure. J. Nucl. Mater. 276, 123–142. doi: 10.1016/S0022-3115(99)00225-1
Gorley, M. J. (2015). Critical Assessment 12: prospects for reduced activation steel for fusion plant. Mat. Sci. Technol. 31, 975–980. doi: 10.1179/1743284714Y.0000000732
Hackett, M. J., Busby, J. T., Miller, M. K., and Was, G. S. (2009). Effects of oversized solutes on radiation-induced segregation in austenitic stainless steels.J. Nucl. Mater.389, 265–278. doi: 10.1016/j.jnucmat.2009.02.010
Hall, E. O., and Algie, S. H. (1966). The sigma phase.Metallurg. Rev.11, 61–88. doi: 10.1179/095066066790138257
Jacob, A., Povoden-Karadeniz, E., and Kozeschnik, E. (2018). Revised thermodynamic description of the Fe-Cr system based on an improved sublattice model of the σ phase. Calphad 60, 6–28. doi: 10.1016/j.calphad.2017.10.002
Kombaiah, B., Jin, K., Bei, H., Edmondson, P. D., and Zhang, Y. (2018). Phase stability of single phase Al0.12CrNiFeCo high entropy alloy upon irradiation.
Mater. Design160, 1208–1216. doi: 10.1016/j.matdes.2018.11.006
Kubaschewski, O. (1982).Iron Binary Phase Diagram. Düsseldorf: Springer Verlag. Leong, Z., Wróbel, J. S., Dudarev, S. L., Goodall, R., Todd, I.., and Nguyen-Manh, D. (2017). The effect of electronic structure on the phases present in high entropy alloys.Sci. Rep.7:39803. doi: 10.1038/srep39803
Lu, C., Niu, L., Chen, N., Jin, K.e., Yang, T., Xiu, P., et al. (2016). Enhancing radiation tolerance by controlling defect mobility and migration pathways in multicomponent single-phase alloys. Nat. Comms. 7:13564. doi: 10.1038/ncomms13564
Martens, H., and Duwez, P. E. (1952). Phase relationships in the iron-chromium-vanadium system.Trans. Am. Soc. Met44:484.
Miedema, A. R. (1973a). A simple model for alloys I: rules for the alloying behaviour of transition metals.Phil. Tech. Rev.33, 149–160.
Miedema, A. R. (1973b). A simple model for alloys II: the influence of ionicity and the stability and other physical properties of alloys.Phil. Tech. Rev.33, 196–202. Mikikits-Leitner, A., Sepiol, B., Leitner, X., Cie´slak, J., and Dubiel, S. M. (2010). Investigation ofσ-to-α-phase transition in Fe-Cr.Phys. Rev. B82:100101. doi: 10.1103/PhysRevB.82.100101
Nastasi, M., and Meyer, J. W. (1991) Thermodynamics and kinetics of ion-induced phase transformations.Mat. Sci. Rep.6:51. doi: 10.1016/0920-2307(91)90003-6 Owen, L., Pickering, E. J., Playford, H. Y., Stone, H. J., Tucker, M. G., and Jones, N. G. (2017). An assessment of the lattice strain in the CrMnFeCoNi high-entropy alloy.Acta Mater.122, 11–18. doi: 10.1016/j.actamat.2016.09.032
Pearson, W. B., and Hume-Rothery, W. (1953). The constitution of Cr-Mn alloys below 1000 degree C.J. Inst. Metals81, 311–314.
Pickering, E. J., Muñoz-Moreno, R., Stone, H. J., and Jones, N. G. (2016). Precipitation in the equiatomic high-entropy alloy CrMnFeCoNi.Script. Mater.
113, 106–109. doi: 10.1016/j.scriptamat.2015.10.025
Poletti, M. G., and Battezzati, L. (2014) Electronic and thermodynamic criteria for the occurrence of High Entropy Alloys in metallic systems.Acta Mater.75, 297–306. doi: 10.1016/j.actamat.2014.04.033
Praveen, S., Murty, B. S., and Kottada, R. S. (2012). Alloying behavior in multicomponent AlCoCrCuFe and NiCoCrCuFe high entropy alloys.Mater. Sci. Eng. A534, 83–89. doi: 10.1016/j.msea.2011.11.044
Rehn, L. E. (1982). “Surface modification and radiation induced segregation,” in
Metastable Materials Formation by Ion Implantation, eds S. T. Picraux and W. J. Choyke (New York, NY: Elsevier Science), 17–33.
Salishchev, G. A., Tikhonovsky, M. A., Shaysultanov, D. G., Stepanov, N. D., Kuznetsov, A. V., Kolodiy, I. V., et al. (2014). Effect of Mn and V on structure and mechanical properties of high-entropy alloys based on CoCrFeNi system.J. Alloys Compound.591, 11–21. doi: 10.1016/j.jallcom.2013. 12.210
Senkov, O. N., Senkova, C., Woodward, C., and Miracle, D. B. (2013b). Low-density, refractory multi-principal element alloys of the Cr–Nb–Ti– V–Zr system: microstructure and phase analysis. Acta Mater. 61:1545. doi: 10.1016/j.actamat.2012.11.032
Senkov, O. N., Senkova, S. V., Miracle, D. B., and Woodward, C. (2013a). Mechanical properties of low-density, refractory multi-principal element alloys of the Cr–Nb–Ti–V–Zr system. Mater. Sci. Eng. A 565, 51–62. doi: 10.1016/j.msea.2012.12.018
Senkov, O. N., Senkova, S. V., and Woodward, C. (2014). Effect of aluminum on the microstructure and properties of two refractory high-entropy alloys.Acta Mater. 68, 214–228. doi: 10.1016/j.actamat.2014.01.029
Shen, H. H., Peng, S. M., Xiang, X., Naab, F. N., Sun, K., and Zu, X. T. (2014). Proton irradiation effects on the precipitate in a Zr-1.6Sn-0.6Nb-0.2Fe-0.1Cr alloy.J. Nucl. Mater. 452:335. doi: 10.1016/j.jnucmat.2014.05.042
Skirloa, S. A., and Demkowicz, M. J. (2012). The role of thermal spike compactness in radiation-induced disordering and Frenkel pair production in Ni3Al. Script.
Mater.67, 724–727. doi: 10.1016/j.scriptamat.2012.06.029
particles under ion-irradiation at 550◦C.
J. Nucl. Mater. 502, 76–85. doi: 10.1016/j.jnucmat.2018.02.007
Takeuchi, A., and Inoue, A. (2005) Classification of bulk metallic glasses by atomic size difference, heat of mixing and period of constituent elements and its application to characterization of the main alloying element.Mater. Trans.46, 2817–2829. doi: 10.2320/matertrans.46.2817
von Goldbeck, O. K. (1982a). “Fe-Si,” in Binary Phase Diagrams (Berlin, Heidelberg: Springer-Verlag), 136–139.
von Goldbeck, O. K. (1982b). “Fe-Cr,” in Binary Phase Diagrams (Berlin, Heidelberg: Springer-Verlag), 31–34.
Wang, W. C., Li, J. H., Yan, H. F., and Liu, B. X. (2007). A thermodynamic model proposed for calculating the standard formation enthalpies of ternary alloy systems.Script. Mater.56, 975–978. doi: 10.1016/j.scriptamat.2007.01.044 Xia, S. Q., Yang, X., Yang, T. F., Liu, S., and Zhang, Y. (2015). Irradiation
resistance in AlxCoCrFeNi high entropy alloys. JOM 67, 2340–2344. doi: 10.1007/s11837-015-1568-4
Yan, J., Liu, F., Ma, G., Gong, B., Zhu, J., Wang, X., et al. (2018). Suppression of the lattice thermal conductivity in NbFeSb-based half-Heusler thermoelectric materials through high entropy effects. Script. Mater. 157, 129–134. doi: 10.1016/j.scriptamat.2018.08.008
Ye, Y. F., Wang, Q., Lu, J., Liu, C. T., and Yang, Y. (2016) High-entropy alloy: challenges and prospects. Mater. Today 19, 349–362. doi: 10.1016/j.mattod.2015.11.026
Yeh, J. W., Chen, S. K., Lin, S. J., Gan, J. Y., Chin, T. S., Shun, T. T., et al. (2004). Nanostructured high-entropy alloys with multiple principal elements: novel alloy design concepts and outcomes. Adv. Eng. Mater. 6, 299–303. doi: 10.1002/adem.200300567
Yukawa, N., Hida, M., Imura, T., Kawamura, M., and Mizuno, Y. (1972). Structure of chromium-rich Cr-Ni, Cr-Fe, Cr-Co, and Cr-Ni-Fe alloy particles made by evaporation in argon.Metall. Trans. 3:887. doi: 10.1007/BF02647663 Zhang, Y.,Stocks, G. M., Jin, K., Lu, C., Bei, H., Sales, B. C., et al. (2015). Influence
of chemical disorder on energy dissipation and defect evolution in concentrated solid solution alloys.Nat. Commun. 6:8736. doi: 10.1038/ncomms9736 Ziegler, J. F., Biersack, J. P., and Littmark, U. (1985).The Stopping and Range of
Ions in Solids. New York, NY: Pergamon Press. Available online at: http://www. srim.org/
Zinkle, S. J., and Snead, L. L. (2014). Designing radiation resistance in materials for fusion energy. Annu. Rev. Mater. Res. 44, 241–267. doi: 10.1146/annurev-matsci-070813-113627
Zu, X. T., Sun, K., Atzmon, M., Wang, L. M., You, L. P., Wan, F. R., et al. (2005). Effect of proton and Ne irradiation on the microstructure of Zircaloy 4.Philos. Mag. 85:649. doi: 10.1080/14786430412331320017
Conflict of Interest Statement: The authors declare that the research was conducted in the absence of any commercial or financial relationships that could be construed as a potential conflict of interest.