Int. J. Electrochem. Sci., 11 (2016) 2595 - 2611
International Journal of
ELECTROCHEMICAL
SCIENCE
www.electrochemsci.org
Monitor the Processes of Ice Film Disappearance under a
Stimulant Convection Condition and Absorption Ethanol Vapor
to Ice by a Quartz Crystal Microbalance
Lei Yu1, Xiaolong Ma2, Ting Wu2,Yangyang Ma2, Dazhong Shen, Qi Kang2,*
1
Department of Chemical Engineering and Environment, Weifang University of Science and Technology, Weifang 262700, P. R. China.
2
College of Chemistry, Chemical Engineering and Materials Science, Collaborative Innovation Center of Functionalized Probes for Chemical Imaging in Universities of Shandong, Key Laboratory of Molecular and Nano Probes, Ministry of Education, Shandong Provincial Key Laboratory of Clean Production of Fine Chemicals, Shandong Normal University, Jinan 250014, P. R. China.
*
E-mail: qikang@sdu.edu.cn
Received: 24 January 2016 / Accepted: 19 February 2016 / Published: 1 March 2016
In this work, the processes of ice film disappearance under a stimulant convection conditions and absorption to ethanol vapor to ice film were monitored by a quartz crystal microbalance (QCM) technique. The influence of the thickness of ice film on the response of the QCM was investigated by an impedance analysis method. It is shown that part of freshly prepared amorphous ice film on QCM is disappeared gradually during a stimulant convection process at -18 C. We report a mulriple resonance phenomenon in QCM with unsymmetrical mass loading. The shape of the conductance-frequency spectrum of QCM depends on the thickness and distribution of the ice film deposited. After adsorption of ethanol vapor, the rigidity of the ice film is decreased gradually. With a large amount of ethanol adsorbed, the ice film is dissolved and evaporated completely. The QCM is a useful tool to monitor the mass and rigidity change of ice film.
Keywords: Quartz crystal microbalance; Unsymmetrical mass loading; Ice film; Adsorption
1. INTRODUCTION
on a quartz oscillator’s electrode(s) and the associated frequency shift (F), i.e, the so-called Sauerbrey equation in Eq.(1).
A m f
f
2
0 6
10 26 .
2 (1)
where f0 and A are the fundamental frequency and the electrode area of the QCM, respectively.
It has been successfully demonstrated the applications of QCM in gaseous sensors [2-4], electrochemistry [5-8], biosensors [9-14] and processes investigation [15,16]. In liquid phase measurements, the QCM is not a simple mass sensor, but provides valuable information about reactions and conditions at the liquid/solid interface [17, 18].
Ice is one of the most prevalent condensed phases present in the Earth’s atmosphere. The physics and chemistry of ice surfaces has attracted considerable research interest in such diverse areas of science as environmental, interstellar, and biological chemistry [19-25]. Snow or ice represents an important environment in the atmosphere and on the earth’s surface due to the fact that they play an important role in the storage and reactions of environmentally relevant trace gases [26]. A study of molecular adsorption on ice surface is important from an environmental chemistry point of view. Various methods, such as FTIR [27-30], X-ray photoelectron spectroscopy [29], ellipsometry [30], molecular dynamics simulation [31-33], ice chromatographic [34], Raman microscopy [35], coated-wall flow-tube [36], were employed to study the adsorption of gas molecules to ice. In most of the works related to the adsorption of gas molecules onto ice interface [37-43], the experimental conditions of very low temperature and pressure, which are similar to those in the troposphere of the Earth, were used. Some applications of QCM in the mass transfer at ice interface were reported. For example, Mason and Dash measured the mass transfer between two ice films in the processes of ice-ice collisions under a simulant thunderstorm electrification [44]. In the works of Delval and Rossi [45,46], the kinetics of condensation and evaporation of H2O from pure ice in the range 173–223 K and the
influence of monolayer amounts of HNO3 on the evaporation rate of H2O over ice in the range 179–
208 K were studied under the pressure condition of vacuum. The sputter yield of ice molecules at the ice/vacuum interface in a secondary ion mass spectrometry was measured [47,48].
2. EXPERIMENTAL
2.1. Setup for investigation of the stability of ice film
A schematic representation of the experimental setup for investigation the stability of ice film is presented in Fig.1A. The setup was mounted in a refrigerator (BCD-215KA, Hair, China). AT-cut 5 MHz piezoelectric quartz crystals with 14 mm wafer diameter (Model JA5, Beijing Chenjing Electronics Co., Ltd., China) were used. Two silver electrodes (key-hole configuration, geometric area = 0.407 cm2 ) were deposited on both sides of the quartz wafer. To obtain a homogeneous ice film on the surface of the silver electrodes, QCM was immersed in 5 mM dopamine solution for 4 h to form a hydrophilic polydopamine layer. The QCM was mounted horizontally in the freezing room in a refrigerator. The temperature in the area near the ice film was recorded by a digital thermometer. The electrodes of QCM were connected to a precision impedance analyzer (Agilent 4294A) by coaxial-cable. A user program written in Visual Basic 6.0 was used to acquire and process the impedance data. To obtain the picture of the ice film, a digital video was put about 2 cm above the quartz crystal. And an LED light was employed to illumine the ice film. A plastic pipe with inner diameter of 5 mm was employed to deliver humid air flow for ice film deposition. The thickness of ice film was controlled by the interval of blowing wet air flow. The shifts in frequency and motional resistance were recorded to estimate the stability and rigidity of ice film.
5 1 2
3
6
A B
5 8 7
4
[image:3.596.85.513.407.584.2]9
Figure 1. Schematic drawing of experimental setup employed for the ice film disappearance (A) and adsorption measurements (B) (not to scale). (1) digital thermometer; (2) digital video; (3) LED light; (4) humid air flow: (5) QCM with ice film; (6) mini fan; (7) microsyringe with ethanol ;(8): adsorption box with outside ice wall; (9) filter paper .
resolvability of the impedance data, the conductance (G) –frequency spectrum was measured in several successive scans if needed.
2.2 Monitor the adsorption of the vapor of ethanol on ice film by QCM
Prior to the fabrication of ice film, the QCM was frozen in an adsorption box (120 mL) with outside ice wall (Fig.1B) at -18 C for 20 min. Then the cold QCM was in contact with the humid air at room temperature to obtain a homogeneous thin water film. Immediately, the QCM was froze again in the box for 4 h to form firm ice film on the surface of QCM. Whereafter, a given volume of precooled ethanol was injected in the adsorption box by a microsyringe. The adsorption process of ethanol vapor on the ice film was monitored by QCM in an impedance analysis method. The shifts in frequency and motional resistance were recorded to estimate the thickness of ice film.
3. RESULTS AND DISCUSSION
3.1 Influence of the thickness of ice film on its disappearance behavior
In the attempt to investigate the stability and adsorption behavior of ice film, we deposited an ice film on the surface of QCM by a freezing method illustrated in Fig.1A. Under our experimental conditions, part of tiny water drops in the humid air flow were expected to condensate firstly on the surface of QCM. Then the water layer was froze further to an ice film. With increasing blowing time, more water was condensated. As shown in Fig.2A, the resonant frequency of the QCM was decreased immediately upon contact with the humid air flow. With a blowing time of 3,6 and 9 s, the resonant frequency of the QCM was decreased by 1.66, 5.43 and 15.3 kHz in 30, 44 and 69 s, respectively. The decrease in the frequency was due to the deposition of ice film on the surface of QCM. According to the Sauerbrey equation, the corresponding thickness of the ice film is 0.32, 1.05 and 2.95 m, respectively. However, the increase in frequency was observed in the late stage of freezing process, revealing that part of the ice film was disappeared gradually, especially in the case of thin film (curve a). When the frequency reached a stable level again, the residual ice film is 4%, 27% and 59% of the initial one deposition with the blowing time of 3, 6, and 9 s, respectively.
the surface of the QCM. As the maximum of Rq is less than 380 , we can conclude that the initial
deposition layer is the composite of water and ice.
F
(
k
H
z
)
-18 -12 -6 0
Rq
(
)
0 80 160 240
m/
t (
g
.cm
-2 .min -1 )
-400 0 400 800
4 min
4 min
4 min 3
5
3
10
A
B
C
a b
c a
b
c
a b c
[image:5.596.99.498.131.553.2]Time
Figure 2. Changes of the resonant frequency (A) , motional resistance (B) and mass deposition rate (C) during the freezing process. Blowing time for humid air flow: (a): 3 s, (b): 6 s; (c): 9 s.
With increasing blowing time, the area and thickness of the water/ice composite were enlarged. And the duration of the water in the composite is 41, 59 and 78 s in curves a,b,and c, respectively.
In the measurement of a QCM sensor, an ultrathin, homogeneous and rigid film is needed in the calculation of mass change by the Sauerbrey equation. In the initial deposition stage, the water/ice composite is non-rigid, the mass and viscous models of the QCM were measured.
2 / 1 2
/ 3
0 [ ]
q q
viscous f
F
(2)
Where η and ρ are the viscosity and density of the liquid, respectively, and µq and ρq are the
elastic modulus and the density of the quartz, respectively.
Muramatsu et al. [50] showed that the change in motional resistance, Rq, of QCM in contact
with a liquid phase can be expressed by
2 2 / 1 0
2
K f A
Rq
(3)
where η and ρ are the viscosity and density of the liquid, respectively, K2 is the electromechanical coupling factor.
To estimate the mass of the ice film, the frequency shift from the viscous response of water layer was corrected by using the correlation between Rq and Fviscous in Eq.(2) and (3). Under our
experimental conditions, Fviscous= 2.157Rq was obtained in a group of glycerol aqueous solutions in
concentration range of 0 to 50%. And the corrected frequency (F - Fviscous) was used to calculate the
mass change on the surface of QCM. As can be seen in Fig.2C, the amount of ice deposited was increased with increasing rate, which is due to the transform of non-rigid water layer to rigid ice film in the initial freezing stage.
It is well known that the melting point of ice is 0 C. But the freshly deposited ice film was lost at a considerable rate even at the temperature of -18 C. The loss of the ice film may be due to the loose structure of the initial ice film. It is possible that an amorphous ice film (like hoarfrost) was formed on the surface of QCM. Because the interaction between the ice microcrystals in the ice film is relatively weak, part of them were shed by the airflow in the freezing room. The airflow may be caused by the blowing air flow or the temperature difference near the QCM in the condensation and freezing stages. As the freezing time prolonged, the loose hoarfrost film was transformed gradually to compact ice film, the intensity of airflow was weakened. Hence, the stability of the resultant ice film was enhanced. Another possible reason is due to the sublimation of ice film. It was reported the ice layers of 2-30 nm deposited on the Pt(111) and graphite (0001) surfaces is sublimated even at 145-150 K under high vacuum and the sublimation rate depends strongly on the underlying substrate [51]. The kinetics of condensation and evaporation of H2O from pure ice in the range 173–223 K was
investigated by QCM [45].
3.2 Responses of QCM in the situation of heavy and unsymmetrical mass loading
To observe how the ice film was disappeared from the surface of the QCM, a digital video was mount above the quartz crystal (Fig.1A). But the transparence of ice makes it difficult to view a thin ice film. For the consideration of view ice film, a thicker ice film was prepared by spreading water film on the electrode surface of QCM.
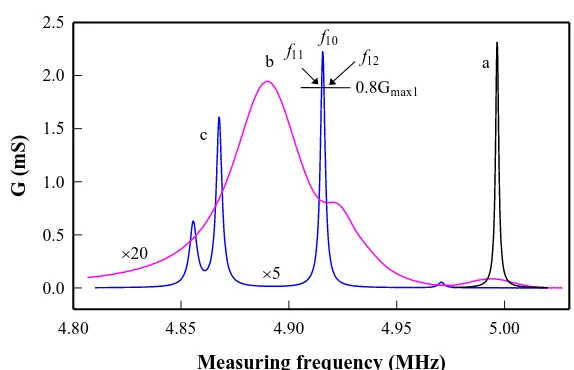
increased to 393 kHz, which is about 22 times of that in curve 1. The maximum conductance and corresponding frequency were reduced to 0.097 mS and 4.9103 MHz, respectively.The damping of the resonant peak is due mainly to the increase in the viscosity of the super-cooling water layer.
Measuring frequency (MHz)
4.80 4.85 4.90 4.95 5.00
G
(m
S)
0.0 0.5 1.0 1.5 2.0 2.5
a b
c
20
5 f10
0.8Gmax1
f12
f11
Figure 3. Typical conductance-frequency spectra of the QCM during the freezing process of spread thin water film. (a) initial water film in freezing room (t=0); (b) mixture of water and ice films (t=105 s) ; (c) initial ice film (t=122 s)
As the freezing time was prolonged, the temperature of QCM was expected to decline further until to reach itssurrounding temperature. Then the super-cooling water layer was changed to an ice film rapidly. As a result, the rigidity of the loading film was increased abruptly and the interaction between ice film and the surface of QCM was much enhanced. Interestingly, the previous chunky resonant peak was replaced suddenly by a group of small symmetrical resonant peaks in the conductance-frequency curve (curve 3). Due to the limit of scan rate of the impedance analyzer, the detailed responses of QCM in intermediate stage between two scans (from a chunky resonant peak to mulriple resonant peaks) were missed. The mechanism of mulriple resonance of the QCM a relatively thick ice film is not clear. We assume it may be related to the overloading and asymmetrical distribution of ice film on the surface of QCM.
However, if a thicker water layer (ca. 0.7 mm) was spread, the response of the QCM is much different.Upon freezing, the resonant frequency and peak height are reduced gradually. The appearance of ice crystal in the liquid layer is indicated by the abrupt decrease in the resonance. With ice film formed, the conductance-frequency curve is unsymmetrical and the frequency at Gmax is even 17.3 kHz
[image:7.596.153.440.160.345.2]
experimental conditions, the resonance of QCM was decreased further until became undetectable after a freezing time of 10 min (data are not shown).
To test the influence of airflow on the stability of the prepared ice film, a mini fan was mounted in corner of the freezing room to generate a continuous cold breeze. Fig. 4 shows a group of typical responses of QCM and the corresponding picture of the ice film during the simulant convection process. Before the convection operation, the electrode surface was covered fully by an ice film and five resonant peaks and three shoulder peaks were observed in the frequency region from 4.5~5.1 MHz (Fig.4A). Because the difficulty to prepare two identical ice films by the spread method, the conductance-frequency spectrum in Fig.4A is different to that of curve 3 in Fig.3.
Frequency (MHz)
4.5 4.6 4.7 4.8 4.9 5.0 5.1
G (m
S)
0.00 0.15 0.30 0.45
A
t = 0
Frequency (MHz)
4.5 4.6 4.7 4.8 4.9 5.0 5.1
G (m
S)
0.00 0.15 0.30 0.45
Frequency (MHz)
4.5 4.6 4.7 4.8 4.9 5.0 5.1
G (
m
S)
0.00 0.15 0.30 0.45 0.60
C
t = 9.6 min
t = 85 min
F Frequency (MHz)
4.5 4.6 4.7 4.8 4.9 5.0 5.1
G
(m
S
)
0.0 0.2 0.4 0.6 0.8
D
t = 20 min
Frequency (MHz) 4.7 4.8 4.9 5.0
G
(m
S
)
0.0 0.5 1.0 1.5 2.0 2.5
E
t = 36 min
Frequency (MHz) 4.97 4.98 4.99 5.00
G
(m
S)
0 5 10 15 20
B
t = 2.2 min
[image:8.596.128.466.259.712.2]
In the presence of the continuous cold airflow in the freezing room, two small defects occurred in the initial ice hoarfrost film (arrows in Fig.4B). The defects were ascribed to the disappearance of the ice film by the airflow. As the breezing time increased, the area of the defects in the ice film was enlarged gradually and the resonant peaks were shifted to higher frequency with increasing intensity (Fig.4C). In Fig.4D, 39.5 % of the ice film was disappeared, the strongest peak among five resonant peaks was shifted to 4.945 MHz with a height of 759 S. After a convection time of 36 min, 62.8% of the ice film was shed, and four resonant peaks were detected (Fig.4E). The significant increase in the intensity of the resonant peaks may be due the disappearance of the ice film in the center part of the electrode. After a convection time of 85 min, the ice film was invisible in the picture in Fig.4F, only one peak with the height of 18.5 mS was observed. On the other hand, the resonant frequency is 3358 Hz lower than that of the initial blank QCM, indicating that a tiny ice layer is remained on the surface of QCM. This thin ice layer was not detected by the video because its transparency.
3.3 The information analysis of QCM in the condition of peak cleavage
When a thick and uneven ice film was deposited on the surface of QCM, as discussed above, the normal single resonant peak of QCM was split to a group of small peaks. During the disappearance process of the ice film, the frequency and intensity of the peaks were increased significantly. Hence, it is possible to monitor the mass change of the ice film by QCM. However, such film does not meet the prerequisite in the Sauerbery equation. To explore such possibility, the resonant frequencies of the small peaks were estimated from the conductance-frequency spectrum based on an equivalent circuit model in Fig.5A. In this model, a group of resonators in a parallel combination was employed to describe the resonance of QCM under the non-ideal conditions. The resonators denoted by 1,2 …n with decreasing intensity. These resonators were assumed to distribute in different areas on the quartz crystal disc.
R1 L1
C1
R2 L2
C2
Rn Ln
Cn .
. . . . . C0
Rq Lq
Cq C0
B A
Figure 5. Equivalent circuit models of quartz resonator with mulriple resonance (A) and classical fitting model of QCM in impedance analyzer (B).C0 Rq, Lq and Cq are the static capacitance,
motional resistance, motional inductance and motional capacitance of the QCM with single resonant peak , respectively. Ri, Li and Ci (i=1, 2 , , n) are the motional resistance, motional
[image:9.596.107.473.516.687.2]
The resonance of the quartz crystal disc is related to the interaction of all the resonators, which are dependent and influenced each other. Obviously, if a rigid, uniform and ultra-thin mass loading film is deposited on the surface of QCM, the equivalent circuit parameters of all the resonators are the same. The equivalent circuit model in Fig.5A is returned to that in Fig.5B, which is the normal equivalent circuit model for QCM.
According to the model in Fig.5A, the conductance of the primary resonant peak (L1C1R1
branch), G1, is expressed as
2 1 2 1 1 1 X R R G
(4)
where, 1 1 1 1 C L X
, =2f,f is measuring frequency, R1、L1、C1 are motional resistance,
motional inductance and motional capacitance of primary resonator, respectively.
As can be seen in Eq.(4), G1 has the maximum of Gmax1=1/R1 at the point of X1 = 0.
Accordingly, the resonant frequency of the primary resonator (f10) is expressed by
1 1 10 2 1 C L f
(5)
To estimate the equivalent circuit parameters of the resonator, two frequencies corresponding to the height of 0.8Gmax1, f11 and f12, were measured (see Fig.3,curve c ). And an iterative algorithm
was used to separate the resonant peaks and possible shoulder peaks [54]. The three equivalent circuit parameter in the motional branch of primary resonator are calculated by:
1
max1
1
R G
(6)
2 10 1 max 11 12 1 ) ( f G f f C
(7)
) (
2 12 11
1 1 f f R L
(8)
Then the values of G1 at the measuring frequencies were calculated by Eq.(4), and were
deducted from the total conductivity-frequency curve. The residual conductance-frequency curve was used to estimate the equivalent circuit parameters of resonator 2 (L2C2R2 branch). This process was
continued until the equivalent circuit parameters of all the resonators were estimated. In the following iterative cycles, the equivalent circuit parameters were used as the initial values to deduct the conductance of other peaks from the total conductivity-frequency spectrum. The parameters of the target resonant peak were calculated again until stable values were obtained.
Time (min)
0 20 40 60 80 100
Frequ
ency (
MHz
)
4.6 4.7 4.8 4.9
5.0 1
2 3
4 5
Figure 6. Frequency change of resonant peaks during the simulant convection process. The numerals corresponds to the resonant peaks in Fig.4A. The experimental conditions are the same as Fig.4.
In this work, the averaged resonant frequency with the square of the peak height,F0, is calculated by
i i i
G f G
F 2
max 0 2 max
0 (9)
where fi0 and Gmaxi are the resonant frequency and height of the ith peak, respectively. The
weighting factor of Gmax2 i emphasizes the contribution of the stronger resonant peak toF0.
Fig.7 shows the changes of F0 and the area of hoarfrost film (Aice) on the electrode surface of QCM during the stimulant convection process. With the increasing convection time, the value of Aice
was decreased, the value of F0 was increased due to the decrease in mass loading. With the value of F0 of the blank QCM as the reference, the follow regressed relation was obtained:
F0 (kHz) =F0F0= 6.83 443.8Aice (cm
2
) ( r2= .976) (10)
[image:11.596.111.477.101.339.2]
Time (min)
0 25 50 75 100
F (
MHz
)
4.85 4.90 4.95 5.00
A ic
e
(cm
2 )
0.0 0.1 0.2 0.3 0.4 F0
29.2
m
cold airflow
Figure 7. Change in averaged resonant frequency of QCM and residual area of ice film on the electrode surface during the simulant convection process. The experimental conditions are the same as Fig.4.
3.4 Monitor the interaction of ice film and ethanol vapor by QCM
In this experiment, the strategy of condensation water film on the surface of the QCM was employed to prepare ice film. When the thermal equilibrium was reached, a homogeneous and thin ice film was deposited on both sides of the QCM, which was indicated by the response of QCM. Under the conditions used, a single symmetrical sharp resonant peak was observed. The motional resistance of the QCM with a rigid ice film is in the range of 30~50. The thickness of the prepared ice film was dependent on the contact time to the moisture.
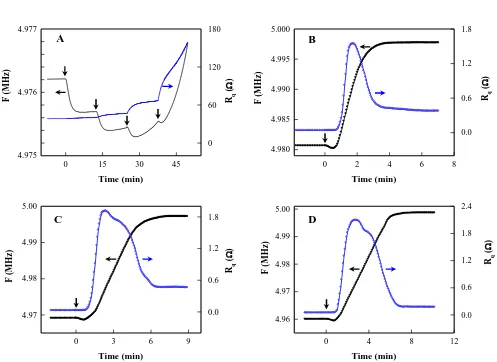
Fig. 8 shows simultaneously recorded F and Rq of QCM with ice film during the absorption process of
ethanol vapor on the ice film. As shown in Fig.8A, the initial resonant frequency of the QCM with ice film is 4.9762 MHz, which corresponds to the ice film with the total thickness of 4.26 m. When a small volume of 2 l ethanol was added in the adsorption box, the decrease in F reveals the increase in mass loading due to the adsorption of ethanol vapor on the ice film. Under the experimental condition used, F was decreased 512 Hz in 5 min while the value of Rq was unchanged. In the last stage of
adsorption, a slight increase in F at an averaged rate of 2.1 Hz/min was observed. In the second addition of 2 l ethanol, the value of F decreased another 292 Hz in 4 min then increase at an averaged rate of 6.5 Hz/min. The value of Rq increased by 5.2 in this process. In the third addition of 2l
ethanol, F decreased initially 151 Hz then increased at an average rate of 33.7 Hz/min. The increase in Rq is 18.2 in this stage. The increase in F and Rq is more obvious in the forth addition of 2 l
ethanol. After 4 min, the frequency is even higher than that with initial ice film before ethanol addition. The increase in F and Rq reveals that part of ice film was dissolved during absorption the
[image:12.596.121.474.93.312.2]
and formaldehyde on ice film was preformed at low concentration of adsorbate under much lower timperture [55].
Time (min)
0 15 30 45
F (MHz ) 4.975 4.976 4.977 Rq ( ) 0 60 120 180 Time (min)
0 2 4 6 8
4.980 4.985 4.990 4.995 5.000 0.0 0.6 1.2 1.8 Time (min)
0 3 6 9
4.97 4.98 4.99 5.00 0.0 0.6 1.2 1.8 Time (min)
0 4 8 12
[image:13.596.51.548.130.492.2]4.96 4.97 4.98 4.99 5.00 0.0 0.6 1.2 1.8 2.4 F (MHz ) Rq ( ) F (MHz ) F (MHz ) Rq ( ) Rq ( ) A C B D
Figure 8. Change in resonant frequency and motional resistance of QCM with ice film during the absorption of ethanol vapor to ice film. The adown arrows indicate the addition of ethanol into the absorption box. Amount of ethanol in an injection: (A) 2 L; (B) 50 L; (C) 50 L; (D) 50 L.
Fig.8B,C and D show the changes in F and Rq of the QCM with ice film during the absorption
of ethanol of higher concentration. In this experiment, 50 l ethanol was added in the absorption box. With the value of F0 in the blank QCM as the reference, the initial frequency shifts in Fig.8 B,C and D
are -19.56, -31.13 and -40.21 kHz, which corresponds to the total thickness of ice film of 3.46, 5.51 and 7.12 m, respectively. It can be seen that F decreased to a minimum then increased rapidly until approached the stable values, which are less than the value of F0 in the blank QCM. On the other hand,
Rq increased sharply until a maximum then decreased to a plateau. As the thickness of ice film
increased, the maximum of Rq increased.
Fig.9 illustrates the corrections of F and Rq of the QCM during the absorption process. Three
types of F vs Rq were observed. Hence, the response of QCM was the combination of the mass and
mass effect due to the adsorption of ethanol on ice film is the main response model. In the middle absorption stage (b-c), both of F and Rq increased rapidly. This result indicates that the ice film was
dissolved by the interaction of ice film and ethanol vapor. The transform of a rigid ice film to a liquid film resulted in the decrease in the mass loading, which was indicated by the increase in F. The increase in Rq is due to the dissolution of part of ice film, which increased in energy loss from the
oscillating QCM surface.
F (MHz)
4.955 4.965 4.975 4.985 4.995 5.005
R q
(k
)
0.0 0.6 1.2 1.8 2.4
b a c
d 1
[image:14.596.122.469.200.434.2]2 3
Figure 9. Correlation between the resonant frequency and motional resistance of QCM with ice film during the absorption process of ethanol vapor to ice film. Amount of ethanol added was 50 L. Thickness of initial ice film: (1) 3.76m; (2) 6.01m; (3) 7.72 m.
In contact mechanics and evaporation studies with the QCM, the influence of the contact area of a liquid drop on the response were investigated [56-60]. The dependence of frequency and bandwidth on film thickness and contact area is described within a sheet-contact model [61]. In the absorption process of ethanol vapor to ice film, the interfaces of electrode/liquid and ice/liquid were occurred on the surface of the QCM due to the dissolution of part of the ice film. Hence, the influence of the contact area on the response of QCM was added in the following equations.
2 / 1 2
/ 3 0 2 1
] [
) (
q q A
f A A F
(11)
2
2 / 1 0 2
1 ) 2
(
K f A A
Rq
(12)
Where A1 and A2 are the contact area in the interfaces of electrode/liquid and ice/liquid,
respectively.
With increasing the amount of ice film dissolved, the values of A1 and A2 increased, which
resulted in the increase in Rq and an additional decrease in F. As shown in Fig.8, the maxima of Rq are
-18 C. Although the concentration of ethanol in the liquid film was unknown, it is reasonable to consider that there is A1+A2 <A even at the maximum of A1+A2. After separation the frequency shifts
caused by the viscous effect by the slope of F/Rq= -2.157 Hz/, the averaged thickness of the ice
film can be estimated from the frequency shifts from the mass effect. Obviously, the mass effect has much more significantly impact on the frequency change of the QCM. It is shown that the maxima of Rq occurred at the points with 73.5%, 43.3% and 32.7% of ice film dissolved in the QCM with initial
ice film thickness of 3.46, 5.51 and 7.12 m, respectively.
In the shrinkage stage (c-d), the increase in F and decrease in Rq were observed. The decrease
in Rq is due to the reduce in A1+A2. With increase in the amount of ice film dissolved, the value of A2
was expected to decrease. It should be noted that the value of A1 may be decreased by the shrinkage
and volatilization of the liquid film. Because the liquid film is the mixture of water and ethanol, which has lower icing temperature and higher volatility than water. In fact, there was an ice film on the wall of the absorption box. After adding ethanol on the filter paper, the vapor of ethanol was preferentially absorbed by the ice film on QCM because the shorter diffusion distance. As the contact time increased, the concentration of ethanol vapor in the area near the QCM was reduced due to the diffusion and absorption by the ice film on the wall. Hence, part of the liquid film was volatilized by the action of concentration difference. As a result, the total contact area of the solid/liquid interface decreased. Thus, Rq decreased while F increased rapidly. If all of the ice film on the surface of electrode was
dissolved (A2=0), the response of QCM was due to the change in contact area of the liquid film. But
the averaged values of F/Rq in the late shrinkage stage are= -4.36, -5.32 and -7.75 Hz/, in the
samples with initial ice film thickness of 3.46, 5.51 and 7.12 m, respectively. This result reveals that the frequency shifts are caused by both the mass and viscous even in the late shrinkage stage. As the residual liquid film on electrode surface was related to the variable surface tension, the stable value of F and Rq were different for each ice film. Under the conditions in Fig.8, the stable values are 4.9977,
4.9972 and 4.9987 MHz for the resonant frequency, 377, 461 and 173 for motional resistance in QCM with the initial ice film thickness of 3.46, 5.51 and 7.12 m, respectively. It can be seen that stable values of F are less than F0 of the blank QCM and the value of Rq are larger obviously than that
of QCM with the initial ice film. Hence, a small residual liquid film was expected to reserve on the electrode surface after the addition of ethanol in the adsorption box.
4. CONCLUSIONS
of the QCM is split to a group of small resonant peaks in a broad span of frequency. During a stimulant convection process, the thin ice film was disappeared gradually and irregularly, the resonant peaks moved to higher frequency with increasing intensity. The small peaks were merged gradually to one strong peak. The averaged resonant frequency of the peaks with the square of intensity as the weighting factor is in a near-linear correlation with the area of the ice film. The Sauerbrey equation may be applicable in the case with mulriple resonance. By the strategy to condense water film on the electrode surface, a homogeneous ice film is deposited. At the temperature of -18 C, the ice film is dissolved partly or entirely after absorption of ethanol vapor. During the absorption process, the response of QCM with ice film is the combination of mass and viscous effect. For the QCM with an ice film of 7.12 m, the averaged slopes of Rq vs F are -0.0013, 0.159 and -0.0894 /Hz in the stages
of initial adsorption, middle dissolution and late shrinkage and volatilization, respectively.
ACKNOWLEDGEMENTS
The authors gratefully acknowledge financial support of National Natural Science Foundation of China (21275091, 21175084, 21575080).
References
1. G. Sauerbrey, Z. Phys., 155(1959)206.
2. N. Andreeva, T. Ishizaki, P. Baroch, N. Saito, Sens. Actuators B, 164 (2012) 15. 3. J. Xie, H. Wang, M Duan, Sens. Actuators B, 203 (2014) 239.
4. N. C. Speller,N. Siraj,B. P. Regmi,H. Marzoughi,C. Neal and Isiah M. Warner, Anal. Chem., 87(2015)5156.
5. X. Jia, L. Tan, Q.J. Xie, Y.Y. Zhang, S.Z. Yao, Sens. Actuators B, 134 (2008) 273.
6. M. D. Levi, N. Levy, S. Sigalov, G. Salitra, D. Aurbach, J. Maier, J. Am. Chem. Soc., 132 (2010)13220.
7. J. John, K. M. Hugar, J. ivera- el ndez, H. A. Kostalik, IV, Eric. D. Rus, H.S. Wang, G.W. Coates and H. . bru a, J. Am. Chem. Soc., 136(2014)5309.
8. N. Shpigel, M. D. Levi, S. Sigalov, O. Girshevitz, D. Aurbach, L. Daikhin, N. Jäckel and V. Presser, Angew.Chem. Int.Ed., 54(2015)12353.
9. G.N.M. Ferreira, A.C. da-Silva, B. Tom , Trends Biotechnol.,27 (2009) 689. 10.C. I. Cheng, Y.P. Chang and Y.H. Chu, Chem. Soc. Rev., 41(2012)1947.
11.Q.J. Liu, C.S. Wu, H. Cai, N. Hu, J. Zhou and P. Wang, Chem. Rev.,114(2014)6423. 12.Y.Q. Luo, T. Liu, J.M. Zhu, L.Y. Kong, W. Wang and L.Tan, Anal. Chem.,87(2015)11277. 13.F. Ma,A. Rehman,H. Liu,J.T. Zhang,S.L. Zhuand X.Q. Zeng, Anal. Chem., 87(2015)1560. 14.Y.P. Zhou and Q.J. Xie, Sens. Actuators B, 223 (2016) 9.
15.B. Liu, M. Tu and R. A. Fischer, Angew. Chem. Int. Ed., 52(2013)3402. 16.L.S. Liu, J.M. Kim and W.S. Kim, Anal. Chem., 87(2015)3329.
17.Q.J. Xie, J. Wang, A.H. Zhou, Y.Y. Zhang, H.W. Liu, Z.N. Xu, Y. Yuan, M.Y. Deng, S.Z. Yao, Anal. Chem., 71 (1999) 4649
18.I. Reviakine, D. Johannsmann and R. P. Richter, Anal. Chem.,83(2011) 8838.
19.Z.Q. Zhang, J.Y. Ye, P. Sun, Y. Yuan, Y.H. Tong, J.M. Hu, Y.H. Shao, Anal. Chem., 74 (2002)1530.
20.S. N. Wren, D. J. Donaldson, J. Phys. Chem. Lett., 2 (2011) 1967.
22.S. N. Wren , D. J. Donaldson, J. Phys. Chem. C, 116 (2012)1017. 23.P. Pirzadeh, P. G. Kusalik, J. Am. Chem. Soc., 135(2013)7278.
24.H. Watanabe, T. Otsuka, M. Harada, T Okada, J. Phys. Chem. C, 118 (2014)15723. 25.H.M. Wei,Y.Wei, X.Y. Lin, P. Liu, S.S. Fanand K.L. Jiang, Nano Lett., 15(2015)1843. 26.T. P. Liyana-Arachchi, K. T. Valsaraj, F. R. Hung, J. Phys. Chem. A, 116(2012) 2519. 27.S. Haq, J. Harnett, A. Hodgso, J. Phys. Chem. B, 106 (2002) 3950.
28.Ó. Gálvez, B. at , V. J. Herrero, R.Escribano, Icarus, 197 (2008) 599. 29.J. T. Newberg and H. Bluhm, Phys. Chem. Chem. Phys., 17(2015) 23554. 30.M. H. Kuo, S. G. Moussa and V. F. McNeill, J. Phys. Chem. C,118(2014)29108. 31.B. Collignon, S. Picaud, Chem.Phys. Letts, 393 (2004) 457.
32.T. P. Liyana-Arachchi, K. T. Valsaraj, F. R. Hung, J. Phys. Chem. A,115 (2011)9226. 33.S Picaud, P Jedlovszky, Chem. Phys. Lett. ,600 (2014)73.
34.Y. Tasaki ,T. Okada, J. Phys. Chem. C, 112 (2008) 2618.
35.M. Muro, M. Harada, T. Hasegawa, T. Okada, J. Phys. Chem. C , 116(2012)13296. 36.T. Bartels-Rausch, T. Huthwelker, H. W. Ga1ggeler, M. Ammann, J. Phys. Chem. A, 109
(2005)4531.
37.P. Behr, A. Terziyski, and R. Zellner, J. Phys. Chem. A, 110 (2006) 8098.
38.P. Parent, J. Lasne, G. Marcotte and C. Laffon, Phys. Chem. Chem. Phys.,13(2011)7142. 39.P. Ayotte, P. Marchand, J. L. Daschbach, R. S. Smith, B. D. Kay, J. Phys. Chem. A, 115
(2011)6002.
40.E. Park, D. H. Lee, S. Kimand H. Kang, J. Phys. Chem. C, 116(2012) 21828.
41.A.Symington, L.M.Leow, P.T. Griffiths, R. A.Cox, J. Phys. Chem. A, 116(2012)5990. 42.M. Szo ri and P. Jedlovszky, J. Phys. Chem. C,118(2014)3599.
43.I.Sumi,S. Picaud and P. Jedlovszky, J. Phys. Chem. C, 119(2015)17243. 44.B.L. Mason, J.G. Dash, , J. Geophys. Res., 105 (2000) 10185.
45.C. Delval, M. J. Rossi,Phys.Chem.Chem.Phys., 6 (2004) 4665. 46.C. Delval, M. J. Rossi, J. Phys. Chem. A, 109 (2005) 7151.
47.A. Wucher, S.X. Sun, C. Szakal, N. Winograd, Anal. Chem., 76 (2004)7234. 48.C. Szakal, J. Kozole, N. Winograd, Appl. Surf. Sci., 252 (2006) 6526.
49.K.K. Kanazawa, J.G. Gordon, Anal. Chim. Acta, 117 (1985) 99. 50.H. Muramatsu, E. Tamiya, I. Karube, Anal. Chem., 60 (1988) 2142.
51.P. Lörfgren, P. hlstöm, .V. Chakarov, J. Lausmaa and B. Kasemo, Surf. Sci.,367 (1996) L19. 52.V.Tsionsky, L. Daikhin, D. Zagidulin, M. Urbakh and E. Gileadi, J. Phys. Chem. B,107 (2003)
12485.
53.A. Kaverin, V. Tsionsky, D. Zagidulin, L. Daikhin, E. Alengoz and E. Gileadi, J. Phys. Chem. B 108(2004) 8759.
54.L. Meng, X.C. Zhao, R. Sheng, P. Zhang, Q. Kang, D.Z. Shen, Sens. Actuators B, 147 (2010) 566. 55.A. K. Winkler, N. S. Holmes and J. N. Crowley, Phys. Chem. Chem. Phys., 2002, 4(2002) 5270. 56.C. M. Flanigan, M. Desai, K. R. Shull, Langmuir, 16 (2000)9825
57.M. J. Joyce, P. Todaro, R. Penfold,S. N. Port, J. A. W. May, C. Barnes, A. J. Peyton, Langmuir, 6(2000)4024.
58.N. T. Pham, G. McHale, M. I. Newton,B. J. Carroll, S. M. Rowan, Langmuir, 20(2004)841. 59.F. N. Nunalee , K. R. Shull, Langmuir, 20(2004)7083.
60.H. Zhuang,P. Lu, S. P. Lim, H. P. Lee, Langmuir, 23(2007)7392. 61.M. Kunze, K. R. Shull, D. Johannsmann, Langmuir, 22(2006)169.