Contents lists available atScienceDirect
Biosensors and Bioelectronics
journal homepage:www.elsevier.com/locate/bios
A screen-printed paper microbial fuel cell biosensor for detection of toxic
compounds in water
Jon Chouler
a,b, Álvaro Cruz-Izquierdo
c, Saravanan Rengaraj
a, Janet L. Scott
c,
Mirella Di Lorenzo
a,⁎aDepartment of Chemical Engineering, University of Bath, Bath BA2 7AY, United Kingdom
bEPSRC Centre for Doctoral Training in Sustainable Chemical Technologies, University of Bath, Bath BA2 7AY, United Kingdom cDepartment of Chemistry, University of Bath, Bath BA2 7AY, United Kingdom
A R T I C L E I N F O
Keywords:
Microbial fuel cell Biosensor Paper electronics Water quality Formaldehyde
A B S T R A C T
Access to safe drinking water is a human right, crucial to combat inequalities, reduce poverty and allow sus-tainable development. In many areas of the world, however, this right is not guaranteed, in part because of the lack of easily deployable diagnostic tools. Low-cost and simple methods to test water supplies onsite can protect vulnerable communities from the impact of contaminants in drinking water. Ideally such devices would also be easy to dispose of so as to leave no trace, or have a detrimental effect on the environment. To this aim, we here report thefirst paper microbial fuel cell (pMFC) fabricated by screen-printing biodegradable carbon-based electrodes onto a single sheet of paper, and demonstrate its use as a shock sensor for bioactive compounds (e.g. formaldehyde) in water. We also show a simple route to enhance the sensor performance by folding back-to-back two pMFCs electrically connected in parallel. This promising proof of concept work can lead to a revolutionizing way of testing water at point of use, which is not only green, easy-to-operate and rapid, but is also affordable to all.
1. Introduction
The provision of clean water is essential to allow economic growth and environmental sustainability (WWAP (United Nations World Water Assessment Programme), 2015). Nonetheless, in many poor areas of the world, access to safe water is still a luxury (Ongley, 2001). In countries that lack suitable infrastructure, the assessment of water quality is a real challenge (Sarpong Adu-manu et al., 2017). Along with effective sanitation and wastewater treatment programs, it is extremely im-portant to establish methods for water quality analysis that do not re-quire expensive laboratory equipment and/or skilled personnel yet provide rapid response and have onsite functionality (Palaniappan et al., 2010).
In recent years, microbial fuel cell (MFC) technology has demon-strated promising potential as a tool for water quality monitoring (Chouler and Di Lorenzo, 2015). MFCs are devices that directly convert the chemical energy contained in organic matter into electricityviathe metabolic processes of microorganisms (Allen and Bennetto, 1993; Potter, 1911). On the anode surface of these devices, a biofilm develops,
which contains electroactive bacteria capable of extracellularly trans-ferring the electrons they generate from the oxidation of organic compounds to the electrode. The current generated by MFCs can, therefore, be directly related to the metabolic activity of these anodic bacteria (Di Lorenzo et al., 2014). Any disturbances to their metabolic pathways, caused by environmental changes, such as organic load, or the sudden presence of a bioactive and toxic compound, are translated into a change in the electricity generated (Di Lorenzo et al., 2009; Stein et al., 2010). This is the principle behind the use of MFCs as a tool to detect the presence of toxicants in water (Jiang et al., 2015). The major advantage of MFC-based sensors for water quality monitoring over other devices suggested in the literature is their simplicity. In MFCs, the anodic biofilm functions as the recognition component (Chouler and Di Lorenzo, 2015). Its response to the presence of a toxicant causes a change in the rate offlow of electrons to the anode (the transducer), thus generating a measurable change in the output current. As such, there is no need for expensive external equipment that acts as a transducer, as is required in many other types of sensors proposed (Mulchandani et al., 1998; Vaiopoulou et al., 2005).
http://dx.doi.org/10.1016/j.bios.2017.11.018
Received 2 September 2017; Received in revised form 11 October 2017; Accepted 2 November 2017
⁎Corresponding author.
E-mail address:[email protected](M. Di Lorenzo).
Abbreviations:AW, artificial wastewater; cpMFC, chitosan doped paper-based microbial fuel cell; CV, cyclic voltammetry; DMSO, dimethyl sulfoxide; EIS, electrochemical impedance spectroscopy; EMIMAc, 1-, ethyl-3-methylimidazolium; fpMFC, folded paper-based microbial fuel cell; HPLC, High-performance liquid chromatography; LSV, linear sweep voltammetry; MFC, microbial fuel cell; OCV, open circuit voltage; PBS, phosphate buffer solution; pMFC, paper-based microbial fuel cell; SEM, scanning electron microscope
Available online 06 November 2017
Despite their promise, practical implementation of MFCs as sensors is still restricted by the use of expensive manufacturing materials (Winfield et al., 2015) and device designs that are not suitable for portable applications, due to the need for pumps and tubing during operation (Hashemi et al., 2016). All these aspects reflect in an increase in both capital and operating costs. There is therefore a great need for innovative and cost-effective MFC designs.
Recently, paper electronics, which refer to the use of paper as a functional part of the electronic components of a device, are attracting increasing attention (Zhao and van den Berg, 2008). The use of paper can lead to the development of innovative, light and recyclable elec-tronics, with the added benefits of cost-effectiveness, facile operation, easy disposal after use, ready portability and widespread availability (Yetisen et al., 2013). Paper has been explored for the fabrication of MFCs to generate energy from urine (Winfield et al., 2015) and tryptic soy broth (Hashemi et al., 2016; Lee et al., 2016), or to power single-use diagnostic devices (Fraiwan and Choi, 2016). The state of the art in the field of paper-based MFCs is summarized in Table S1 in the Supplementary information. In most of these studies, additional ex-pensive materials are required, such as Nafion, used as a proton ex-change membrane (Fraiwan et al., 2014; Hashemi et al., 2016) and chemicals, such as ferricyanide, used as an electron acceptor at the cathode (Fraiwan et al., 2014, 2013; Fraiwan and Choi, 2016, 2014; Hashemi et al., 2016). These paper-based MFCs are constructed from multiple elements and materials (Choi et al., 2015; Lee et al., 2016), which may lead to manufacturing complexity. They also appear to be
restricted by short operational times (typically 20–200 min) (Fraiwan et al., 2014, 2013; Fraiwan and Choi, 2016). Finally, some studies refer to the use of pure cultures such asShewanella oneidensisMR-1 (Wang et al., 2013; Yang et al., 2016b) further adds to the complexity of the system and is not compatible with practical in-field applications (Fraiwan et al., 2013). All these aspects highlight the need for cheap, easy-to-use and robust paper MFC devices.
In this context, we report here thefirst single-component paper MFC, with the aim of developing a functional, yet simple, light and cost-effective single-use sensing device. The device is fabricated by screen-printing carbon-based electrodes onto a single sheet of paper. It is membrane-less, as the paper substrate itself acts as the separator be-tween the two electrodes. Moreover, there is no need for sample pumping, since capillary forces in the paper create autonomous mi-crofluidics that can be manipulated by changing the paper structure, thus tuning the performance of the device. In contrast to typical paper-based electrochemical sensors reported (Desmet et al., 2016), the paper MFC sensor does not require the use of an external potentiostat and, consequently, of an AC power supply, thus leading to an extremely light and easy-to-transport sensing tool.
In this work, we cross-linked the cellulosefibers within the paper based MFC, with glyoxal (a common cross-linking agent (Xu et al., 2002)), in order to increase robustness and operational lifetime of the device. The resulting MFC device has an extremely simple and easy-to-fabricate design, and, most of all, it is prepared from fully biodegrad-able components.
Nomenclature
a Gradient of glycolic acid calibration curve (mL mg−1) b intercept of glycolic acid calibration curve (–) DF dilution factor
I Current (A)
P Power (W)
PA Peak area (–) R Resistance (Ω) V Voltage (V)
WOFini Initial weight of paper sample (mg)
Fig. 1.(a)Schematic of the pMFC and electrical connection; (b)
We then investigate the electrochemical performance of the paper-MFC and test its capability as a sensor for toxicants in water. In parti-cular, to allow ready comparison with previous work, formaldehyde was used as a model bioactive compound, since it is a toxicant widely used for testing MFC-based sensors. Finally, we report on increased baseline current and enhancement of the sensor sensitivity by the simple design modification of folding two paper MFCs back-to-back, electrically connected in parallel.
2. Experimental section
2.1. Device fabrication
Single component paper-based MFCs (pMFC) were fabricated by screen-printing a conductive ink onto a single sheet of paper (Fabriano 5 HP). The conductive ink consisted of 20 mg α-cellulose (C8002, Sigma Aldrich) dissolved in 1 g of organic electrolyte solution, which consisted of 1-ethyl-3-methylimidazolium (EMIMAc, Sigma Aldrich) and dimethyl sulfoxide (DMSO, Sigma Aldrich) (92:8% w/w ratio). Conductive components, 40 mg carbon nanofibers (PR-24-XT-HHT, Pyrograf Products Inc., USA) and 40 mg graphite powder (< 20 µm, 282863, Sigma Aldrich) were dispersed in this solution. Initially, half of the conductive materials were dispersed into the solvent mixture with a probe sonicator (microtip probe 6.3 mm ID, Fisher Scientific) for 30 s (5 s ON/OFF cycle), then half of the cellulose was added and the paste was stirred overnight using a magnetic stirrer, after which, the re-maining powder mass was added to the paste and thoroughly dispersed using a pestle and mortar. Three layers of the conductive ink were screen-printed (43–80 µm mesh) onto the paper to form the electrodes, Fig. 1. Each layer was printed, the entire sheet submerged in methanol for 20 min to phase invert the cellulose binder and displace the EMIMAc/DMSO solvent, and the sheet air-dried. The pMFC devices were then washed and soaked in water overnight. The electrode loading was found to be 1.85 ± 0.84 mg cm−2, obtained experimentally by measuring the difference in mass of 1 × 1 cm samples of blank un-printed substrate paperversussamples of paper completely covered by with the printed electrode.
To cross-link the cellulose fibers in the pMFC, the devices were submerged for 3 h in aqueous solutions of glyoxal of varying con-centrations, 0–24%w/vat room temperature (20 ± 3 °C), removed and heated at 140 °C for 1 h in an oven to effect reaction. This resulted in degrees of cross-linking corresponding to 0–94.8 mg gpaper−1, as con-firmed by HPLC analysis (Table S2). The conductivity of the resulting electrodes was 48.9 ± 1.9Ωsq−1.
To prepare electrodes with chitosan coatings, the anode was im-mersed in a 0.1% w/vchitosan (Sigma Aldrich) dissolved in 2%v/v acetate solution, prior to glyoxal cross-linking. The chitosan solution functioned as both the anti-solvent and source of chitosan. The elec-trodes were then washed three times for 30 min in water to remove any residual solvents. The conductivity of the resulting electrodes was 45.6 ± 2.7Ωsq−1.
2.2. Device material characterisation
All characterisation of the paper samples was performed in tripli-cate. The conductivity of the electrodes was determined by the four-terminal probe method running a cyclic voltammogram between 0.01 and−0.01 V with a 5 mV s−1scan rate using an Ivium Compactstat
104 (B08084, Ivium Technologies, NL) on the electrode surface. The tensile strength of the pMFCs was measured on an Instron 3369 (Instron, UK), using 1 × 10 cm pre-wetted paper strips (thoroughly wetted by soaking in deionised water overnight). The degree of cross-linking of the cellulosefibers was determined by measurement of gly-colic acid post treatment, as previously described (Schramm and Rinderer, 2000): cross-linked paper samples (0.4 g accurately weighed) were treated with 5 mL of 4 M NaOH at 100 °C for 25 min; the extract
diluted by a factor of 10 and filtered through a 0.2 µm nylon filter before HPLC analysis was performed (Shimatzu Class-VP HPLC with an Aminex HPX-87H column thermostated at 50 °C 15 min isocratic elu-tion with 10 mM H2SO4at a flow rate of 0.6 mL min−1; UV–vis.
de-tection at 210 nm). A calibration curve of peak areaversusglycolic acid concentration was constructed (Fig. S1), and the glycolic acid con-centration was determined (Eq.(1)):
= −
× × ×
−
Glyoxal concentration PA b
a DF WOF
(mg g ) 0.7632
ini
paper 1 (1)
WherePAis the peak area,aandbare the gradient and intercept of the line of bestfit in the calibration, andDFthe dilution factor which takes into account the volume of the hydrolytic reaction (mL),WOFiniis the initial weight of the Fabriano paper (g), and MR(glyoxal)/MR(glycolic
acid) = 0.7632 (Schramm and Rinderer, 2000).
2.3. Biofilm analysis
A Jeol JSM-6480LV scanning electron microscope (SEM) was used to characterise the morphology of thefixed biofilm onto the electrode surface after enrichment and operation. The biofilm wasfixed by fol-lowing the procedure previously described (Chouler et al., 2017), which is also reported in theSupplementary information. All samples were coated with Au prior to imaging.
To assess the relative growth of the biofilm, crystal violet staining was performed (Merritt et al., 2015): after 24 h exposure of the anode to artificial wastewater and anaerobic sludge 0.5 × 0.7 cm electrode samples were excised and placed in 24 well plates. Samples were wa-shed twice with 100 mM phosphate buffer solution (PBS) to remove non-attached bacteria and dried for 1 h at 50 °C. Crystal violet solution (1 mL 0.1%v/v) was added and the samples developed at room tem-perature for 30 min, the stain removed and the samples washed 3 times with 100 mM PBS. To dissolve the dye, 1 mL pure ethanol was added per sample and, following a 10-fold dilution in water, the absorbance measured at 590 nm.
2.4. Operation of the paper-based MFCS
Artificial wastewater (AW) containing (per litre of deionized water): 0.27 g (NH4)SO4, 0.06 g MgSO4·7H2O, 6 mg MnSO4·H2O, 0.13 g
NaHCO3, 3 mg FeCL3·6H2O, 4 mg MgCl2, 3.1 g NaH2PO4·H2O, 10.9 g
Na2HPO4and 10 mM potassium acetate (COD = 950 ± 32 mg/L) was
used as the carbon source for the bacteria. The media was autoclaved and purged with nitrogen before being fed to the pMFCs. A printed circuit board (PCB) edge connector (TE Connectivity, UK) was used to connect the MFC anode and cathode to a voltmeter (ADC-24 Pico data logger, Pico technology, UK) and voltage,V, was continuously mon-itored under closed circuit conditions by applying an external load,Rext, of 1 kΩto polarize the cell. The resultant current (I) was calculated using Ohm's law (I = V/R) and the power,P, calculated asP = VI. To achieve enrichment of electrochemically active bacteria at the anode, the pMFCs were submerged in a sealed 100 mL vessel containing 10% v/vanaerobic sludge (provided by Wessex Water from a wastewater treatment plant in Avonmouth, UK), which was magnetically stirred (Fig. S2). The pH of the solution was 7.5 ± 0.1 and the conductivity 7.14 ± 0.15 mS cm−1. Ten percent of the solution was replaced daily with freshly prepared AW. Once a stable current was observed, the pMFCs were fed with AW containing 10 mM potassium acetate, but no anaerobic sludge. To increase the output current whilst occupying the same operational space, two pMFCs were folded back-to-back and connected to a single PCB edge connector (Fig. 1d). The resulting device was named fpMFC. All studies were performed in triplicate.
2.5. Electrochemical analysis
After enrichment, electrochemical analysis of the fuel cells was
performed using an Autolab PGSTAT128N (Metrohm, UK), with the cells left at open circuit for up to 2 h beforehand to allow a steady state open circuit potential to develop. All electrochemical tests were per-formed with the anode as the working electrode and the cathode as the counter electrode. Polarisation curves were recorded in two electrode mode using a scan rate of 5 mV s−1. Electrochemical Impedance
Spectroscopy (EIS) was conducted over a frequency range of 50 kHz down to 0.1 Hz, using 10 steps per decade, with a sinusoidal pertur-bation of 10 mV amplitude, and an integration time set to 0.125 s, 3 cycles, using the anode as the working electrode, the cathode as counter electrode and an Ag/AgCl reference electrode. The latter was placed close to the anode through the injection port of the vessel (seeFig. S2). To determine the efficacy of proton diffusion within the pMFC, cyclic voltammetry, in two electrode mode at a scan rate of 5 mV s−1and a potential window of−0.7 to 0.7 V, was used. Only the anode of the pMFC was submerged in a solution of 5 mM ferricyanide in 50 mM phosphate buffer and 100 mM NaCl solution.
2.6. Toxicant analysis
A toxic event was mimicked by exposing the MFCs to a solution of 0.1% v/v formaldehyde, by adding 1 mL concentrated formaldehyde solution (10% in AW) into the 100 mL incubation vessel. The current decay after exposure is defined as the initial rate of change of the current with respect to time, dI/dt, taken by the initial slope of the current response curve within thefirst 10 min of toxicant exposure. The delay time is defined as the time between the introduction of a toxicant and thefirst response from the MFC and the response time is defined as the time taken to reach 95% of the new steady state current after a toxic event.
3. Results and discussion
3.1. Device fabrication
Single component, air-breathing, paper-based MFCs (pMFCs) were fabricated by screen-printing, using fully biodegradable materials. Fig. 1a shows a schematic of the device, while its actual size is shown in Fig. 1b.
Firstly, the device fabrication was optimized. In particular, to in-crease the paper tensile strength, improve its robustness and enhance the operational lifetime of the device, the cellulosefibers in the paper and the cellulose in the ink binder of the pMFC were cross-linked by reaction with glyoxal (a common cross-linking agent (Xu et al., 2002)). Various degrees of cross-linking were evaluated and the greatest im-provement in the tensile strength of the pMFC was achieved with 32 mg gpaper−1of glyoxal (Fig. S3), yielding a greater than threefold
improvement versus non-treated paper, from 0.38 ± 0.33 MPa to 1.28 ± 0.09 MPa (Table S2). Increased levels of cross-linking had no further beneficial effects on the tensile strength of the paper. Thus, this degree of cross-linking was considered optimal to yield reproducibly cross-linked materials, and was used for all the subsequent tests.
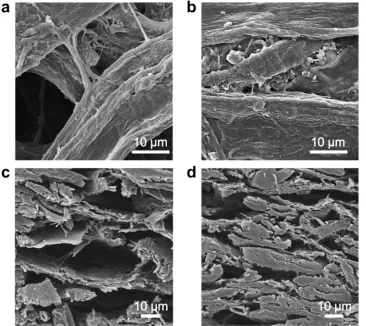
[image:4.595.37.404.411.737.2]The electrochemical performance, in terms of electron transfer capability, of the screen-printed device, before and after the cross-linking step, was investigated by cyclic voltammetry (CV) in a 5 mM ferricyanide solution used as a redox system (Fig. S4). The non-cross-linked device exhibited a very low current with no evidence of oxida-tion or reducoxida-tion peaks over the potential range−0.7 to 0.7 V. On the other hand, the cross-linked device showed oxidation and reduction peaks at 0.34 V and −0.5 V respectively within the same potential range. As evidenced from the scanning electron microscopy (SEM) images of the electrodes (Fig. 2), the cross-linking treatment affects the porous structure of the electrode. In particular, by cross-linking the
cellulose binder, a more open structure in the dried ink is maintained, and shrinkage and collapse is reduced. It is hypothesized that this open structure facilitates diffusion through the electrodes, as well as between the two electrodes, since the paper porosity is similarly enhanced. In-deed, it has been previously demonstrated that the increase in pore size of an electrode separating layer leads to greater power generation in MFCs by lowering its internal resistance (Zhang et al., 2010).
The electroactive surface area (EA) per geometric area (GA) of the resulting electrode, calculated using the Randles-Sêvcîk equation (Fig. S5in theSupplementary information), was estimated to be 0.5. Such low EA/GA fractions are common in paper-based carbon electrodes (Mateos et al., 2017).
3.2. Microbial fuel cell operation
The screen-printed device was subsequently tested as a microbial fuel cell. To this purpose, the electrodes were connected to a 1 kΩ re-sistor to polarize the cell, and the output voltage was continuously monitored. The electrode, acting as the anode, was submerged in a beaker containing artificial wastewater, with 10%v/vanaerobic sludge and 10 mM potassium acetate as a carbon source (Fig. S2), while the cathode was exposed to air.Fig. 1c shows the working principle of the pMFC. The organisms in the anodic biofilm catalyze the oxidation of acetate (the fuel) generating electrons (e-) and protons (H+). The electrons are transferred to the anode and move across the external circuit, while the solvated protons diffuse through the paper to the cathode. Here, the reaction is completed with the reduction of oxygen into water. No external membrane is required and the paper itself acts as a separator.
The current generated by the pMFC over time was monitored over a period of 8 days (Fig. 3) and after 4 days of operation, a steady state current of 0.18 ± 0.04 µA cm−2was achieved.
No appreciable current was generated through a control test in which the screen-printed device, sans sludge enriched anode, was in-cubated with AW and the signal measured with the electrodes con-nected to a 1 kΩresistor (data not shown).
To investigate the effect of stacking the pMFCs, two pMFCs were folded back-to-back (device hereafter named fpMFC) and enriched as described above for the single pMFC. After six days of operation, the electrochemical performance of both the pMFC and the fpMFC was investigated by linear sweep voltammetry (LSV) and electrochemical impedance spectroscopy (EIS). Analysis of the power curves (Fig. 4a), polarisation curves (Fig. 4b) and impedance curves (Fig. 4c) thus ob-tained, suggest significantly enhanced performance for the fpMFC versusthe single cell pMFC (Table S3).
The open circuit voltages (OCV) measured for pMFC and fpMFC were 68 ± 13 mV and 39 ± 8 mV respectively. These OCV values are much lower than for other MFC devices, which are typically in the range of 0.7–1.0 V (Ieropoulos et al., 2010). These values are also an order of magnitude lower than other MFCs with paper-based electrodes (ranging from 302 to 550 mV), which variously use screen-printed carbon electrodes on paper operated in a two chamber configuration (Fraiwan and Choi, 2016), have a combination of a carbon veil anode with a conductive ink cathode (Winfield et al., 2015), or utilize a se-parator such as Nafion (Hashemi et al., 2016) or parchment paper (Lee et al., 2016). Thus, it appears likely that the absence of a membrane in the pMFC is responsible for the lower OCVs obtained in this study, due to oxygen diffusion to the anode. This drawback is, however, counter-acted by the advantage of screen-printing the whole device (or multiple devices) onto a single piece of paper using a single ink formulation (and thus single screen), which hugely simplifies its manufacture and re-duces cost, facilitating mass production. The slightly lower OCV of the fpMFC when compared to the pMFC (a difference of 29 mV) may be due to some loss in voltageviavoltage reversal when electrically stacking MFC units, which has been widely reported (Ieropoulos et al., 2010; Ledezma et al., 2013; Oh and Logan, 2007).
Analysis of the polarisation curves, suggests that mass transfer limitations dominate over other losses in the cell (Fig. 4b), in agreement with the performance of other paper-based MFCs reported (Fraiwan et al., 2016; Winfield et al., 2015).
To probe the effects of cross-linking more closely, images of the microbial biofilm developed on the electrode surface after enrichment (after 10 days of operation) were examined. The open structure gen-erated by cross-linking provides greater surface area for the biofilm allowing the bacteria to colonize the pores of the electrode (Fig. S6).
It was hypothesized that enhancing formation of a biofilm on the anode surface, would lead to improved power performance of the de-vice. Chitosan, has been reported to allow immobilization of whole cells onto surfaces (Rinaudo, 2006) and has been employed to enhance biofilm attachment onto electrode surfaces (Antolini, 2015; Higgins et al., 2011; Lau et al., 2008). To assess the efficacy of this strategy in these pMFCs, devices were prepared with anodes coated with a layer of chitosan (cpMFC) and bacterial colonization after 24 h of incubation, compared with that of non-treated anodes. SEM images of the samples (Fig. 5) show a visibly greater biofilm attachment for the case of the cpMFC. Moreover, crystal violet staining confirmed that the relative growth of the biofilm was over 5 times greater when using a chitosan layer on the anode (1.6%versus8.7% relative growth (Fig. S7)). Despite the promise for increasing the biofilm attachment at the electrode, the electron transfer ability of the cpMFC device was poor, as confirmed by CV analysis (Fig. S8). This behavior was attributed to the presence of amine groups in chitosan that may hinder the diffusion of protons be-tween the two electrodes, thus hindering the electrochemical perfor-mance of the device (Antolini, 2015).
Stacking two devices together (fpMFC) led to a maximum power density of 0.07 ± 0.01 µW cm−2, over 1.7 times the value obtained
with a single cell. Moreover, the current density generated at the maximum power output of the fpMFC was 3.0 ± 0.6 µA cm−2, over 4
times greater than that of the pMFC. The enhanced performance of the fpMFC might be a consequence of the lower internal resistance: 2.2 ± 0.4 kΩfor the fpMFCversus5.7 ± 0.8 kΩfor pMFC, (Fig. 4c). It has been previously shown that, when electrically connecting MFC units in parallel, the internal resistance of the overall system decreases, since the system tends towards the lowest common denominator (Papaharalabos et al., 2015). High internal resistances are usually ob-served in small-scale MFCs (Choi et al., 2011; Qian et al., 2009).
Fig. 3.Enrichment of pMFC. Arrows indicate replacement of 10% of the feed with fresh AW containing 10 mM potassium acetate and no anaerobic sludge. At almost 6 days (indicated with a *) electrochemical analysis (linear sweep voltammetry and electro-chemical impedance spectroscopy) was performed. The decrease in current noted after each addition of nutrient medium (indicated by arrows) was due to minor disruptions of the pMFC feed solution during media replacement. Error bars (referring to experiments conducted in triplicate) are indicated by grey shaded region.
Nonetheless, the internal resistances of both pMFC and fpMFC are al-most one order of magnitude lower than similar air cathode paper-based MFC devices (Lee and Choi, 2015; Lee et al., 2016).
3.3. Biosensing capability-detection of formaldehyde
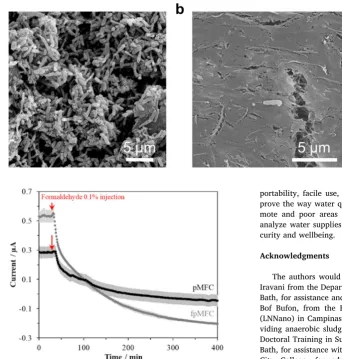
The response of both the pMFC and fpMFC to the presence of 0.1% v/vformaldehyde added to AW as a shock dose was subsequently in-vestigated (Fig. 6). In both cases, exposure to the toxic compound caused a marked drop in the current output. In particular, the rates of current decay within thefirst 10 min of exposure had absolute values of 0.011 µA min−1and 0.021 µA min−1for the pMFC and fpMFC (Table S4). The greater response of the fpMFC reflects its enhanced sensitivity (Jiang et al., 2015). After 4 h of exposure, the steady state currents were
−0.03 µA and−0.15 µA, representing an absolute total current drop of 0.3 µA and 0.6 µA for pMFC and fpMFC respectively. The current outputs reached negative values after 175 min and 115 min (for pMFC and fpMFC respectively) of exposure, thus indicating that the biofilm was severely affected by continuous exposure to the toxicant, in agreement with other studies (Dávila et al., 2011; Wang et al., 2013; Yang et al., 2016b). The nature of the response of these devices to formaldehyde suggests that the pMFC and fpMFC would suit shock sensor applications for water quality monitoring (Liu et al., 2014). The total response times (defined as the time taken to reach 95% of the steady state current after the toxic event) were 165 min (pMFC) and 200 min (fpMFC), which is much faster than other MFC biosensors subjected to the same shock (0.1% formaldehyde): > 200 min for a 140 µL single chambered MFC (Yang et al., 2016b) and > 9.7 h for a 120 mL single chambered MFC,Table S5(Wang et al., 2013).
Thus, our work shows that, not only is the output current enhanced by simply folding two pMFCs back-to-back, but that the sensing per-formance of the overall system also improves. This result suggests a simple route to further optimize the biosensor, which does not com-promise the simplicity of the device or complicate its manufacture.
The pMFC demonstrated appreciable reproducibility particularly in terms of electroactive response to the presence of formaldehyde. Nonetheless, the output current is lower than other MFCs reported in the literature. A way to increase the current signal could be by im-proving the oxygen reduction reactions (ORR) at the cathode. This is often done with platinum (Martin et al., 2011), however, recently more sustainable and cost-effective biomass derived ORR catalysts have been suggested (Chouler et al., 2016). Finally biofilm development could be enhanced by poising the potential of the anode to encourage electro-active biofilm development during enrichment, or through use of other material treatments to enhance the biofilm attachment at the anode (e.g.addition of polypyrole or polyaniline) (Zou et al., 2009).
4. Conclusions
To conclude, in this work we report thefirst single component paper-based MFC with an extremely simple design and demonstrate the proof-of-concept of its use as a biosensor for toxicants in water.
Taking biodegradability, resource efficiency and cost as key design parameters, a screen-printed MFC was designed, which was built wholly of carbon based materials, with no metals in the disposable part of the device (the MFC itself). The natural biopolymer, cellulose, con-stitutes the bulk of the material: the paper upon which the device is constructed. Cellulose is also the ideal binder for the metal free con-ductive ink that constitutes the electrodes and allows proton transport by diffusion, thus obviating the need for a synthetic polymer mem-brane. The single component nature of the device ensures that a single chemical cross-linking step, using an agent that adds only the elements C, H and O, may be used to enhance the robustness of the MFC and maintain the porous nature of both paper and electrodes. Post use, should the MFC be discarded, it will biodegrade, leaving no trace, in-cluding no metal residues. Concerns about potential microbial con-tamination of the environment may be addressed by either incinerating the MFC, or disposing of the MFC in the same manner as human waste. The ease of power output scale-up of the device was demonstrated by folding two paper MFCs back-to-back and electrically connecting them in parallel, thus paving the way for stacking opportunities to enhance performance.
[image:6.595.56.270.58.552.2]Finally, the potential of the devices as rapid onsite shock sensors for water quality assessment, particularly for detection of bioactive com-pounds in water, was demonstrated. Indeed, effective water quality monitoring is currently limited by either expensive, time consuming and offsite analytical methods that need to be performed in the la-boratory, or byfield test kits that have a limited reliability and high cost (Chouler and Di Lorenzo, 2015). The implementation of our paper-based MFC biosensor for water quality monitoring can provide a Fig. 4.(a) Power and (b) polarisation curves for the pMFC and fpMFC. Power and current
densities refer to the geometric anodic electrode area: 2 cm2. (c) Comparison of
solution to detecting toxic compounds in water that is easy to operate by submersion into the sample to be analyzed, simple to manufacture and is extremely cheap. Taking into account the materials specified in the experimental section, the estimated cost of the pMFC device is £0.43. This value could be significantly reduced by upscaled manu-facturing and all processes, including printing, phase inversion (solvent bath), and cross-linking are amenable to roll to roll manufacture. Moreover, with careful design, there is scope for the MFC to be easily deployable in remote locations with data acquisition, analysis and even potentiostatic control possible using a mobile device (e.g. mobile phone) (Delaney et al., 2013; Lin et al., 2015).
In real scenarios, the performance of the pMFC might be susceptible to environmental conditions, such as temperature, pH and conductivity (Peixoto et al., 2011), which should be simultaneously monitored and integrated in the sensor response. This principle has been recently de-monstrated in thefield of MFC based toxicant biosensors by calibrating the MFC output signal to a reference MFC in simultaneous operation (Yang et al., 2016a).
Practical applications would also require pre-enrichment of the anodes of the pMFCs with electroactive bacteria. Indeed such a tech-nique has previously been demonstrated to provide a functional working voltage with paper based MFCs within just 35 min (Winfield et al., 2015).
The distributed water quality monitoring that this device could enable would be of particular value in developing countries, where water and resources are extremely limited, and the need for water monitoring devices, that are cheap, simple to manufacture, and easy to dispose of, is clear. As such, our single-use device, which offers
portability, facile use, and biodegradability, has the potential to im-prove the way water quality is monitored. It can provide those in re-mote and poor areas a way to quickly, simply and cost-effectively analyze water supplies that are critical to their health, livelihood se-curity and wellbeing.
Acknowledgments
The authors would like to thank: Zuhayr Rymansaib and Pejman Iravani from the Department of Mechanical Engineering, University of Bath, for assistance and help on the design of the pMFC; Carlos César Bof Bufon, from the Brazilian Nanotechnology National Laboratory (LNNano) in Campinas for fruitful discussions; Wessex Water for pro-viding anaerobic sludge; Elizabeth Bevon from the EPSRC Centre for Doctoral Training in Sustainable Chemical Technologies, University of Bath, for assistance with CV experiments. We thank Sally Gaden, Bath City College, for advice on screen printing. Funding from the Engineering and Physical Sciences Research Council (EPSRC) and the EPSRC Centre for Doctoral Training in Sustainable Chemical Technologies (EP/P510907/1; EP/G03768X/1; EPSRC EP/L016354/1) is acknowledged.
Appendix A. Supporting information
Supplementary data associated with this article can be found in the online version athttp://dx.doi.org/10.1016/j.bios.2017.11.018.
References
Allen, R.M., Bennetto, H.P., 1993. Appl. Biochem. Biotechnol. 39, 27–40.
Antolini, E., 2015. Biosens. Bioelectron. 69, 54–70.
Choi, G., Hassett, D.J., Choi, S., 2015. Analyst 140, 4277–4283.
Choi, S., Lee, H.-S., Yang, Y., Parameswaran, P., Torres, C.I., Rittmann, B.E., Chae, J., 2011. Lab Chip 11, 1110–1117.
Chouler, J., Bentley, I., Vaz, F., O’Fee, A., Cameron, P.J., Di Lorenzo, M., 2017. Electrochim. Acta 231, 319–326.
Chouler, J., Di Lorenzo, M., 2015. Biosensors 5, 450–470.
Chouler, J., Padgett, G.A., Cameron, P.J., Preuss, K., Titirici, M.-M., Ieropoulos, I., Di Lorenzo, M., 2016. Electrochim. Acta 192, 89–98.
Dávila, D., Esquivel, J.P., Sabaté, N., Mas, J., 2011. Biosens. Bioelectron. 26, 2426–2430.
Delaney, J.L., Doeven, E.H., Harsant, A.J., Hogan, C.F., 2013. Anal. Chim. Acta 803, 123–127.
Desmet, C., Marquette, C.A., Blum, L.J., Doumèche, B., 2016. Biosens. Bioelectron. 76, 145–163.
Fraiwan, A., Choi, S., 2014. Phys. Chem. Chem. Phys. 16, 26288–26293.
Fraiwan, A., Choi, S., 2016. Biosens. Bioelectron. 83, 27–32.
Fraiwan, A., Kwan, L., Choi, S., 2016. Biosens. Bioelectron. 85, 190–197.
Fraiwan, A., Lee, H., Choi, S., 2014. IEEE Sens. J. 14, 3385–3390.
Fraiwan, A., Mukherjee, S., Sundermier, S., Lee, H.-S., Choi, S., 2013. Biosens. Bioelectron. 49, 410–414.
Hashemi, N., Lackore, J.M., Sharifi, F., Goodrich, P.J., Winchell, M.L., Hashemi, N., 2016. Technology 4, 98–103.
[image:7.595.46.389.54.414.2]Higgins, S.R., Foerster, D., Cheung, A., Lau, C., Bretschger, O., Minteer, S.D., Nealson, K., Atanassov, P., Cooney, M.J., 2011. Enzym. Microb. Technol. 48, 458–465.
Fig. 5.SEM images of the anode surface after 24 h inoculation in AW, containing 10%v/vanaerobic sludge for: (a) cpMFC; (b) pMFC. In both cases the anodes were connected to the cathode through a 1 kΩ external resistor and the cell voltage was monitored.
Fig. 6.Amperometric response of the pMFC and fpMFC to an injection of 0.1%v/v for-maldehyde. The grey shaded region refers to the error between three measurements.
Ieropoulos, I., Greenman, J., Melhuish, C., 2010. Bioelectrochemistry 78, 44–50.
Jiang, Y., Liang, P., Zhang, C., Bian, Y., Yang, X., Huang, X., Girguis, P.R., 2015. Bioresour. Technol. 190, 367–372.
Lau, C., Cooney, M.J., Atanassov, P., 2008. Langmuir 24, 7004–7010.
Ledezma, P., Greenman, J., Ieropoulos, I., 2013. Bioresour. Technol. 134, 158–165.
Lee, H., Choi, S., 2015. Nano Energy 15, 549–557.
Lee, S.H., Ban, J.Y., Oh, C.-H., Park, H.-K., Choi, S., 2016. Sci. Rep. 6, 28588.
Lin, F.-T., Kuo, Y.-C., Hsieh, J.-C., Tsai, H.-Y., Liao, Y.-T., Lee, H.-C., 2015. IEEE Sens. J. 15, 3751–3758.
Liu, B., Lei, Y., Li, B., 2014. Biosens. Bioelectron. 62, 308–314.
Di Lorenzo, M., Curtis, T.P., Head, I.M., Scott, K., 2009. Water Res. 43, 3145–3154.
Di Lorenzo, M., Thomson, A.R., Schneider, K., Cameron, P.J., Ieropoulos, I., 2014. Biosens. Bioelectron. 62, 182–188.
Martin, E., Tartakovsky, B., Savadogo, O., 2011. Electrochim. Acta 58, 58–66.
Mateos, R., Alonso, R., Escapa, A., Morán, A., 2017. Materials 10, 79.
Merritt, J., Kadouri, D.E., O’Toole, G.A., 2015. Curr. Protoc. Microbiol 1–29.
Mulchandani, A., Kaneva, I., Chen, W., 1998. Anal. Chem. 70, 5042–5046.
Oh, S.-E., Logan, B.E., 2007. J. Power Sources 167, 11–17.
Ongley, E.D., 2001. Water Int. 26, 14–23.
Palaniappan, M., Gleick, P.H., Allen, L., Cohen, M.J., Christian-Smith, J., Smith, C., 2010. Clearing the Waters: A Focus on Water Quality Solutions. Oakland, CA, USA.
Papaharalabos, G., Greenman, J., Melhuish, C., Ieropoulos, I., 2015. Int. J. Hydrog. Energy 40, 4263–4268.
Peixoto, L., Min, B., Martins, G., Brito, A.G., Kroff, P., Parpot, P., Angelidaki, I., Nogueira,
R., 2011. Bioelectrochemistry 81, 99–103.
Potter, M.C., 1911. Proc. R. Soc. B Biol. Sci. 84, 260–276.
Qian, F., Baum, M., Gu, Q., Morse, D.E., 2009. Lab Chip 9, 3076–3081.
Rinaudo, M., 2006. Prog. Polym. Sci. 31, 603–632.
Sarpong Adu-manu, K., Tapparello, C., Heinzelman, W., Apietu Katsriku, F., Abdulai, J., 2017. ACM Trans. Sens. Netw. 13, 1–41.
Schramm, C., Rinderer, B., 2000. Anal. Chem. 72, 5829–5833.
Stein, N.E., Hamelers, H.V.M., Buisman, C.N.J., 2010. Bioelectrochemistry 78, 87–91.
Vaiopoulou, E., Melidis, P., Kampragou, E., Aivasidis, A., 2005. Biosens. Bioelectron. 21, 365–371.
Wang, X., Gao, N., Zhou, Q., 2013. Biosens. Bioelectron. 43, 264–267.
Winfield, J., Chambers, L.D., Rossiter, J., Greenman, J., Ieropoulos, I., 2015. J. Mater. Chem. A 3, 7058–7065.
WWAP (United Nations World Water Assessment Programme), 2015. The United Nations World Water Development Report 2015: Water for a Sustainable World. Paris.
Xu, G.G., Yang, C.Q., Deng, Y., 2002. J. Appl. Polym. Sci. 83, 2539–2547.
Yang, W., Wei, X., Choi, S., 2016a. IEEE Sens. J. 16, 8672–8677.
Yang, W., Wei, X., Fraiwan, A., Coogan, C.G., Lee, H., Choi, S., 2016b. Sens. Actuators B Chem. 226, 191–195.
Yetisen, A.K., Akram, M.S., Lowe, C.R., 2013. Lab Chip 13, 2210–2251.
Zhang, X., Cheng, S., Huang, X., Logan, B.E., 2010. Energy Environ. Sci. 3, 659–664.
Zhao, W., van den Berg, A., 2008. Lab Chip 8, 1988–1991.