This is a repository copy of
Data of the maximum solid solubility limits of binary systems of
elements
.
White Rose Research Online URL for this paper:
http://eprints.whiterose.ac.uk/151712/
Version: Published Version
Article:
Goodall, R. orcid.org/0000-0003-0720-9694 (2019) Data of the maximum solid solubility
limits of binary systems of elements. Data in Brief, 26. 104515.
https://doi.org/10.1016/j.dib.2019.104515
[email protected]
https://eprints.whiterose.ac.uk/
Reuse
This article is distributed under the terms of the Creative Commons Attribution (CC BY) licence. This licence
allows you to distribute, remix, tweak, and build upon the work, even commercially, as long as you credit the
authors for the original work. More information and the full terms of the licence here:
https://creativecommons.org/licenses/
Takedown
If you consider content in White Rose Research Online to be in breach of UK law, please notify us by
Data Article
Data of the maximum solid solubility limits of
binary systems of elements
R. Goodall
Department of Materials Science&Engineering, The University of Sheffield, United Kingdom
a r t i c l e
i n f o
Article history:
Received 9 July 2019
Received in revised form 5 September 2019 Accepted 6 September 2019
Available online 18 September 2019
Keywords:
Periodic table of the elements Alloy design
Solid solubility
a b s t r a c t
This paper gives the available data for the maximum equilibrium
solubility limits of each of the
first 83 elements (H to Bi) of the
periodic table in each of the others. This is expressed in the form of
the maximum value of the equilibrium solid solubility for terminal
solid solutions, expressed in atomic percentage (at%), occurring at
any temperature where the room temperature phase of the pure
element acting as the solvent is stable. The values thus represent
the compatibility between different elements in the formation of
alloys and similar combinations, and will be of use for research
into fundamental solid state physics relating to elemental
in-teractions, for the interpretation of phase structures in materials
research and for the design of alloys and materials involving
elemental mixing of the elements.
©
2019 The Author(s). Published by Elsevier Inc. This is an open
access article under the CC BY license (
http://creativecommons.
org/licenses/by/4.0/
).
1. Data
The data presented in this article are for the maximum equilibrium solubility limits of each of the
fi
rst 83 elements (H to Bi) in each of the others. These are taken to be the maximum value of solid
solubility for the terminal solid solutions, expressed in atomic percentage (at%), occurring at any
temperature where the room temperature phase of the pure element acting as the solvent is stable. The
values thus represent the compatibility between different elements in the formation of alloys and
similar combinations, with higher values indicating a greater compatibility. A value of 100 at% indicates
complete solid solubility, while a value of 0 at% indicates immiscibility in the solid state. The data are
E-mail address:r.goodall@sheffield.ac.uk.
Contents lists available at
ScienceDirect
Data in brief
j o u r n a l h o m e p a g e :
w w w . e l s e v i e r . c o m / l o c a t e / d i b
https://doi.org/10.1016/j.dib.2019.104515
presented in the form of a table, with each of the elements listed in order. Each row corresponds to a
particular element acting as a solvent, and the columns show the solubility of each of the other
ele-ments as a solute in the system. Values have been given to the precision of the original measureele-ments
or predictive output on which the assessment is made. Data have been found for 3787 systems, and
where no values are reported, the cell is left blank. The full data set is summarized below in 4 tables
(see
Tables 1
e
4
) (split in this manner for legibility in the print version), each showing a quadrant of the
overall matrix, while the complete table of the Raw data is included in Excel form for ease of data reuse
in the
Supplementary Material
.
2. Experimental design, materials, and methods
The data presented have been obtained by an analysis of binary phase diagrams, obtained by a
thorough survey of the literature. The majority of the diagrams used have been taken from major
reference works on the subject
[1
e
3]
, with the most recent report in each case taking precedence.
Additional reports of mutually insoluble pairs and some more up to date data have been taken from
the wider literature, with the full sources identi
fi
ed with the data (accessible with the Excel
fi
le
containing the complete data). In each case, the reported data have been assessed to ensure a good
standard of con
fi
dence is maintained, allowing phase diagrams derived from experimental
inves-tigation and those generated by thermodynamic calculation, but ensuring in either case that the
reports are suf
fi
ciently detailed and supported by reference to wider literature. In some cases,
maximum solubility limits are reported explicitly, and these are then taken to the accuracy at which
they are reported. In other cases, where the diagrams only are shown they are graphically analyzed to
determine the relevant values, which are given to the precision of other values provided in that
study, or the dimensions of the relevant line, whichever is the lesser. All values are given in atomic
percent, and where originally given in weight percent they are converted using the standard atomic
masses of the elements concerned. Where no data have been found, the corresponding cells have
been left blank.
Value of the Data
Many phase diagrams showing the equilibrium structures formed when mixing pairs of elements have been assessed, yet,
while these are available individually, collected data across all systems, such as presented here, are not accessible without time consuming search.
Solubility data for the solid phase allows interpretation and prediction of the behavior of elements combined into alloys. It
is therefore of great use in physical metallurgy and alloy design, with application to the development of new materials including lightweight structural alloys, high temperature alloys, High Entropy Alloys, materials for hydrogen storage and novel functional materials such as permanent magnets, thermoelectric and magnetocaloric materials, as examples.
The collation of this data displays the underlying trends arising from the role of the electronic structure in alloying (as
displayed in the periodic table), and analysis of the data may reveal further detail and exceptions to established trends, the study of which may lead to refinement of theory in solid state physics.
Specifications Table
Subject area Chemistry
More specific subject area Materials Science
Type of data Table
How data was acquired Survey and analysis of literature binary phase diagrams
Data format Analyzed data, tabulated
Experimental factors Each phase diagram was researched and assessed for detail and reliability
Experimental features Where not already reported, diagrams were graphically analyzed for solubility data
Data source location University of Sheffield, Sheffield, UK
Data accessibility Raw data included in article, see Excelfile in supplementary material R. Goodall / Data in brief 26 (2019) 104515
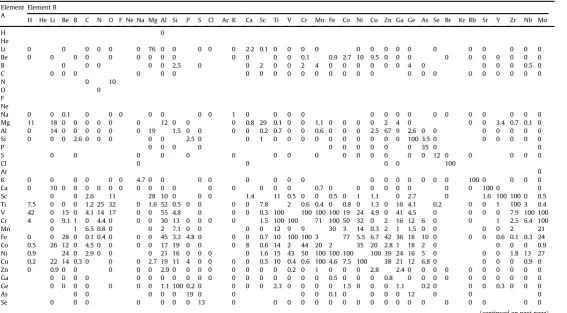
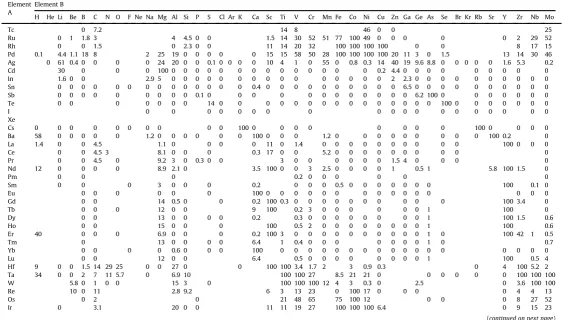
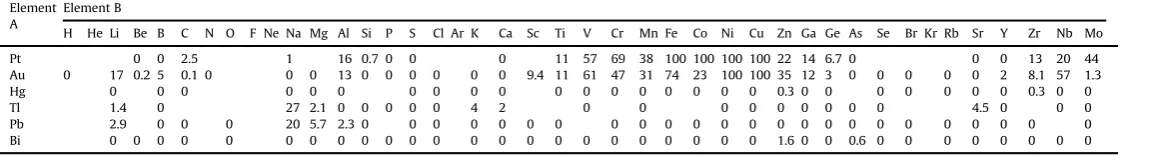
Table 1
Maximum equilibrium solubility limits in binary systems involving thefirst 42 elements (H to Mo) as both the solvent and the solute. Data are shown as the solubility limit, in atomic percent (at.%) of the element“B”in element“A”.
Element A
Element B
H He Li Be B C N O F Ne Na Mg Al Si P S Cl Ar K Ca Sc Ti V Cr Mn Fe Co Ni Cu Zn Ga Ge As Se Br Kr Rb Sr Y Zr Nb Mo
H 0
He
Li 0 0 0 0 0 0 76 0 0 0 0 0 2.2 0.1 0 0 0 0 0 0 0 0 0 0 0 0 0 0 0
Be 0 0 0 0 0 0 0 0 0 0 0 0 0 0.1 0.9 2.7 10 9.5 0 0 0 0 0 0 0 0 0 0
B 0 0 0 0 0 2.5 0 0 2 0 0 2 4 0 0 0 0 0 0 4 0 0 0 0 0.5 0
C 0 0 0 0 0 0 0 0 0 0 0 0 0 0 0 0 0 0 0 0 0 0 0 0 0
N 0 10
O 0
F Ne
Na 0 0 0.1 0 0 0 0 0 0 0 1 0 0 0 0 0 0 0 0 0 0 0 0 0 0 0
Mg 11 18 0 0 0 0 0 0 12 0 0 0 0.8 29 0.1 0 0 1.1 0 0 0 0 2 4 0 0 0 3.4 0.7 0.1 0 Al 0 14 0 0 0 0 0 0 19 1.5 0 0 0 0 0.2 0.7 0 0 0.6 0 0 0 2.5 67 9 2.6 0 0 0 0 0 0 0
Si 0 0 0 2.6 0 0 0 0 0 2.5 0 0 1 0 0 0 0 0 0 0 0 0 0 100 3.5 0 0 0 0 0 0
P 0 0 0 0 0 0 0 0 0 0 35 0 0
S 0 0 0 0 0 0 0 0 0 0 0 0 0 0 0 12 0 0 0 0 0
Cl 0 0 0 0 100
Ar 0
K 0 0 0 0 0 0 4.7 0 0 0 0 0 0 0 0 0 0 0 0 0 0 0 100 0 0 0 0
Ca 0 10 0 0 0 0 0 0 0 0 0 0 0 0 0 0 0 0.7 0 0 0 0 0 0 0 0 100 0 0
Sc 0 0 2.6 11 28 10 0 0 0 1.4 11 0.5 0 0 0.5 0 1 1.1 0 2.7 0 1.6 100 100 0 0.5 Ti 7.5 0 0 0 1.2 25 32 0 1.6 52 0.5 0 0 0 0 7.8 2 0.6 0.4 0 0.8 0 1.3 0 16 4.1 0.2 0 0 1 100 3 0.4 V 42 0 15 0 4.1 14 17 0 0 55 4.8 0 0 0 0.3 100 100 100 100 19 24 4.9 0 41 4.5 0 0 0 0 7.9 100 100 Cr 4 0 9.1 1 0 4.4 0 0 0 30 13 0 0 0 0 1.5 100 100 71 100 50 32 0 2 16 12 6 0 0 1 2.5 6.4 100
Mn 0 1 6.5 0.8 0 0 2 7.1 0 0 0 0 12 9 9 30 3 14 0.3 2 1 1.5 0 0 0 0 2 21
Fe 0 0 28 0 0.1 0.4 0 0 0 45 3.2 4.8 0 0 0 0.7 10 100 100 3 77 5.5 6.7 42 36 18 10 0 0 0 0.6 0.1 0.3 24 Co 0.5 26 12 0 4.5 0 0 0 0 17 19 0 0 0 8 0.6 14 2 44 20 2 35 20 2.8 1 18 2 0 0 0 0 0.9 Ni 0.9 24 0 2.9 0 0 0 21 16 0 0 0 0 1.6 15 43 50 100 100 100 100 39 24 16 5 0 0 0 1.8 13 27 Cu 0.2 22 14 0.3 0 0 0 2.7 19 11 4 0 0 0 0 0.5 10 0.4 0.6 100 4.6 7.5 100 38 21 12 6.8 0 0 0 0 0.9 0 Zn 0 0.9 0 0 0 0 0 2.9 0 0 0 0 0 0 0 0 0.2 0 1 0 0 0 2.8 2.4 0 0 0 0 0 0 0 0 0 0
Ga 0 0 0 0 0 0 0 0 0 0 0 0 0 0 0 0 0 0 0.5 0 0 0 0.8 0 0 0 0 0 0 0 0 0 0
Ge 0 0 0 0 0 0 0 1.1 100 0.2 0 0 0 0 2.3 0 0 0 0 1.5 0 0 0 1.1 0.2 0 0 0 0.3 0 0 0
As 0 0 0 0 0 19 0 0 0 0 0.1 0 0 0 0 12 0 0 0
Se 0 0 0 0 0 0 0 13 0 0 0 0 0 0 0 0 0 0 0 0 0 0 0 0 0 0
(continued on next page)
R.
Goodall
/
Data
in
brief
26
(20
19)
1045
Table 1(continued)
Element A
Element B
H He Li Be B C N O F Ne Na Mg Al Si P S Cl Ar K Ca Sc Ti V Cr Mn Fe Co Ni Cu Zn Ga Ge As Se Br Kr Rb Sr Y Zr Nb Mo
Br 0 0 0 100 0 0 0 0 0 0 0
Kr
Rb 0 0 0 0 0 0 0 0 0 0 100 0 0 0 0 0 0 0 0 0 0 0 0 0 0
Sr 5 0 0 0 0 0 13 0 0 0 0 0 100 0 0 0 0 0 0 0 0.5 0 0 0 0 0 0 0
Y 0 0 7 3 15 20 0 0 0 0.5 100 0.9 0.3 0.7 0 1.6 0 0 0 0 0 1 6.4 1.8 0.1 0
Zr 5.2 0 0 1.5 0 23 31 0 0.4 8.3 0 0 100 100 2 1 0 0 5 0.2 0.1 3.2 0.8 1 0 0 0.7 0 Nb 49 0 13 1.7 5.2 17 9 0 0.2 20 3.5 0 0 0 100 100 25 9.1 5.3 5 5.6 0 19 11 0 0 0.1 100 100 Mo 0 0 0 1 0.9 1.1 1 1 0 0 0 0 20 3 16 3 0 0 0 0 0.5 100 100 100 37 31 7.1 2.9 0 0 15 5 0 0 0 0 0 0 0 9 100
R.
Goodall
/
Data
in
brief
26
(20
19)
1045
15
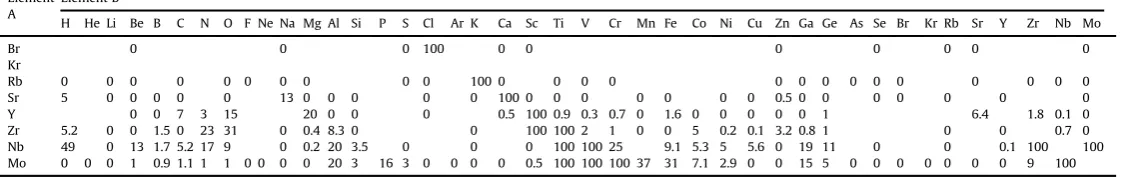
Table 2
Maximum equilibrium solubility limits in binary systems involving thefirst 42 elements (H to Mo) as the solvent and elements 43 to 83 (Tc to Bi) as the solute. Data are shown as the solubility limit, in atomic percent (at.%) of the element“B”in element“A”.
Element A
Element B
Tc Ru Rh Pd Ag Cd In Sn Sb Te I Xe Cs Ba La Ce Pr Nd Pm Sm Eu Gd Tb Dy Ho Er Tm Yb Lu Hf Ta W Re Os Ir Pt Au Hg Tl Pb Bi
H He
Li 0 0 0 9 18 0 0 0 0 0 0 0 0 0 0 0 0 0 0 0 0 0 0 0 0
Be 0 5 0 0 0 0 0 0 0 0 0 0 0 0 0.3 0
B 0 0 0 0 0 0 0 0 0 0 0 0 0 0 0 0 0 0 0 0 0 0 0 0 1 0.4 1 0 0 0 0 0 0 0 0
C 0 0 0 0 0 0 0 0 0 0 0 0 0 0 0 0 0 0 0 0 0 0 0 0 0 0
N 0
O F Ne
Na 0 0 0 0 0 0 0 0 0 5.7 0 0 0 0 0 1.1 0 0
Mg 0.2 3.8 100 19 3.4 0 0 0 0 0 0.1 0 0.8 0 0 4.5 4.8 5.4 6.9 6.3 1.2 8.8 0 0.2 0 0.1 1.2 16 7.7 1 Al 0.5 0 0 23 0 0 0 0 0 0 0 0 0 0 0 0 0 0 0 0 0 0 0 0 0 0 0 0 0 0 0 0 0 0.1 0 0 0 0
Si 0 0 0 0 0 0 0.1 0 0 0 0 0 0 0 0 0 0 0 0 0 0 0 0 0 0 0 0 0 0 0 0 0
P 0 0 0 0 0 0 0 0 0 0
S 0 0 0 0 0 0 0.3 0 0 0 0 0 0 0 0 0 0 0 0 0 0
Cl 0 0 0 0 0 0 0
Ar
K 0 0 0 0 0 0 0 100 0 0 0 0 0 0 0 0
Ca 0 0 0 0 0 0 0 0 100 0 0 0.1 0 55 0 0.5 0 0 0.4 100 0.3 0 0 0 0 0
Sc 1 2 0 0 15 4.5 0 0 2 15 12 100 0 100 100 100 100 100 0.1 0 0 1 0 0 0
Ti 1 0.1 0.1 1 4.7 10 11 12 0.9 0 0 1 1.2 1 0 6 1 0.1 0.1 0 100 3.6 0.2 8 20 15 2 1.7 0 4 0.5 V 44 25 18 38 0 5.5 16 0 0 0 0 0.6 0.1 0 0.1 0.1 0 0 0.1 0.1 0.1 0 0.1 0 0 4 100 100 65 37 22 11 33 0 3.4 Cr 32 20 1 0 0 2 5 0 0 0 2.5 0 1.5 0 0 0 0 1 0 3.7 0 0 0 0 2 4.3 100 50 30 11 6.8 3 0 0 0
Mn 1 3.7 0 2 1.5 0 0 0 0 0 0 0 0 0 0 0 0 0 0 0 1 0 0.2 2 10 5.5 5 1 0 0 0 0
Fe 4 19 3.5 0 0 0.3 9.2 5 1.5 0 0 0 0 0 0 0 0 0 1 0 0 0 0 0 0 0 0.7 0.8 15 8 3 8 1 0 0 0 Co 100 100 20 0 0.3 0 0 0 0 0 0 0 0 0 0 0 0 0 0 0 0 0.5 4 0 100 100 100 100 0 0 0 Ni 29 31 100 100 1.4 0 8 11 10 0 0 0 0 0 0 0 0.8 0 0 0 0 0 1 11 18 17 14 100 100 100 0 2.5 0.1 Cu 0 0 100 100 4.9 2.2 11 9.1 5.8 0 0 0 0 0 0 0 0 0 0 0 0 0 0 0 0 0 0 0 0.3 0 0 0 8 100 100 5 0.3 0 0
Zn 0 0 4 1.5 0.1 0 0 0 0 0 0 0 0 0 0 0 0 0 0 0 0 0 0 0 0 5.5 3 0 0 0.1
Ga 0 0 0 0 0 0 0 0 0 0 0 0 0 0 0 0 0 0 0 0 0 0 0 0 0 0 0 0 0 0 0 0 0
Ge 0 0 0 0 0 0 1.1 0 0 0 0 0 2 0 1 0 0 0 0 0 0 0 0 0 0 0 0 0 0 0 0 0 0 0
As 0 0 0 0 15 100 0 0 0 0 0 0 0 0 0 0 0 0 0 0 0 0 0 0 0
Se 0 0 0 0 0 0 0 0 100 0 0 0 0 0 0 0 0 0 0 0 0 0 0 0 0
Br 0 0 0 0 0 0 0 0 0 0 0 0 0
(continued on next page)
R.
Goodall
/
Data
in
brief
26
(20
19)
1045
Table 2(continued)
Element A
Element B
Tc Ru Rh Pd Ag Cd In Sn Sb Te I Xe Cs Ba La Ce Pr Nd Pm Sm Eu Gd Tb Dy Ho Er Tm Yb Lu Hf Ta W Re Os Ir Pt Au Hg Tl Pb Bi
Kr
Rb 0 0 0 0 0 0 0 100 0 0 0 0 0 0 0 0
Sr 0 0 0 0 0 0 0 0 22 0.3 0 0 0 0 0 0
Y 0 0 0 8 1.7 1.7 0 7.9 100 100 100 100 100 100 100 100 0 100 1 0 0 0 0 0 2 0 Zr 0.6 0 1 1.3 18 10 6.5 0.8 0 0 0 2.8 3.4 0 3 4.1 7 3.7 28 0 4.9 100 0.7 4 1.5 1.5 1 1.5 2 0 5 4 Nb 40 21 36 0 11 20 0 0 0 0.1 0 0.1 0 0 0 0 100 100 100 46 19 12 12 36 0 0 Mo 49 33 20 6 0 0 0.1 0 0 0 0 0 0 0 0.1 0.3 0.3 0.3 0.3 0 0 1 0.7 0.6 0.6 0.5 0.5 0 4 23 100 100 38 18 16 15 0.4 0 0 0 0
R.
Goodall
/
Data
in
brief
26
(20
19)
1045
15
Table 3
Maximum equilibrium solubility limits in binary systems involving elements 43 to 83 (Tc to Bi) as the solvent and thefirst 42 elements (H to Mo) as the solute. Data are shown as the solubility limit, in atomic percent (at.%) of the element“B”in element“A”.
Element A
Element B
H He Li Be B C N O F Ne Na Mg Al Si P S Cl Ar K Ca Sc Ti V Cr Mn Fe Co Ni Cu Zn Ga Ge As Se Br Kr Rb Sr Y Zr Nb Mo
Tc 0 7.2 14 8 46 0 0 25
Ru 0 1 1.8 3 4 4.5 0 0 1.5 14 30 52 51 77 100 49 0 0 0 0 0 2 29 52
Rh 0 0 1.5 0 2.3 0 0 11 14 20 32 100 100 100 100 0 0 8 17 15
Pd 0.1 4.4 1.1 18 8 2 25 19 0 0 0 0 0 15 15 58 50 28 100 100 100 100 20 11 3 0 1.5 13 14 30 46 Ag 0 61 0.4 0 0 0 0 24 20 0 0 0.1 0 0 0 0 10 4 1 0 55 0 0.8 0.3 14 40 19 9.6 8.8 0 0 0 0 0 1.6 5.3 0.2
Cd 30 0 0 0 100 0 0 0 0 0 0 0 0 0 0 0 0 0 0 0.2 4.4 0 0 0 0 0 0 0 0 0
In 1.6 0 0 2.9 5 0 0 0 0 0 0 0 0 0 0 0 0 0 0 0 2 2.3 0 0 0 0 0 0 0 0 0 0
Sn 0 0 0 0 0 0 0 0 0 0 0 0 0 0 0.4 0 0 0 0 0 0 0 0 0 0 6.5 0 0 0 0 0 0 0 0 0 0
Sb 0 0 0 0 0 0 0 0 0 0.1 0 0 0 0 0 0 0 0 0 0 0 0 6.2 100 0 0 0 0 0 0 0
Te 0 0 0 0 0 0 0 14 0 0 0 0 0 0 0 0 0 0 0 0 0 0 0 100 0 0 0 0 0 0 0
I 0 0 0 0 0 0 0 0 0 0 0 0 0 0 0 0 0 0 0
Xe
Cs 0 0 0 0 0 0 0 0 0 0 100 0 0 0 0 0 0 0 0 100 0 0 0 0
Ba 58 0 0 0 0 0 1.2 0 0 0 0 0 0 100 0 0 0 1.2 0 0 0 0 0 0 0 0 0 100 0.2 0
La 1.4 0 0 4.5 1.1 0 0 0 0 11 0 1.4 0 0 0 0 0 0 0 0 0 0 100 0 0 0
Ce 0 0 4.5 3 8.1 0 0 0 0.3 17 0 0 5.2 0 0 0 0 0 0 0 0 0 0
Pr 0 0 4.5 0 9.2 3 0 0.3 0 0 3 0 0 0 0 0 0 1.5 4 0 0 0 0
Nd 12 0 0 0 0 8.9 2.1 0 3.5 100 0 0 3 2.5 0 0 0 0 1 0.5 1 5.8 100 1.5 0
Pm 0 0 0 0.2 0 0 0 0 0 0
Sm 0 0 0 3 0 0 0 0.2 0 0 0 0.5 0 0 0 0 0 0 0 100 0.1 0
Eu 0 0 0 0 0 0 100 0 0 0 0 0 0 0 0 0 0 0 0 0 0 0
Gd 0 0 14 0.5 0 0 0.2 100 0.3 0 0 0 0 0 0 0 0 0 0 100 3.4 0
Tb 0 0 0 12 0 0 9 100 0.2 3 0 0 0 0 0 0 1 100 0
Dy 0 0 13 0 0 0 0 0.2 0.3 0 0 0 0 0 0 0 0 1 100 1.5 0.6
Ho 0 0 15 0 0 0 100 0.5 2 0 0 0 0 0 0 0 0 1 100 0.6
Er 40 0 0 0 6.9 0 0 0 0.2 100 3 0 0 0 0 0 0 0 0 0 0 1 0 100 42 1 0.5
Tm 0 13 0 0 0 0 6.4 1 0.4 0 0 0 0 0 0 0 1 0 0.7
Yb 0 0 0 0 0.6 0 0 0 100 0 0 0 0 0 0 0 0 0 0 0 0 0 0 0 0 0
Lu 0 0 12 0 0 6.4 0.5 0 0 0 0 0 0 0 0 1 100 0.5 4
Hf 9 0 0 1.5 14 29 25 0 0 27 0 0 100 100 3.4 1.7 2 3 0.9 0.3 0 4 100 5.2 2
Ta 34 0 0 2 7 11 5.7 0 6.9 10 100 100 27 8.5 21 21 0 0 0 0 0 0 100 100 100
W 5.8 0 1 0 0 15 3 0 100 100 100 12 4 3 0.3 0 2.5 0 3.6 100 100
Re 10 0 11 2.8 9.2 6 3 13 23 0 100 17 0 0 0 0 4 4 13
Os 0 2 0 21 48 65 75 100 12 0 0 0 8 27 52
Ir 0 3.1 20 0 0 11 11 19 27 100 100 100 6.4 0 9 15 23
(continued on next page)
R.
Goodall
/
Data
in
brief
26
(20
19)
1045
Table 3(continued)
Element A
Element B
H He Li Be B C N O F Ne Na Mg Al Si P S Cl Ar K Ca Sc Ti V Cr Mn Fe Co Ni Cu Zn Ga Ge As Se Br Kr Rb Sr Y Zr Nb Mo
Pt 0 0 2.5 1 16 0.7 0 0 0 11 57 69 38 100 100 100 100 22 14 6.7 0 0 0 13 20 44 Au 0 17 0.2 5 0.1 0 0 0 13 0 0 0 0 0 0 9.4 11 61 47 31 74 23 100 100 35 12 3 0 0 0 0 0 2 8.1 57 1.3
Hg 0 0 0 0 0 0 0 0 0 0 0 0 0 0 0 0 0 0 0.3 0 0 0 0 0 0 0 0.3 0 0
Tl 1.4 0 27 2.1 0 0 0 0 0 4 2 0 0 0 0 0 0 0 0 0 4.5 0 0 0
Pb 2.9 0 0 0 20 5.7 2.3 0 0 0 0 0 0 0 0 0 0 0 0 0 0 0 0 0 0 0 0 0 0 0 0
Bi 0 0 0 0 0 0 0 0 0 0 0 0 0 0 0 0 0 0 0 0 0 0 0 1.6 0 0 0.6 0 0 0 0 0 0 0 0
R.
Goodall
/
Data
in
brief
26
(20
19)
1045
15
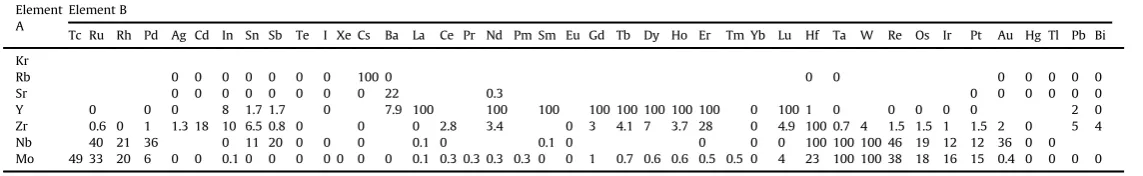
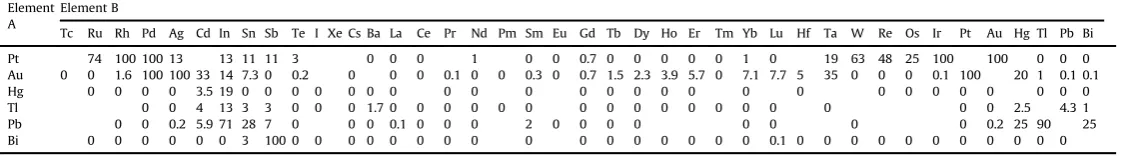
Table 4
Maximum equilibrium solubility limits in binary systems involving elements 43 to 83 (Tc to Bi) as both the solvent and the solute. Data are shown as the solubility limit, in atomic percent (at.%) of the element“B”in element“A”.
Element A
Element B
Tc Ru Rh Pd Ag Cd In Sn Sb Te I Xe Cs Ba La Ce Pr Nd Pm Sm Eu Gd Tb Dy Ho Er Tm Yb Lu Hf Ta W Re Os Ir Pt Au Hg Tl Pb Bi
Tc 0 12 100
Ru 60 8 0 0 0 2 1.5 2 0 0 0 0 0 0 0 2 5 28 48 100 100 49 21 0 0
Rh 35 100 10 15 6.5 1 0 0 0 0 0 0 0 0 0 0 1 5 18 19 12 55 100 100 0.3 0 0
Pd 21 100 100 26 19 17 17 16 0 13 9 3 10 12 12 12 12 13 13 13 23 18 22 16 2.9 100 100 100 14 17 Ag 0 0 100 42 21 12 7.2 0 0 0 0 0.1 0.1 0.3 0 1 0 0.7 1.1 1.3 1.4 3.1 4.6 1.9 5.8 0 0 0 0 40 100 37 7.8 2.8 2.6
Cd 0 7 1.4 0.2 0 0 0 0 0 0 0 0 0 0 0 0 0 0 0 4 25 0 0 0
In 0 0 0 6 12 0 0 0 0 0 0 0 0 0 0 0 0 0 0 0 0 0 0 0 0 0 0 0 0 4.5 31 8.2
Sn 0 0 0 0 1.1 0 0 0 0 0 0 0 0 0 0 0 0 0 0 0 0 0 0 0 0 0 0 0 0 0 1 0 0 13
Sb 0 0 0 0 0 0 12 1.3 0 0 0 0 0 0 0 0 0 0 0 0 0.9 0 0 0 0 0 0 0 0 2 100
Te 0 0 0 0 0 0 0 0 0 0 0 0 0 0 0 0 0 0 0 0 0 0 0 0 0 0 0 0 0 0 0 0 0 0 0 0
I 0 0 0 0 0 0 0 0 0 0 0 0 0
Xe
Cs 0 0 0 0 0 0 0 0 0 0 0 0 0 0 0
Ba 0 0 0 0 0 0 0 0.2 0 0 0 0 100 100 0 0 0 0
La 0 0 0 0 0 0 0 0 0 100 100 100 100 100 100 21 0 0 0 0 0 0 0 0 0 0 0
Ce 0 0 0 0 0 0 0 0 0 100 70 100 100 2 4.4 3 0 0 0 0 0 0 0 0 0 0
Pr 0 1.3 5.6 3.5 2 0 0 0 100 100 100 100 100 100 0 0 0 0 0.2 0 0.1 1 0.9 2.5 2.2 0 Nd 0 0 0.9 0 5 2 0 0 0 100 100 100 100 100 100 100 100 2.2 0 0 0 1 0 3 2.5 0
Pm 5 0 100 100 100 100 100 100 0 4
Sm 0 0 0.7 0 0 0 0 0 0 0 7 20 13 40 19 15 13 9 7 0 0 0 0 0.2 0
Eu 0 0 0 0 0 0 0 5 0 0 100 0 0 0 0 0 0
Gd 0 0 3.7 0 5 7 0 4 0 0 100 30 100 100 100 100 100 100 100 100 100 19 100 0 0 0 0 0 7.2 1 0
Tb 0 0 9 0 0 0 100 100 100 100 100 100 100 0 0 1 0 0 0 0 0 1
Dy 0 0 0 0 8 3 0 0 0 62 100 100 100 100 100 100 100 100 100 100 0 0 0 0 5 3.1 0
Ho 0 0 8 2.5 0 0 0 100 0 100 100 100 100 100 100 0 0 0 0 5 1
Er 0 2 0 0 7 1.4 1.4 0 0 100 100 100 100 100 100 100 2.5 0 0 0 0 0 0 0 6 1
Tm 0 0 10 0 2.5 0 100 100 100 100 100 100 100 0 0 0 0 0 0 0
Yb 0 0 0 0 1.4 0 0 0 0 10 0 1.7 1.4 0 0 0 0 0 0 0 0 0 0 6 0 1
Lu 2 0 0 0 3 100 100 100 100 100 100 15 0 0 0 0 0.8
Hf 2 3 1 0 14 0 0 0 0.5 0 100 7.5 0 5.1 0 0.8 1 1.4 5 0
Ta 49 16 25 0 9 0 0 0 0 0 0 0 100 100 47 78 7.3 9 20 0 0
W 55 23 6 5 0 0 0 0 0 0 0 0 0 0 0 0 0 0 0 7.5 100 37 19 10 4.7 0 0
Re 100 100 24 0 0 0 0 0 1 0 11 4 20 100 44 44 0 0 0
Os 100 30 5.2 0 0 0 0 13 19 54 100 38 0 0
Ir 45 100 100 0 0 0 0 0 0 0 0 0 0 0 0 0 0 0 0 0 0 10 16 19 36 44 100 2 0 0
(continued on next page)
R.
Goodall
/
Data
in
brief
26
(20
19)
1045
Table 4(continued)
Element A
Element B
Tc Ru Rh Pd Ag Cd In Sn Sb Te I Xe Cs Ba La Ce Pr Nd Pm Sm Eu Gd Tb Dy Ho Er Tm Yb Lu Hf Ta W Re Os Ir Pt Au Hg Tl Pb Bi
Pt 74 100 100 13 13 11 11 3 0 0 0 1 0 0 0.7 0 0 0 0 0 1 0 19 63 48 25 100 100 0 0 0 Au 0 0 1.6 100 100 33 14 7.3 0 0.2 0 0 0 0.1 0 0 0.3 0 0.7 1.5 2.3 3.9 5.7 0 7.1 7.7 5 35 0 0 0 0.1 100 20 1 0.1 0.1
Hg 0 0 0 0 3.5 19 0 0 0 0 0 0 0 0 0 0 0 0 0 0 0 0 0 0 0 0 0 0 0 0 0
Tl 0 0 4 13 3 3 0 0 0 1.7 0 0 0 0 0 0 0 0 0 0 0 0 0 0 0 0 0 2.5 4.3 1
Pb 0 0 0.2 5.9 71 28 7 0 0 0 0.1 0 0 0 2 0 0 0 0 0 0 0 0 0.2 25 90 25
Bi 0 0 0 0 0 0 3 100 0 0 0 0 0 0 0 0 0 0 0 0 0 0 0 0 0.1 0 0 0 0 0 0 0 0 0 0 0
R.
Goodall
/
Data
in
brief
26
(20
19)
1045
15
Acknowledgments
The author would like to acknowledge a Fellowship supported by the Royal Academy of Engineering
under the RAEng/Leverhulme Trust Senior Research Fellowships scheme.
Con
fl
ict of interest
The authors declare that they have no known competing
fi
nancial interests or personal
relation-ships that could have appeared to in
fl
uence the work reported in this paper.
Appendix A. Supplementary data
Supplementary data to this article can be found online at
https://doi.org/10.1016/j.dib.2019.104515
.
References
[1] Hiroaki Okamoto, Mark E. Schlesinger, Erik M. Mueller (Eds.), ASM Handbook, vol. 3, Alloy Phase Diagrams, ASM, Ohio, 2016.
[2] T.B. Massalski, J.L. Murray, L.H. Bennett, H. Baker (Eds.), Binary Alloy Phase Diagrams, ASM, Ohio, 1986. [3] H. Okamoto, Desk Handbook; Phase Diagrams for Binary Alloys, ASM, Ohio, 2000.