Int. J. Electrochem. Sci., 11 (2016) 6256 – 6265, doi: 10.20964/2016.07.56
International Journal of
ELECTROCHEMICAL
SCIENCE
www.electrochemsci.org
Epoxidation Modification of Renewable Lignin to Improve the
Corrosion Performance of Epoxy Coating
Jiheng Ding1,2, Lin Gu1,* , Wei Dong2, Haibin Yu1,*
1
Key Laboratory of Marine Materials and Related Technologies, Key Laboratory of Marine Materials and Protective Technologies of Zhejiang Province, Ningbo Institute of Materials Technology and Engineering, Chinese Academy of Sciences, Ningbo 315201, P. R. China
2
School of Chemical Engineering, Nanjing University of Science and Technology, Nanjing 210094, P. R. China
*
E-mail: [email protected], [email protected]
Received: 13 April 2016 / Accepted: 19 May 2016 / Published: 4 June 2016
The epoxidation modification of renewable lignin was achieved by using epichlorohydrin under alkaline condition. Modified lignin (ELG) was characterized by FTIR and used to improve the corrosion performance of epoxy coatings. SEM images showed that ELG was well-dispersed in epoxy coatings, indicating that good compatibility of modified lignin with the epoxy resin. The anticorrosive properties of ELG/epoxy coatings coated on Q235 steel in 3.5% NaCl solution were studied by polarization curves and electrochemical impedance spectroscopy (EIS). Compared with pure epoxy coating, the addition of ELG greatly improved the corrosion protection performance of Q235 steel. Especially, the epoxy coating with 2% ELG achieves high corrosion protection performance.
Keywords: lignin; epoxy resin; anticorrosion; Q235 Steel
1. INTRODUCTION
Epoxy coatings have high resistance to organic solvent and alkaline solution, strong adhesion to various substrates, which is widely used as anticorrosive coating [5]. However, the corrosion resistance of pure epoxy coating is limited, and it is hence required to add rust-resisting pigment to enhance the corrosion protection performance [6, 7]. Most of rust-resisting pigments frequently used are inorganic compounds, such as iron oxide (Fe2O3), powdered aluminium, glass flake, etc. Tambe et al.
investigated the influence of Fe2O3 content on the mechanical and corrosion protection performance of
coatings [8]. However, dispersibility and compatibility of nano Fe2O3 particles with the epoxy coating
are poor, resulting in the formation of microvoid in the interfaces between Fe2O3 particles and epoxy
resin matrix [9].Liu et al. reported that Fe2O3 was modified with epoxy resin under high temperature
ball milling, which improved the compatibility between Fe2O3 particles and epoxy resin, and hence
enhanced the corrosion protection property of epoxy coating [10]. Lignin is an inexpensive natural three-dimensional aromatic polymer, which is expected to incorporate into the polymer matrix to fully realize its potential [11]. However, similar to the inorganic pigment, its incompatibility with polymer matrix is poor [3]. Therefore, lignin needs to be modified to improve the compatibility with polymer matrix.
In the present work, the epoxidation modification of renewable lignin was successfully achieved by the reaction of hydroxyl groups of lignin with epichlorohydrin under alkaline conditions. The modified lignin (ELG) was easily incorporated into industrial epoxy coating systems (ELG-EP). The anticorrosive properties of ELG-EP with various ELG contents were evaluated by electrochemical impedance spectroscopy (EIS) and Tafel polarization curves. Furthermore, the influence of ELG on the corrosion protection property was investigated.
2. EXPERIMENTAL
2.1 Materials
High purity lignin (LG) was provided by Shandong Weili Group Co., Ltd. Bisphenol A epoxy resin E44 and curing agent polyamide were purchased from JiangSu Wujiang City Heli Resin Co., Ltd. Epichlorohydrin (ECH), hydrochloric acid (HCl), tetraethyl ammonium bromide (TEAB), pyridine, toluene, sodium hydroxide (NaOH) were purchased from Aladdin Industrial Corporation. All chemicals were used without further purification.
The Q235 steel was sealed with cured epoxy resin and selected for anticorrosion test. The exposed surface was gradually abraded with SiC abrasive paper up to 1500 grit, then rinsed with distilled water, degreased by ultrasonication in acetone and finally dried with nitrogen.
2.2 Epoxidation modification of lignin
the reaction mixture was cooled down to room temperature, and then was filtered and washed with water twice. Finally, the epoxidation modified lignin (ELG) product was dried at 40 °C in vacuum till constant weight. The epoxy value of the obtained ELG was determined by HCl–pyridine method.
2.3 Preparation of ELG/epoxy anticorrosive coatings
The epoxy resin E44 contained ELG powders at various weight ratios (referred as 1 wt%, 2 wt%, 5 wt% and 10 wt%) were mixed with curing agent polyamide and solvent. The weight ratio of E44 and curing agent was 4:1. The mixture was vigorous stirred for 10 min, and then were applied on the Q235 steel electrode surfaces with a bar coater. Coatings were dried at room temperature for 48 h. The dry coating thickness was 90±10 μm measured by Qnicx 4500 apparatus.
2.4 Characterizations
FTIR spectra were obtained on a NICOLET 6700 Thermo spectrometer by collecting 32 scans at a spectral resolution of 4 cm-1. The morphology of the coatings was observed using a FEI Quanta FEG 250 scanning electron microscope (SEM).
Electrochemical corrosion test was performed on a CHI-660E electrochemical workstation. The electrochemical impedance spectroscopy (EIS) and potentiodynamic polarization curves were obtained in 3.5 wt% NaCl aqueous solution using classical three-electrode cell system at room temperature. A saturated calomel electrode (SCE) equipped with a Luggin capillary, a platinum plate of 2.5 cm2 and coating/Q235 steel was used as the reference electrode, counter electrode and working electrode, respectively. Before measurement, the coating/Q235 steel specimen were initially kept at an open circuit potential (OCP) for 0.5 h. For EIS measurement, the test frequency range was 105-10-2 Hz and the amplitude of the sinusoidal voltage signal was 20 mV. The EIS data were analyzed using ZsimpWin 3.21 software. Polarization curves were performed from -250 mV to +250 mV vs.OCP at a scan rate of 0.5 mV/s.
3. RESULTS AND DISCUSSION
3.1 Preparation and characterization of epoxidation modified lignin (ELG)
Scheme 1. Synthetic route for epoxidation modified lignin.
3500 3000 2500 2000 1500 1000 500
T
r
a
n
sm
it
ta
n
c
e
Wavenumbers/cm-1
744
910 3440
3410
LG
ELG 2930
2850
[image:4.596.170.425.219.421.2]1600 1510 1450
Figure 1. FTIR spectra of LG and ELG.
3.2 Preparation and characterization of ELG/epoxy anticorrosive coatings
[image:4.596.176.423.579.693.2]The ELG/epoxy coatings (ELG-EP) were obtained by a curing reaction of Bisphenol A epoxy resin E44 contained ELG with low molecular weight polyamide at room temperature.
In order to study the dispersing state of ELG in epoxy coating, SEM was employed to examine the fracture surfaces of ELG/EP coatings, as shown in Figure 2. The fracture surface of pure epoxy (EP) and 2% ELG-EP coating was relatively smooth and dense. Furthermore, the ELG in epoxy coating was uniformly dispersed, and no aggregates were observed. Similar result has been reported that the modified iron oxide with epoxy resin improved its compatibility and dispersion capability in epoxy coating [10]. However, the content of ELG above 2 wt% resulted in the formation of aggregates.
3.3 Anticorrosive properties of ELG/epoxy coatings
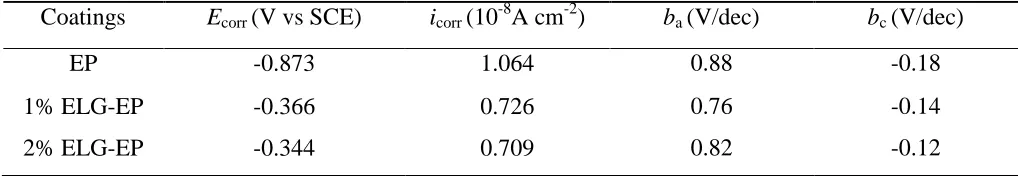
To investigate the corrosion protection performance of the ELG-EP coatings with different contents of ELG, Tafel polarization curves and electrochemical impedance spectroscopy (EIS) were used to study the anticorrosive behaviors of composite coatings. Figure 3 displays the polarization curves of pure EP, 1% ELG-EP and 2% ELG-EP coatings immersed in 3.5 wt% NaCl solution after 2160 h, and their corrosion parameters (corrosion current density (icorr) and corrosion potential (Ecorr))
are listed in Table 1. Compared with pure EP coating, 1% and 2% ELG-EP coating showed more positive Ecorr and lower icorr, indicating that the ELG-EP coating exhibited better anticorrosive
performance than pure EP coating [13, 14].
-10 -9 -8 -7
-1.0 -0.8 -0.6 -0.4 -0.2 0.0
bc=-0.18
ba=0.88
b
c=-0.12
bc=-0.14
b
a=0.76
ba=0.826
EP 2% ELG-EP
1% ELG-EP
log i / A cm-2
E
(V
)v
s.
S
C
E
Figure 3. Tafel polarization curves of pure EP, 1% ELG-EP and 2% ELG-EP coatings/Q235 steel
[image:5.596.188.404.388.552.2]immersed in 3.5 wt% NaCl solution after 2160 h.
Table 1. Corrosion parameters of different coatings in 3.5 wt% NaCl solution under 2160 h immersion
time.
Coatings Ecorr (V vs SCE) icorr (10-8A cm-2) ba (V/dec) bc (V/dec)
EP -0.873 1.064 0.88 -0.18
1% ELG-EP -0.366 0.726 0.76 -0.14
[image:5.596.43.552.672.760.2]
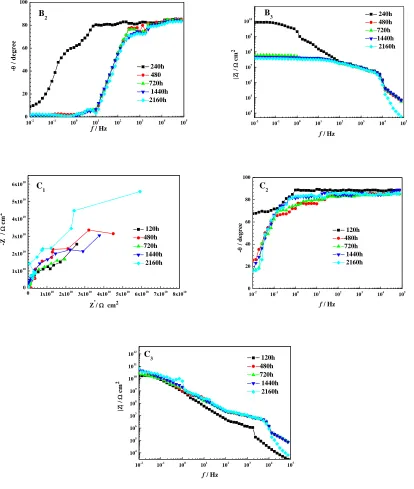
As is well known, EIS is a powerful tool to evaluate the anticorrosive properties of organic coatings [15-17]. Figure 4 depicts the Nyquist and Bode plots of pure EP, 1% EP, and 2% ELG-EP coatings immersed in 3.5 wt% NaCl solution under different times (240–2160 h). In the early stage of immersion, the phase angle of pure EP coating was closed to 80° at the range of 103–105 Hz and 23°
at frequency of 10-2 Hz, and gradually decreased in the whole frequency range (Figure 4A2). After 720
h immersion, the phase angle decreased rapidly and approached 19° at frequency of 10-2
Hz, and then remained unchanged during the subsequent immersion. For the 1% ELG-EP coating, the phase angle was about 80° in the 101–105
Hz range (Figure 4B2). After 720 h immersion, the phase angle was
closed to 80° at the range of 102–105 Hz and approached 2° at frequency of 10-2
Hz, and then kept unchanged in the latter stage immersion. For the 2% ELG-EP coating, the phase angle was about 90° in the 100–105 Hz range and approached 70° at frequency of 10-2 Hz (Figure 4C2). After 720 h
immersion, the phase angle was above 80° at the range of 101–105 Hz and approached 26° at frequency
of 10-2 Hz, and then kept at this level. However, the phase angle of 2% ELG-EP coating was higher than that of pure EP and 1% ELG-EP over the whole frequency range in the same immersion time. But the content of ELG above 2 wt% resulted in the formation of aggregates, and hence the corrosion rate increased [18].
The impedance modulus at 10-2 Hz (|Z|0.01Hz) represents the ability of the coating to impede the
flow of current between anodic and cathodic areas, which is inversely proportional to corrosion rate [13, 19]. The |Z|0.01Hz of pure EP coating in the initial 240 h immersion were 2.26×10⁸ Ω cm2. After 480
h immersion, this Z|0.01Hz dropped gradually and maintained at 4.5×10⁷ Ω cm2 (Figure 4A3).
0.0 5.0x10⁷
1.0x10⁸ 1.5x10⁸ 2.0x10⁸ 2.5x10⁸ 3.0x10⁸ 0.0 5.0x10⁶ 1.0x10⁷ 1.5x10⁷ 2.0x10⁷ 2.5x10⁷ 3.0x10⁷ 3.5x10⁷ 4.0x10⁷
5.0x10⁶ 1.0x1071.5x1072.0x1072.5x1073.0x107
1x10⁶ 2x10⁶ 3x10⁶ 4x10⁶ 5x10⁶ 6x10⁶ 7x10⁶ 8x10⁶ 9x10⁶ 480h 720h 1440h 2160h
Z'/ cm2
-Z
''/
cm
2
Z'/ cm2
-Z ''/ cm 2 240h 480h 720h 1440h 2160h A1 10-2 10-1 100 101 102 103 104 105 0 20 40 60 80 100 240h 480h 720h 1440h 2160h - / d e g r e e
f / Hz
A2 10-2 10-1 100 101 102 103 104 105 5.0x10⁷ 1.0x10⁸ 1.5x10⁸ 2.0x10⁸ 2.5x10⁸ 3.0x10⁸ 240h 480h 720h 1440h 2160h cm 2
f / Hz
A3 2.0x10⁹ 4.0x10⁹ 6.0x10⁹ 8.0x10⁹ 1.0x10¹⁰ 1x10⁹ 2x10⁹ 3x10⁹ 4x10⁹ 5x10⁹
0 1x10⁷ 2x1073x107 4x1075x107 6x1077x107
0.0 4.0x10⁶ 8.0x10⁶ 1.2x10⁷ 1.6x10⁷ -Z
''/ cm
2
Z'/ cm2
480h 720h 1440h 2160h 240h 480h 720h 1440h 2160h -Z ''/ cm 2
Z'/ cm2
10-2 10-1 100 101 102 103 104 105 0 20 40 60 80 100
f / Hz
- / d e g r e e B2 240h 480 720h 1440h 2160h 10-2 10-1 100 101 102 103 104 105 104 105 106 107 108 109 1010 B 3
f / Hz
cm 2 240h 480h 720h 1440h 2160h
0 1x10¹⁰
2x10¹⁰ 3x10¹⁰ 4x10¹⁰ 5x10¹⁰ 6x10¹⁰ 7x10¹⁰ 8x10¹⁰ 0 1x10¹⁰ 2x10¹⁰ 3x10¹⁰ 4x10¹⁰ 5x10¹⁰ 6x10¹⁰ C1
Z'/ cm2
-Z ''/ cm 2 120h 480h 720h 1440h 2160h
10-2 10-1 100 101 102 103 104 105
0 20 40 60 80 100 C2 120h 480h 720h 1440h 2160h - / d eg re e
f / Hz
10-2 10-1 100 101 102 103 104 105
104 105 106 107 108 109 1010 1011 1012
C3 120h
480h 720h 1440h 2160h cm 2
[image:7.596.88.502.87.576.2]f / Hz
Figure 4. Nyquist and Bode plots of pure EP (A1–A3), 1% ELG-EP (B1–B3), and 2% ELG-EP (C1–C3)
coatings immersed in 3.5 wt% NaCl solution under different times.
For the 1% ELG-EP coating, the Z|0.01Hz decreased gradually from 1.0×10¹⁰ Ω cm2 to 8.5×10⁸ Ω
cm2 and then remained stable (Figure 4B3). For the 2% ELG-EP coating, the Z|0.01Hz increased from
1.1×10¹⁰
Ω cm2 to 6.5×10¹⁰ Ω cm2 during 480 h immersion, and then remained at this level (Figure 4C3). Compared with pure EP coating, the Z|0.01Hz values of 1% ELG-EP and 2% ELG-EP coatings
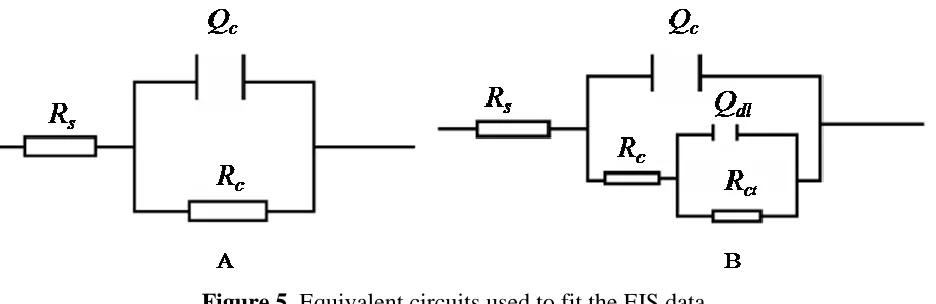
For quantitative estimate the evolution of the anticorrosion properties of the composite coatings, EIS data were fitted with equivalent circuits for stage I and II, as shown in Figure 5. Rs, Rc and Rct
represent the solution resistance, coating resistance and charge-transfer resistance, respectively. Qc and
Qdl represent the coating capacitance and double-layer capacitance, respectively [20]. In the early stage
[image:8.596.70.538.260.412.2]of immersion, Nyquist plots of pure EP coatings showed pure capacitance loop, and the equivalent circuit R(QR) (Figure 5A ) was chosen for the fitting procedure. The pure EP coating showed two capacitance loops with immersion time increased, and the equivalent circuit R(Q(R(QR)) (Figure 5B ) was chosen for the fitting procedure [10]. However, for 1% ELG-EP and 2% ELG-EP coatings, their Nyquist plots displayed pure capacitance loop during 2160 h of immersion, and the equivalent circuit R(QR) was selected (Figure 5A ) for the fitting procedure.
Figure 5. Equivalent circuits used to fit the EIS data.
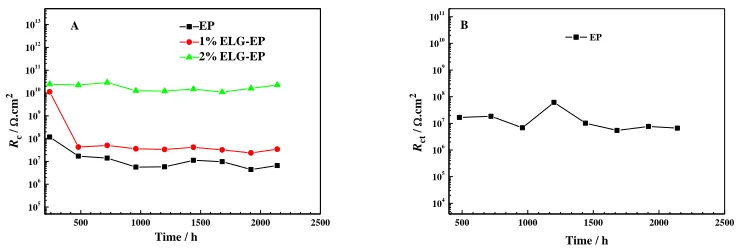
Figure 6 shows Rc and Rct of different ELG-EP coatings as a function of immersion times.
Generally, a higher Rc implies a smaller number of H2O, O2 and Cl- molecules penetrated into the
coatings [21]. The Rc of pure EP and 1% ELG-EP coatings decreased from the initial value of 1.0×10⁸
Ω cm2
and 1.0×10¹⁰ Ω cm2 to a steady value of 1.1×10⁷ Ω cm2 and 6.0×10⁷ Ω cm2 after 480 h immersion, respectively. However, for the 2% ELG-EP coating, its Rc value remained at about
2.5×10¹⁰ Ω cm2
during 2160 h of immersion. Rct is a parameter of the resistance to electron transfer
across a metal surface and is inversely proportional to the corrosion rate [22]. The Rct of pure EP
coating fluctuated and stabilized at about 3×10⁷ Ω cm2
during 2160 h of immersion. The Rct of 1%
500 1000 1500 2000 2500
105
106
107
108
109
1010
1011
1012
1013
EP 1%ELG-EP 2%ELG-EP
Rc
/
.c
m
2
Time / h A
500 1000 1500 2000 2500
104
105
106
107
108
109
1010
1011
Rct
/
.c
m
2
Time / h
EP
[image:9.596.110.480.83.209.2]B
Figure 6. Changes of Rc (A) and Rct (B) curves as a function of immersion times.
4. CONCLUSIONS
Epoxidation modified lignin (ELG) was prepared by the reaction of hydroxyl groups of lignin with ECH under alkaline condition. The ELG was easily incorporated into epoxy systems by mixing epoxy resin with ELG, followed by crosslinking with polyamide curing agent. The epoxy coatings containing 2.0% ELG showed better anticorrosive effect than pure EP coating, on the basis of Tafel polarization curves and EIS. The remarkably enhanced anticorrosive property could be ascribed to the compatibility and interface bonding of ELG with the epoxy resin were improved, reducing the diffusion channel of water and the interface defect between ELG and the resin.
ACKNOWLEDGEMENTS
The research is financially supported by the National Natural Science Foundation of China (Grant no. 21404112), China Postdoctoral Science Foundation (Grant no. 2014M561798) and Open Project of Key Laboratory of Marine Materials and Related Technologies (Grant no. 2016K07).
References
1. Y. Pan, J. Zhan, H. Pan, W. Wang, G. Tang, L. Song, and Y. Hu, ACS Sustain. Chem. Eng., 4 (2016) 1431.
2. L. Gu, B. Cui, Q. Wu, and H. Yu, RSC Adv., 6 (2016) 17888.
3. D. Kai, M.J. Tan, P.L. Chee, Y.K. Chua, Y.L. Yap, and X.J. Loh, Green Chem., 18 (2016) 1175. 4. K. Xia, Q. Ouyang, Y. Chen, X. Wang, X. Qian, and L. Wang, ACS Sustain. Chem. Eng., 4 (2016)
159.
5. S.A. Kumar, and Z. Denchev, Prog. Org. Coat., 66 (2009) 1.
6. L. Veleva, J. Chin, and B. del Amo, Prog. Org. Coat., 36 (1999) 211.
7. J.R. Vilche, E.C. Bucharsky, and C.A. Giúdice, Corros. Sci., 44 (2002) 1287. 8. S.P. Tambe, S.K. Singh, M. Patri, and D. Kumar, Prog. Org. Coat., 72 (2011) 315. 9. X. Shi, T.A. Nguyen, Z. Suo, Y. Liu, and R. Avci, Surf. Coat. Technol., 204 (2009) 237. 10.X. Liu, Y. Shao, Y. Zhang, G. Meng, T. Zhang, and F. Wang, Corros. Sci., 90 (2015) 451. 11.C. Jiang, H. He, X. Yao, P. Yu, L. Zhou, and D. Jia, J. Appl. Polym. Sci., 132 (2015), DOI:
12.N.E. El Mansouri, Q. Yuan, and F. Huang, BioResources, 6 (2011) 2492. 13.L. Gu, S. Liu, H. Zhao, and H. Yu, ACS Appl. Mater. Interf., 7 (2015) 17641. 14.L. Gu, S. Liu, H. Zhao, and H. Yu, RSC Adv., 5 (2015) 56011.
15.L. Gu, X. Zhao, X. Tong, J. Ma, B. Chen, S. Liu, H. Zhao, H. Yu, and J. Chen, Int. J. Electrochem. Sci., 11 (2016) 1621.
16.B. Chen, J. Ma, L. Gu, S. Liu, H. Zhao, H. Yu, and J. Chen, Int. J. Electrochem. Sci., 10 (2015) 9154.
17.J. Ma, Y. Zhou, J. Xu, L. Gu, G. Lai, B. Chen, S. Liu, H. Zhao, H. Yu, and J. Chen, Int. J. Electrochem. Sci., 10 (2015) 10104.
18.A. Singh, K. Yadav, A. K. Sen, Am. J. Polym. Sci., 2 (2012) 14.
19.L. Gu, J. Ding, S. Liu, and H. Yu, Chinese J. Chem. Phys., 29 (2016) 271.
20.S. Liu, L. Gu, H. Zhao, J. Chen, and H. Yu, J. Mater. Sci. Technol., 32 (2016) 425. 21.Y. Zhang, Y. Shao, T. Zhang, G. Meng, and F. Wang, Prog. Org. Coat., 76 (2013) 804. 22.H. Wei, D. Ding, S. Wei, and Z. Guo, J.Mater. Chem. A, 1 (2013) 10805.
23.X. Liu, Y. Shao, Y. Zhang, G. Meng, T. Zhang,and F. Wang, Corros. Sci., 90 (2015) 463.