N
O. 171/A
UGUST2001
T
HE
E
XTENT OF
E
CONOMIC
I
NTEGRATION
IN
E
UROPE
:
B
O R D E R
E
F F E C T S
, T
E C H N I C A L
B
A R R I E R S TO
T
R A D E
& H
O M E
B
IAS IN
C
O N S U M P T I O N
P
A U LB
R E N T O N&
M
A R CV
A N C A U T E R E NCEPS Working Documents are published to give an early indication of the work in progress within CEPS research programmes and to stimulate reactions from other experts in the field. Unless otherwise indicated, the views expressed are attributable only to the author in a personal capacity and not to any institution with which he is associated.
ISBN 92-9079-338-4
Border Effects, Technical Barriers to Trade
and Home Bias in Consumption
Paul Brenton and Marc Vancauteren
∗∗CEPS Working Document No. 171, August 2001
Abstract
This paper brings together two important facets of current debates concerning trade policy and trade modelling: the importance of estimated border effects and the impact of technical barriers to trade. Here we try and identify the effect of technical barriers on the imports of EU countries by estimating gravity equations applied to data in which sectors are grouped according to the approach adopted by the EU to the removal of technical barriers (New Approach, Old Approach, mutual recognition) as well as an aggregate of sectors for which technical barriers are deemed to be unimportant. Our results suggest substantial border effects for all groups of sectors except for those subject to mutual recognition. The border effect is mitigated but remains considerable against trade with EU partners. High and persistent border effects are found for sectors where technical barriers are not important suggesting that factors other than policy-induced barriers are important determinants of the intensity of internal relative to external trade flows. The paper discusses the interpretation of these border effects in the context of measuring the extent of economic integration and argues that more information on the nature of preferences and on factors promoting local networks of buyers and suppliers is required before we can proceed to examine the policy implications.
∗∗
The Extent of Economic Integration in Europe:
Border Effects, Technical Barriers to Trade
and Home Bias in Consumption
Paul Brenton and Marc Vancauteren
1. IntroductionThis paper seeks to bring together in an empirical study two issues which are at the top
of the agenda of trade policy discussions and at the forefront of research on trade
modelling. Specifically, we consider for EU countries the magnitude of what have been
called ‘border effects’, the extent to which internal trade exceeds international trade
after controlling for the economic determinants of commerce. The size of the border
effect has been used as an indicator of the extent of economic integration relative to the
benchmark of perfect integration, defined as when the propensity for international trade
is the same as that for internal trade. In addition we consider this issue in the context of
the impact of regulatory policies on international trade flows. We look at the extent of
economic integration for sectors grouped according to whether technical regulations are
important and then by the approach adopted by the EU to remove technical barriers to
intra-EU trade.
The importance of regulatory policies in trade policy discussions has risen in recent
years. Of these regulatory issues technical barriers to trade arising from differences in
national product standards and duplication of conformity assessment procedures are of
primary importance. This reflects the increasing number and coverage of product
standards and that as tariffs and quantitative restrictions have been progressively
removed over the past 40 years the effect of these “inside the border” policies have
become more visible.
Technical barriers to trade have been addressed in the GATT and the WTO. There are
also a number of recent initiatives at the bilateral level. The EU has recently signed
mutual recognition agreements with Australia, Canada New Zealand and the US to
avoid duplication of product testing and conformity assessment for a number of
have been made within the EU. One of the central objectives of the Single Market
Programme of the EU is the removal of such barriers to trade within the EU. It is worth
noting that since all tariffs and quantitative restrictions have been removed on
(non-agricultural) trade between the EU and the Central and Eastern European countries, the
key impact of the next enlargement on trade will be via access to the Single Market and
the removal of technical trade barriers.
The principal mechanisms used by the EU to achieve the Single Market have been the
principle of mutual recognition, whereby an product lawfully produced and sold in any
one EU member must be given free access to all other EU markets, and where this fails
through the use of harmonised standards. Prior to the Single Market, the dominant (now
“old”) approach in the EU was one of very detailed harmonisation subject to unanimity
in the EU Council. This approach failed in that the number of new regulations appearing
in the 1980s far exceeded the rate at which harmonised regulations were being
generated. This led to the “new” approach, whereby technical barriers to trade are
removed by the setting of minimum standards on the basis of majority voting.
In this paper we seek to estimate the extent to which the EU approach to technical
harmonisation has affected the pattern of bilateral trade flows of individual EU
countries. Empirical assessments of the impact of technical barriers and their removal
are very rare and those that are available typically take the very unsatisfactory approach
of assuming that technical barriers raise trade costs by a certain ad hoc proportion.
Here we use the gravity model of international trade flows to assess whether increasing
integration in the form of the removal of technical barriers to trade has had a significant
impact on the magnitude of estimated border effects in European countries. The model
is applied to data that identifies separately sectors subject to the different approaches to
the removal of technical barriers in the EU. The paper continues in Section 2 by briefly
describing the EU approach to the removal of technical barriers to trade. Section 3
discusses the empirical approach and then the data that are used to examine the impact
of technical barriers to trade in the EU. Section 4 presents our results, whilst Section 5
discusses the interpretation of the estimated border effects and the extent to which they
may reflect the impact of policy induced restrictions or are the result of factors such as
networks of suppliers and buyers. The final section presents some conclusions regarding
measurement of the current and potential level of integration in the EU and globally.
2. The EU Approach to Technical Barriers to Trade
Technical barriers to trade (TBTs) can arise when exporters have to comply with
requirements for, amongst other issues, health, safety, environmental and consumer
protection that differ from those in the domestic market. The need to adapt product
design, re-organise production systems, and the costs of multiple testing and
certification can entail significant additional costs for suppliers of exported goods to a
particular country. These requirements can be imposed by both governments (technical
regulations) and non-governmental organisations (non-regulatory barriers, standards).
Technical regulations are characterised by their legal nature whilst non-regulatory
barriers or standards are voluntary and arise from the self-interest of producers or
consumers, for example, to improve the information in commercial transactions and
ensure compatibility between products. Technical regulations relate to technical
specifications and testing and certification requirements such that the product actually
complies with the specifications to which it is subjected (conformity assessment).
Technical regulations are the focus of this paper, although the boundary between
mandatory and non-regulatory barriers is not always clear-cut (CEC (1998a)).
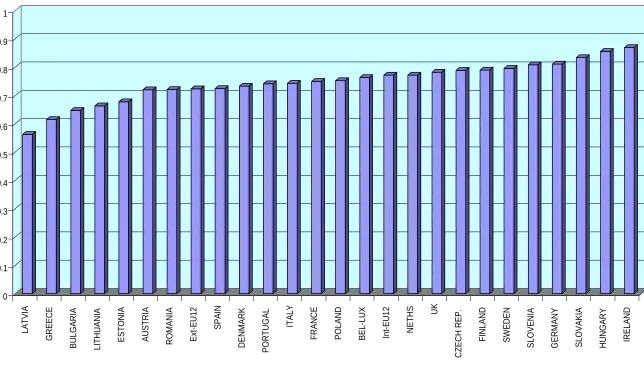
The height of the bars in Figure 1 show the share of EU imports in 1998 from each
member state as well as applicant countries in Central and Eastern Europe in sectors
which are categorised as being prone to technical barriers to trade.1 This figure demonstrates that a very large proportion of intra-EU trade is in sectors affected by
technical regulations. On average more than three-quarters of intra-EU imports are in
sectors where differences in technical regulations are important. The significance of
these sectors ranges from around 62 per cent of EU imports from Greece to 82 per cent
of EU imports from Germany and 87 per cent of EU imports from Ireland.2
The removal of TBTs due to differences in technical regulations amongst member states
is central to the creation of a Single Market in Europe. EU policy related to technical
1
We discuss the source of this categorisation later in the paper.
2
regulations and testing and certification requirements is currently based upon two
approaches: enforcement of the Mutual Recognition Principle (MRP) and if this fails,
the harmonisation of technical standards across member states. The basic EU approach
under the principle of Mutual Recognition is that products manufactured and tested in
accordance with the technical regulations of one member state can offer equivalent
levels of protection to those provided by corresponding domestic rules and procedures
in other member states. Thus, once a product is legally certified for sale in any one
member state it is presumed that it can be legally placed on the market of any member
state, and as such has free circulation throughout the whole of the Single Market.
‘Mutual Recognition’ tends to apply where products are new and specialised and it
seems to be relatively effective for equipment goods and consumer durables, but it
encounters difficulties where the product risk is high and consumers or users are
directly exposed.
Where ‘equivalence’ between levels of regulatory protection embodied in national
regulations cannot be presumed, the EU has sought to remove TBTs through agreement
on a common set of legally binding requirements. Subsequently, no further legal
impediments can prevent market access of complying products anywhere in the EU
market. The initial approach adopted in the EU to harmonising technical specifications
was based upon extensive product-by-product or even component-by-component
legislation carried out by means of detailed directives. Now known as the ‘old
approach’ this type of harmonisation proved to be slow and cumbersome. In the 1980s
the ineffectiveness of this approach was recognised when it became apparent that new
national regulations were proliferating at a much faster rate than the production of
harmonised EU directives (Pelkmans (1987)).
This failure arose because the process of harmonisation had tended to become highly
technical as it sought to specify individual requirements for each product category
(including components). This resulted in extensive and drawn-out consultations. In
addition delays arose because the adoption of old approach directives required
unanimity in the Council of Ministers. As a result the harmonisation process proceeded
vehicles, pharmaceuticals and foodstuffs) by which the nature of the risk is clearly
apparent.
In the 1980s it became increasingly recognised that there was a need to reduce the
intervention of the public authorities prior to a product being placed on the market. A
key element in the plan to create a Single Market in Europe was the adoption of the
‘new approach’ to technical harmonisation under which directives can be adopted by the
Council on the basis of majority voting. The new approach applies to products that have
“similar characteristics” and where there has been widespread divergence of technical
regulations in EU countries. The key feature of this approach is that it only indicates
‘essential requirements’ and leaves greater freedom to manufacturers on how to satisfy
those requirements, dispensing with the ‘old’ type of exhaustively detailed directives.
The new approach directives provide for more flexibility by using the support of the
established standardisation bodies, CEN, CENELEC and the national standard bodies so
that the standardisation work is achieved in a more efficient way, is easier to update and
involves greater participation from industry. In addition, the new approach is
characterised by the use of market surveillance and the choice of attestation methods
that are available: by self-certification against the essential requirements, by using
generic standards or by using notified bodies for type approval and testing of
conformity of type.
3. Modelling the Impact of Technical Barriers to Trade
3.1 Overview
Modelling the impact of tariffs and quantitative restrictions is relatively straightforward,
both raise the costs of traded goods relative to domestic substitutes driving a wedge
between international and internal prices. Given normal demand and supply curves the
removal of such barriers will stimulate the volume of trade. To date the principal
estimates of the impact of technical barriers have been based upon the same
methodological approach, although precise estimates of the impact of technical barriers
to trade on costs are not available.
Using calibrated simulation models or estimated demand schedules, researchers
example, Gasiorek, Smith and Venables (1991) and Brenton and Winters (1992a) in
different exercises assume that the completion of the Single Market implies a 2.5 per
cent reduction in trade costs for all EU members. This assumption also encapsulates the
impact of the removal of internal border controls and (supposedly) the end of bias in
government procurement decisions. More recently, Francois (1998), takes accession to
the EU for CEECs to entail an across the board reduction in trade costs of 10 per cent.
These studies provide ex ante predictions rather than careful ex post analyses of what
actually happened following harmonisation of technical barriers to trade.
An alternative, and widely used, approach to modelling the impact of economic
integration is to use the gravity model.3 This provides an explanation of bilateral trade flows with the impact of integration being identified through the use of country and
country group specific dummy variables that pick up deviations from the ‘normal’
pattern of trade. This obviates the need for precise estimates of the impact of trade
barriers on costs. Thus, for example, the impact of the EU on trade can be measured via
a dummy variable for all bilateral trade flows between EU member countries. This
measures the extent to which trade between EU members is higher than ‘normal’ as
determined in the gravity model by the income and proximity of trading partners.
Recently, following initial work by McCallum (1995) the gravity model has been used
to assess the extent of ‘border effects’ in terms of the propensity for trade within a
country to exceed international trade. McCallum reports results suggesting that
Canadian provinces are more than twenty times more likely to trade amongst
themselves than they are to trade with US States after allowing for economic size and
distance between economic centres. The dataset used by McCallum appears to be
unique in identifying trade amongst the regional subsets of two trading partners. For
other countries researchers have attempted to identify border effects by including in the
gravity model observations for home sales and identifying the border effect via a
dummy variable for those observations. Nitsch (2000), for example, finds evidence of
substantial border effects in Europe, with internal trade being on average larger by a
factor of ten than trade with EU partners, and that the magnitude of this effect declined
3
during the 1980s. As we shall discuss in more detail below it is important to clarify
what is meant by the border effect. For now we simply note that in the context of the
gravity model the dummy variable for home sales could capture the effects of a range of
factors which constrain trade relative to domestic exchanges. These include border trade
barriers, differences in regulatory regimes, for example, regarding technical regulations,
differences in institutional and legal frameworks, which generate insecurity for
international traders4, as well as differences in preferences.
Head and Mayer (2000) apply a gravity approach to sectoral data for the EU countries
and then assess whether there is any correlation between the size of the estimated border
effect and a crude classification of sectors according to the magnitude of non-tariff
barriers. They find that the indicator of non-tariff barriers cannot explain the variation
across industries in the size of estimated border effects and that there is no relation
between declines in the size of the border effect since the creation of the Single Market
and indicators of NTBs. They conclude that bias in preferences towards domestically
produced goods must underlie the border effects that were identified.
Here we start from sectoral data but differentiate sectors into broad groups according to
a more recent classification which specifically identifies sectors according to whether
differences in technical regulations amongst countries are important or not, and if so, by
the approach adopted within the EU to the removal of technical barriers to trade, the old
approach, mutual recognition and the new approach. We then apply the gravity model to
these separately identified groups of sectors and look for differences in border effects
between the different groups of sectors and also whether the magnitude of these effects
has declined over time.
Unlike Nitsch we use the gravity model to explain the pattern of bilateral trade flows of
EU countries with countries throughout the world, not just trade amongst EU partners.
Hence, we are also able to assess whether the intensity of intra-EU trade flows relative
to external imports differs across our different groups of sectors and whether the
magnitude of this intra-EU affect has changed over our sample period. To summarise
the objectives of this paper we look to see whether:
4
• There are significant differences in the parameter values of the gravity model when
applied to sectors where technical regulations are not deemed to be a potential
barrier to trade, to sectors where technical regulations are important, and within this
latter group whether there are differences between sectors according to the approach
adopted in the EU for the removal of technical barriers to trade.
• To see whether there are differences in the size of estimated border effects between
the different groups of sectors and whether the magnitude of the border effect has
changed over time. Within this we wish to investigate whether
- the degree of the border effect is lower for sectors which have already been
subjected to the harmonisation of technical regulations, old approach sectors
- sectors subject to the new approach in the EU, where we might expect the
impact of economic integration in the form of the Single Market to be strongest,
have experienced the greatest fall in the border effect during our sample period
of 1988 to 1998. The policy environment in sectors subject to detailed
harmonisation under the old approach has changed little over this period.
• Whether the impact of the preferential treatment of imports from EU partners
relative to third countries differs across our groups of sectors and whether there are
any definite patterns of change in this EU effect over time.
3.2 Data and Econometric Approach
3.2.1 The Sectoral Incidence of Technical Barriers
We utilise information on the sectoral incidence of technical barriers and the particular
approach adopted by the EU to their removal. The data come from the detailed study
undertaken for the Commission’s review of the impact of the Single Market in the EU
(CEC (1998)). This study provides information, at the 3-digit level of the NACE
classification (about 120 manufacturing industries), of whether trade is affected by
such barriers in the EU.5 For sectors where technical regulations affect trade, the study classifies them as those where the barriers are overcome using mutual recognition
(MR), and those sectors where mutual recognition is insufficient or unsuitable so that
either the old approach (OA) or the new approach (NA) to overcoming technical
barriers is used. For these sectors it is assumed that all trade is affected by the technical
regulations and by the identified approach to the removal of the barriers. There are
however, a small number of sectors where a combination of approaches is identified. In
the main, we ignore these in the analysis that follows.
3.2.2 The Gravity Model
The gravity model is a well-known and widely applied model of bilateral trade flows.
The essence of the model is that trade between two countries is promoted by their
economic mass and constrained by the friction between them. Friction is generated by
trade costs, such as the costs of transportation, which are usually proxied by physical
distance. The theoretical underpinning of the model is broad but imprecise. A number of
recent applications of the model are motivated by an application of monopolistic
competition models of trade (see, for example, Anderson and van Wincoop (2000))
although Deardorff (1995) has shown that gravity type equations are also consistent
with a Heckscher-Ohlin approach and indeed that “just about any plausible model of
trade would yield something very like the gravity model, whose empirical success is
therefore not evidence of anything, but just a fact of life”. We return to discuss the
theoretical framework of the gravity model and how this affects the interpretation of
measured border effects later.
We estimate the following equation:
∑
+ +
+ +
+ =
ijk
ijk ijk
i ij
j i
ij GDP GDP D R DUM
X α β ln β ln β ln β ln γ
ln 1 2 3 4
where
5
Xij is the value of imports by country i from country j;
GDPi is the level of income in country i;
Dij is the distance between the trading centres of the two countries.
Rij is the remoteness of country i in relation to all trading partners with the exception of
country j. The more remote is country i from other partners the greater the amount of
trade with country j.
DUMijk are a set of k dummy variables. In this exercise separate dummy variables are
included to reflect the effects of adjacency between i and j, if both i and j are members
of the EU, if there is a free trade agreement between i and j, and to reflect the size of the
border effect (j = i).
The economic variables in the gravity model (incomes, distance and remoteness) define
the ‘normal’ level of trade. On the assumption that the gravity model is well specified
the dummy variables capture systematic deviations from this normal pattern of trade due
to physical adjacency, trade policies (such as economic integration agreements) and the
border effect.
3.3.3 Description of the Data
Our data set compromises trade flows for 1988, 1992, 1994 and 1997 between each of
nine EU countries (Belgium and Luxembourg are treated as one) and a sample of
developed (including EU partners) and developing countries. We derived the trade data
according to the NACE industrial classification. Trade in each sector was then
aggregated into our four broad groups of new approach sectors, old approach sectors,
mutual recognition sectors, and sectors where differences in national technical
regulations do not constrain trade flows, according to the classification in CEC (1998)).
Countries were excluded from the sample if there were zero entries in our different
categories of aggregate sectors. The number of countries in the sample differs across
years primarily due to the integration of the former Comecon countries into the world
economy during the 1990s.
We use a definition of remoteness that has been commonly used in the gravity literature
remoteness of importing country i in relation to trading partner j is given as the
weighted average distance between country i and all trading partners other than j, where
the weights are given by the GDP of the trading partners:
Domestic sales are given by the differences between domestic production and the value
of exports. Internal distances dii, are taken from Head and Mayer (2000) and which
were calculated by using the disk area procedure to obtain the average distance between
economic centers. For distances between countries dij, we follow the conventional
method in the gravity literature and measure the direct (great circle) distance between
the economic centres (capital cities).
For our sample years we extracted production data from the EUROSTAT New Cronos
database with reference to the domain of the 'business structural database'. Observations
"covering enterprises with 20 persons employed and more", in NACE revision 1 were
converted to NACE70 so as to provide a consistent series and to match the trade data..
4. Econometric Results
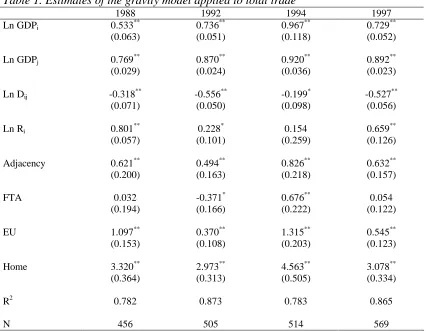
We start our discussion of results by presenting in Table 1 an application of the gravity
model to total imports of the 9 EU countries in our 4 years, 1988, 1992, 1994 and 1997.
This gives us an impression of the magnitude of the border effect in aggregate before
we proceed to the more disaggregate analysis and provides for a comparison with
previous studies. The estimated coefficients on the economic variables, GDP and
location, are all significant, and strongly so with the exception of distance in 1994. The
magnitude of the coefficient on the distance variable is typically smaller than in
previous studies, where the consensus estimate is 0.6 (see Leamer (1997)).
However, these studies usually do not include a variable for remoteness and make no
allowance for home sales and the border effect. Our results on the distance variable
differ from those of Nitsch (2000) who obtains a much larger coefficient on distance but
a small and barely significant impact of remoteness. This probably reflects that Nitsch’s GDPk
sample only includes trade between EU countries where variation in remoteness is more
limited than in our broader sample of trade partners for the EU countries.
These aggregate results suggest strongly significant and large border effects. These
effects are mitigated for EU partners but not for trading partners who have signed a free
trade agreement with the EU, with the exception of 1994. The estimates suggest that in
1988 internal trade within individual EU countries was more than 25 times more
intensive than those countries' trade with partners in the rest of the world after taking
into account incomes, distance and remoteness. On the other hand internal trade was 9
times more intensive than trade with EU partners (derived as the exponential of the
difference between the coefficients on the home and the EU dummy variables). The
level of the border effect was slightly lower in 1997, but the impact of EU membership
in dampening the border effect had waned somewhat relative to 1988.
However, it is worth noting the increase in the border effect in 1994. This may reflect
the change in the recording of trade in Europe after 1992 from customs documentation
to VAT returns. This may have removed some of intra-EU trade that was being
recorded prior to the removal of border frontiers in 1992. Hence, it not certain that we
can make precise comparisons between the magnitude of the estimated border effect
over time. Nevertheless, in our final year, 1997, the magnitude of the border effect
against third countries was a factor of twenty-two whilst internal trade was 13 times
more extensive than trade with EU partners. Our estimates of the border effect in the EU
are slightly larger than in previous studies (Head and Mayer (2000) and Nitsch (2000)).
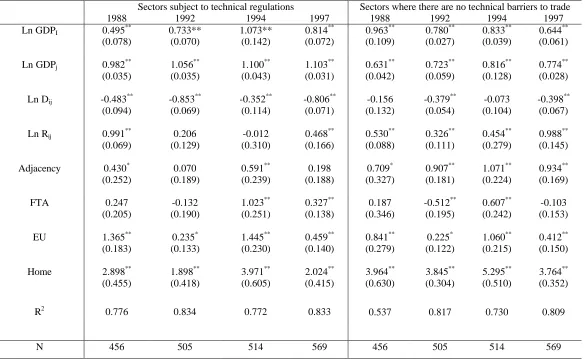
We now turn, in Table 2, to the results of applying the gravity model to two broad
sectoral aggregates, those where technical regulations do not cause barriers to trade and
the sum of sectors subject to the new approach, the old approach or mutual recognition,
sectors where differences in national regulations are important. The income variables
are strongly significant for both groups of sectors in all years. The income effect for the
exporter is larger for sectors subject to technical regulations than for sectors with no
technical barriers to trade. The same is true for importer GDP in the last two years of
our sample. Hence, the share of sectors where differences in technical regulations are
important is likely to increase over time as incomes rise. In general distance and
the different years of our sample. Adjacency is not important in sectors where technical
regulations are important, but is significant for the other group of sectors.
The estimated parameters for the border effect are large and strongly significant in all
years for both groups of sectors. There is some suggestion of a decline in the magnitude
of the border effect for sectors where technical regulations are important, although there
was a big jump in the magnitude of the border effect in 1994. The border effect for
sectors where there are no technical barriers seems to be larger and more persistent.
Being a member of the EU mitigates the dampening effect of the border on trade whilst
the dampening effect of the border on intra-EU trade is greater for sectors with no
technical barriers to trade. The magnitude of the EU preference relative to the border
effect for non-EU partners has, with the exception of 1994, remained relatively constant
for sectors with technical regulations but has fallen a little for sectors with no technical
barriers.
Thus, we find no evidence that the Single Market has increase the intensity of intra-EU
trade relative to internal trade for products where differences in technical regulations are
important, the focus of the Single Market Programme. For sectors where technical
barriers are not important, globalisation and external trade liberalisation may have
reduced the preferential treatment of imports from EU partners relative to non-EU
countries but have done little to reduce the intensity of internal relative to external trade.
Membership of a free trade agreement with the EU does little to offset the effects of the
border for sectors with no technical barriers but has become important for sectors with
important differences in technical regulations in the final two years. This may reflect the
impact of the Single European Area (SEA) which granted access to the Single Market to
EFTA countries, but is also likely to be the result of the foreign direct investment by EU
firms in free trade partners in Central and Eastern Europe which stimulated trade in
sectors such as machinery, where technical barriers to trade can be important. Much of
this investment probably led to production consistent with EU standards.
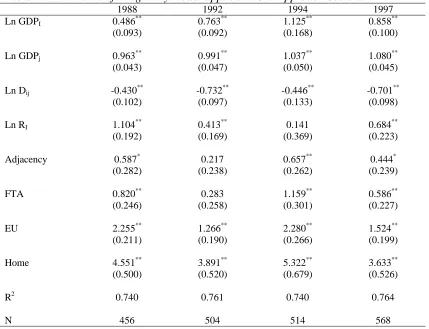
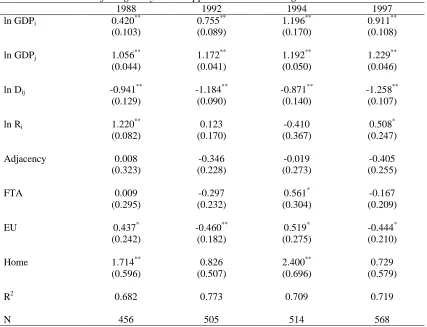
Finally in Table 3 we provide results for the three groups of products where technical
regulations are important, grouped according to the approach adopted in the EU to the
removal of technical barriers to trade. In all three cases distance and incomes are
income are broadly similar across the three groups of sectors whilst distance has a much
greater dampening effect on trade in mutual recognition products. Remoteness is
significant for Old Approach products but, in general, not for those under the New
Approach and mutual recognition.
The border effect is large and strongly significant for New and Old Approach products
but is smaller and not always significant for products under mutual recognition. Being a
member of the EU partly offsets the border effect for the New and Old Approach
products but not for mutual recognition products. However, the intensity of internal
trade relative to EU trade has increased for New Approach sectors, exactly those sectors
where we would anticipate that the impact of the Single Market would be most
pronounced and has fallen only mildly for Old Approach products when 1997 is
compared with 1988. However, it may be that the full impact on trade of directives
issued during the 1990s under the New Approach has yet to be felt. Membership of a
free trade agreement with the EU is important for New and Old Approach products but
is insignificant for mutual recognition products.
Thus, these results suggest that the border effect is important but that the extent of this
bias against trade with third countries relative to internal trade and its magnitude
towards EU partners varies according to the approach to the removal of technical
barriers in the EU. We find no evidence of an increase in the intensity of intra-EU
relative to internal trade for New Approach sectors. However, we would argue that
these results should be treated with a degree of caution. There are very few studies that
have addressed the issue at the heart of this paper so that suitable comparisons by which
to assess the robustness of the results presented here are not available. At present we
would conclude that the presence of the border effect appears to be relatively robust,
being consistently found in several studies, but the precise magnitude of this estimated
border effect is uncertain. We also anticipate that the estimates may suffer from the
presence of errors in measurement in internal distances, although the use of alternative
measures did not generate substantially different results.6
6
5. Interpreting the Border Effect and the Link to Economic Integration
As in this paper, a number of authors have found evidence of substantial border effects
so here we spend a little time reflecting on exactly what the border effect means and
what the dummy variable we have called the border effect might actually be measuring.
It is here that the fragility of the theoretical underpinnings of the gravity model proves
to be a hindrance. Firstly, however, we wonder if the architects of closer economic
relations in Europe might have been a little perplexed to be told that after over forty
years of closer integration European consumers may still be around 10 times more
likely to choose domestically produced products than substitutes available from
partners. This is perhaps even more surprising since the creation of the Single Market in
Europe is supposed to have led to substantial convergence of prices across European
markets.
The key issue regarding the estimated levels of the border effect is to what extent they
reflect genuine policy-induced constraints upon trade between countries or are primarily
the result of natural economic factors. First of all, the magnitude of the border effect
that we, and others, have identified seems to be too large to be consistent only with the
presence of trade barriers. The tariff equivalent of the estimated border effects depends
upon the elasticity of substitution between domestically produced goods and imports.
Taking a representative value of the border effect from this study of 3 and an elasticity
of substitution of 20 generates a tariff equivalent of over 16 per cent, way in excess of
the current levels of average tariffs in the EU of around 4 per cent. A lower value of the
elasticity of substitution, nearer to that estimated in empirical studies leads to much
higher tariff equivalents. For example, an elasticity of substitution of 10 generates a
tariff equivalent of 35 per cent, an elasticity of five leads to a tariff equivalent of over 80
per cent. An elasticity of substitution of 1.5, still towards the upper end of empirical
estimates, generates a tariff equivalent of over 600 per cent!
Further, in this project we have found larger and more persistent levels of the border
effect for sectors where technical regulations do not constitute major barriers to trade.
This is suggestive that factors other than regulatory policies are necessary in this case to
explain the presence of the border effect. However, the fact that being an EU member
policy-induced barriers are not significant. We tentatively postulate here that for many
of the sectors in this group external tariff barriers remain relatively high (textiles,
clothing and footwear), which helps to explain why the border effect is higher than for
other groups of sectors and that rules of origin are important. EU membership renders
rules of origin redundant but they still act to constrain trade with free trade partners
relative to home consumption. Satisfying rules of origin in these relatively low
value-added sectors maybe costly.7
In a study of trade between US states, Wolff (1997) finds evidence of border effects
within the US. Again, barriers to trade can not explain this phenomenon. For Wolff the
explanation lies in the clustering of production within political boundaries. In this
context our results would suggest that clustering within national boundaries in Europe is
more prevalent in sectors where there are no regulatory barriers, which seems unlikely.
Perhaps of greater relevance is the argument of Rauch (1996) that the nature of most
manufactured products, in terms of differentiation by characteristics and quality,
precludes the matching of buyers and sellers in organised exchanges. As a result, agents
indulge in a costly search process leading to the establishment of trading networks.
Search costs are limited by proximity and existing links within a network. The spread of
such networks across national boundaries will also be constrained by differences in
legal systems and the uncertainty that this can generate, including insurance for
transactions which is much easier for national commerce rather than for international
trade. In addition, differences in language, currencies and culture are amongst a range of
factors that may promote national networks rather than international trade. Some of
7
these factors, such as differences in the legal environment, could be addressed by policy
makers. But it is first necessary to identify how important they are in actually
constraining trade relative to other possible factors, such as differences in consumer
preferences, and whether intervention could be effective. In this regard we return to the
gravity model to see if any further light can be shed on this issue.
Deardorff (1995) and Anderson and van Wincoop (2000) show that after controlling for
economic size, bilateral trade will be determined by bilateral trade costs relative to
average or multilateral trade costs. These, and almost all other theoretical derivations of
the gravity model, are based upon CES representations of underlying preferences. This
imposes homotheticity on preferences and makes the derivation of gravity type
equations tractable and feasible since all countries will consume all products in the same
proportions. However, homotheticity is an extreme assumption which has received
regular empirical rejection.8
Deardorff (1995) shows how in a simple frictionless world that non-homotheticity will
lead to deviations in bilateral trade flows from that suggested by country size. In
essence bilateral trade will be more intense than economic size suggests where an
exporting country produces goods for which demand is more intense than on average in
the importing country. In low income countries necessities will form a higher proportion
of the consumption bundle than on average whilst in high-income countries it is luxury
goods that will be consumed in higher proportions than on average across the world.
Countries which specialise in producing luxury goods are likely to trade more
intensively with rich countries than economic size would suggest. These are likely to be
other rich countries.
Further, if along the lines first suggested by Linder (1961) new products are first
introduced by firms in response to domestic demand and, if as is likely, new products
are (at least initially) highly income elastic in high-income countries, then such
countries are likely to consume a higher proportion of domestically produced goods to
8
foreign produced goods than would be suggested by that country’s share of world
income alone. Thus, since countries specialise in producing those goods that are
consumed relatively intensely at home, internal trade will be greater than that suggested
by economic size alone. This implies that some of the deviation of trade flows from the
magnitude predicted by economic size which authors such as Wei (1996) and Anderson
and van Wincoop (2000) attribute to trade frictions may be, at least in part, due to
non-homotheticities in demand.
This suggests that demand and incomes matter for trade. So far we have assumed that
although non-homothetic tastes are everywhere identical. A further step is to assume
that there are differences in preferences across countries and within this that consumers
are biased towards home produced goods.9 Specifically home bias entails that (at least) some of the parameters in the utility function differ across countries so that at given
relative prices and incomes the ratio of consumption of home produced goods to foreign
produced goods is higher in the home country than in the foreign country (Warnock
(2000)). Such bias in preferences has been recognised by legislators in Europe as a
distinct possibility. The Court of Justice has ruled that mandatory labelling of goods
with their national origin is not consistent with Community law since this would have
an effect equivalent to a quantitative restriction. The Court felt that marks of national
origin would ‘prompt the consumer to give his preference to national products’, and
would thus contribute to ‘slowing down economic interpenetration in the
Community’.10
Clearly, if consumers were completely rational in a strict neo-classical economic sense,
and made their choices only on the basis of relative prices and their income, then such
rulings would not be necessary. So, if consumers are able to ascertain the national origin
of products then some of the estimated border effects in applications of the gravity
model will reflect the presence of home bias in preferences. In fact, whilst there are no
mandatory rules on product labelling in Europe, voluntary labelling of national origin is
extremely common. Indeed, there is a large literature in the context of marketing that
9
Trefler (1995) suggests that home bias in consumption, one of the factors that may underlie estimated border effects, is one of the reasons why the Heckscher-Ohlin-Vanek model tends to over-predict the amount of trade, as Trefler refers to it “the case of the missing trade”.
10
documents the presence and importance of home bias on the basis of consumer surveys.
For example, Knight (1999) reports the results of a survey of US consumers’
preferences regarding microwave ovens and dishes and concludes that US made
products were preferred over products made in Japan and interestingly this was
regardless of whether the company was American or Japanese owned. Thus, from this
source of information it would appear that the country of location of production not the
country of ownership of production matters in consumer preferences.11
What does this imply for economic integration? One way of assessing the success of
policy initiatives such as the Single Market in Europe is to compare the current level of
trade with a hypothetical level that would arise under conditions of perfect integration
with no border effects.12 Thus, for example, one could conclude that if trade between EU countries were to take place on exactly the same basis as trade within EU countries
then inter-country trade flows would expand massively by factors of around 5 to 10.
However, if differences in preferences, industry location factors and constraints upon
the spread of networks across borders are the main factors behind border effects then
this level of perfect integration is unlikely ever to be achieved. It may be that over time
there will be a tendency towards some harmonisation of preferences across EU
countries, and indeed this may underlie some of the reduction in the border effect that
we very tentatively identify in certain cases, but this is likely to be slow and entails little
or no role for policy-makers.
If the reason for the estimated level of the border effect were policy-related constraints
then clearly there is an important role for policy makers in removing such barriers and
the impact on welfare of further integration would be substantial. Thus, being able to
distinguish policy related from ‘natural’ factors in the estimated border effects is of
crucial importance in determining the policy implications. Our results here provide a
suggestion, a mere one at present, that policy related barriers are of relatively minor
importance. Firstly, we find substantial estimated border effects for sectors where
11
In future empirical work it would be useful to distinguish between trade in final and intermediate products and identify whether the magnitude of the border effect differs accordingly. One might anticipate that network effects will dominate the border effect for the latter whilst differences in preferences will be more important for final goods.
12
differences in technical regulations are not thought to be important barriers to trade.
Secondly, where technical barriers are deemed to be present we find that sectors with
the lowest levels of supranational intervention to remove such barriers, mutual
recognition sectors, exhibit the smallest and least significant border effects. Sectors
where there have been substantial efforts to remove regulatory barriers to trade still
reflect large border effects.
Conclusions
The consistent finding of substantial border effects in applications using the gravity
model is a bit of an anathema. Deardorff (1984) concluded that gravity models of
bilateral trade flows ‘tell us something important about what happens in international
trade, even if they do not tell us why’. The same is true for border effects. Recent
applications of the gravity model demonstrate that the border effect is an important
feature characterising the international exchange of products even between countries
with apparently high degrees of integration, but we do not clearly understand what
generates this effect. One possibility is policy-induced trade restrictions, such as
technical barriers to trade. However, these cannot be the only factor involved since in
this study we find substantial and persistent border effects for sectors where technical
regulations are not expected to constrain trade flows. Thus, the border effects that we
identify are likely to reflect factors such as differences in preferences and home bias in
consumption, factors promoting local networks of buyers and sellers and perhaps
differences in production structures and the spatial location of production within and
between countries.
Comprehending the border effect is important if we wish to understand economic
integration and its limits. Policy makers in Europe would like to know to what extent
the approaches that they have adopted are successfully removing technical barriers to
trade and integrating European markets. One way to do this would be to derive a
benchmark of what integration would be in the absence of trade barriers and compare
this with the actual level of integration. This would require us to identify the extent to
which estimated levels of the border effect capture differences in preferences and
production structures and the importance of local buyer-seller relationships. A similar
useful in the debate concerning the extent to which globalisation will undermine the
scope for independent national policy-making and the probability that the seamless
world with no significant national borders that some envisage is a realistic possibility. In
addition, we also need to assess to what extent integration itself may affect preferences,
buyer-seller relationships and the location of production.
It is here that the current state of economic research is very underdeveloped. Research
on buyer-seller relationships and the organisation of wholesale trade is scant. There is,
in general, very little effort towards the estimation of consumer demand equations.
Which is surprising given the fundamental role of the underlying preference parameters
in determining the welfare effects of policy changes. The evidence that is available
suggests that the assumption of identical tastes is untenable even for countries with
similar income levels (Pollak and Wales (1987) and Selvanathan and Selvanathan
(1993)) and that there maybe substantial differences between price and expenditure
elasticities for imported and domestically produced goods (Brenton and Winters
(1992b)). Preliminary work on Sweden suggests that home bias in preferences is
important (Anderton et al (1999)). In the particular case considered in this paper these
demand parameters are important in determining whether there is a policy issue or not.
Thus, a clear understanding of the nature of preferences across countries is necessary if
we are ever to be able to properly interpret the finding of substantial border effects in
References
Aitken, N (1973) ‘The Effect of the EEC and EFTA on European Trade: a Temporal Cross-section Analysis’, American Economic Review, 63, 881-91.
Anderson, J and Marcouiller, D (1999) ‘Trade Insecurity and Home Bias: An Empirical Investigation’, Working Paper 7000, NBER, Cambridge, MA.
Anderton, R., Brenton, P., Horsewood, N and Sinclair, P. (1999) ‘Preference Asymmetries, Hysteresis and Quality Effects in Swedish Imports’, Paper presented at the European Trade Study Group conference, Rotterdam, September.
Brenton, P and Winters, LA (1992a) 'Estimating the International Trade Effects of "1992": West Germany', Journal of Common Market Studies, 30, 143-156.
Brenton, P and Winters, LA (1992b) ‘Bilateral Trade Elasticities for Exploring the Effects of “1992”’ in Winters, L.A. (ed) Trade Flows and Trade Policy after 1992, CUP, Cambridge.
Brenton, P, Sheehy, J and Vancauteren, M (2001) ‘Technical Barriers to Trade in the EU: Data, Trends and Implications for Accession Countries’, Journal of Common Market Studies, 39, 241-60.
Deardorff, A (1995) ‘Determinants of Bilateral Trade: Does Gravity Work in a Neoclassical World’, Discussion Paper 382, Research Seminar in International Economics, University of Michigan.
CEC (1996) NACE Rev. 1, Statistical Classification of Economic Activities in the European Communities, Official Journal of The European Union, L293, 1996.
CEC (1998) ‘Technical Barriers to Trade’, Volume 1 of Subseries III Dismantling of Barriers of The Single Market Review, Office for Official Publication, Luxembourg.
Francois, JF (1998) ‘Scale Economies, Imperfect Competition and the Eastern Expansion of the EU’, in Brockmeier et al (eds), Economic Transition and the Greening of Policies, Wissenschaftsverlag Vauk Kiel KG: Kiel.
Frankel, J (2000) ‘Globalization of the Economy’, Working Paper 7858, NBER, Cambridge, MA.
Gasiorek, M, Smith, A and Venables, A (1991) ‘Completing the Internal Market in the EC: Factor Demands and Comparative Advantage’, in Winters, LA and Venables, AJ (eds)
European Integration: Trade and Industry, CUP, Cambridge.
Head, K and Mayer, T (2000) ‘Non-Europe: The Magnitude and Causes of Market Fragmentation in the EU’, Weltwirtschaftliches Archiv, 136, 284-314.
Knight, G (1999) ‘Consumer Preferences for Foreign and Domestic Products’, Journal of Consumer Marketing, 16, 151-162.
http://www.managementfirst.com/international_marketing/art_products.htm
Leamer, E (1997) ‘Access to Western Markets and Eastern Effort Levels’ in Zecchini, S (ed)
Lessons from the Economic Transition: Central and Eastern Europe in the 1990s, Kluwer, Dordrecht.
Nitsch, V (2000) ‘National Borders and International Trade: Evidence form the European Union’, Canadian Journal of Economics, 33, 1091-1105.
Pollak, R.A and Wales, T.J. (1987) ‘Pooling international consumption data’, Review of Economics and Statistics, 69, 90-99.
Rauch, J (1996) ‘Networks versus Markets in International Trade’, Working Paper 5617, NBER, Cambridge, MA.
Reinsdorf, M (1998) ‘Divisia Indexes and the Representative Consumer Problem’, in Lane, W (ed) Proceedings of the Fourth Meeting of the International Working Group on Price Indices, Bureau of Labor Statistics, Washington DC, 210-235.
Samuelson, P and Swamy, S (1974) ‘Invariant Economic Index Numbers and Canonical Duality: Survey and Synthesis’, American Economic Review, 64, 566-93
Sapir, A (1998) ‘The Political Economy of EC Regionalism’, European Economic Review, 42, 717-732
Selvanathan, S and Selvanathan, E.A. (1993) ‘A cross-country analysis of consumption patterns’, Applied Economics, 25, 1245-59
Soloaga, I and Winters, L.A. (2000) ‘Regionalism in the Nineties: What Effect on Trade?, World Bank, Washington.
Wei, S.J. (1996) ‘Intra-National Versus International Trade: How Stubborn are Nations in Global Integration?’, Working Paper 5531, NBER, Cambridge, MA
Table 1. Estimates of the gravity model applied to total trade
1988 1992 1994 1997
Ln GDPi 0.533**
(0.063) 0.736** (0.051) 0.967** (0.118) 0.729** (0.052)
Ln GDPj 0.769**
(0.029) 0.870** (0.024) 0.920** (0.036) 0.892** (0.023)
Ln Dij -0.318**
(0.071) -0.556** (0.050) -0.199* (0.098) -0.527** (0.056)
Ln Ri 0.801**
(0.057) 0.228* (0.101) 0.154 (0.259) 0.659** (0.126)
Adjacency 0.621**
(0.200) 0.494** (0.163) 0.826** (0.218) 0.632** (0.157) FTA 0.032 (0.194) -0.371* (0.166) 0.676** (0.222) 0.054 (0.122)
EU 1.097**
(0.153) 0.370** (0.108) 1.315** (0.203) 0.545** (0.123)
Home 3.320**
(0.364) 2.973** (0.313) 4.563** (0.505) 3.078** (0.334)
R2 0.782 0.873 0.783 0.865
N 456 505 514 569
Table 2
Sectors subject to technical regulations Sectors where there are no technical barriers to trade
1988 1992 1994 1997 1988 1992 1994 1997
Ln GDPI 0.495**
(0.078) 0.733** (0.070) 1.073** (0.142) 0.814** (0.072) 0.963** (0.109) 0.780** (0.027) 0.833** (0.039) 0.644** (0.061)
Ln GDPj 0.982**
(0.035) 1.056** (0.035) 1.100** (0.043) 1.103** (0.031) 0.631** (0.042) 0.723** (0.059) 0.816** (0.128) 0.774** (0.028)
Ln Dij -0.483**
(0.094) -0.853** (0.069) -0.352** (0.114) -0.806** (0.071) -0.156 (0.132) -0.379** (0.054) -0.073 (0.104) -0.398** (0.067)
Ln Rij 0.991**
(0.069) 0.206 (0.129) -0.012 (0.310) 0.468** (0.166) 0.530** (0.088) 0.326** (0.111) 0.454** (0.279) 0.988** (0.145)
Adjacency 0.430*
(0.252) 0.070 (0.189) 0.591** (0.239) 0.198 (0.188) 0.709* (0.327) 0.907** (0.181) 1.071** (0.224) 0.934** (0.169) FTA 0.247 (0.205) -0.132 (0.190) 1.023** (0.251) 0.327** (0.138) 0.187 (0.346) -0.512** (0.195) 0.607** (0.242) -0.103 (0.153)
EU 1.365**
(0.183) 0.235* (0.133) 1.445** (0.230) 0.459** (0.140) 0.841** (0.279) 0.225* (0.122) 1.060** (0.215) 0.412** (0.150)
Home 2.898**
(0.455) 1.898** (0.418) 3.971** (0.605) 2.024** (0.415) 3.964** (0.630) 3.845** (0.304) 5.295** (0.510) 3.764** (0.352)
R2 0.776 0.834 0.772 0.833 0.537 0.817 0.730 0.809
N 456 505 514 569 456 505 514 569
1988 1992 1994 1997
Ln GDPI 0.415**
(0.101) 0.867** (0.088) 1.290** (0.159) 0.984** (0.103)
Ln GDPj 1.103**
(0.048) 1.230** (0.039) 1.275** (0.044) 1.315** (0.042)
Ln Dij -0.583**
(0.140) -0.824** (0.091) -0.507** (0.132) -0.712** (0.112)
Ln RI 1.139**
(0.088) 0.027 (0.156) -0.576* (0.342) 0.213 (0.231) Adjacency 0.443 (0.339) 0.280 (0.276) 0.759** (0.282) 0.502* (0.269) FTA 0.183 (0.326) 0.785** (0.228) 1.633** (0.278) 1.405** (0.230)
EU 1.910**
(0.272) 1.030** (0.185) 1.812** (0.266) 1.172** (0.229)
Home 3.783**
(0.659) 3.325** (0.540) 4.813** (0.684) 3.760** (0.609)
R2 0.714 0.812 0.773 0.775
[image:28.595.86.513.83.409.2]N 456 504 514 569
Table 3.2. Estimates of the gravity model applied to Old Approach Sectors
1988 1992 1994 1997
Ln GDPI 0.486**
(0.093) 0.763** (0.092) 1.125** (0.168) 0.858** (0.100)
Ln GDPj 0.963**
(0.043) 0.991** (0.047) 1.037** (0.050) 1.080** (0.045)
Ln Dij -0.430**
(0.102) -0.732** (0.097) -0.446** (0.133) -0.701** (0.098)
Ln RI 1.104**
(0.192) 0.413** (0.169) 0.141 (0.369) 0.684** (0.223)
Adjacency 0.587*
(0.282) 0.217 (0.238) 0.657** (0.262) 0.444* (0.239)
FTA 0.820**
(0.246) 0.283 (0.258) 1.159** (0.301) 0.586** (0.227)
EU 2.255**
(0.211) 1.266** (0.190) 2.280** (0.266) 1.524** (0.199)
Home 4.551**
(0.500) 3.891** (0.520) 5.322** (0.679) 3.633** (0.526)
R2 0.740 0.761 0.740 0.764
[image:28.595.85.514.434.763.2]Table 3.3. Estimates of the gravity model applied to Mutual Recognition Sectors
1988 1992 1994 1997
ln GDPi 0.420**
(0.103) 0.755** (0.089) 1.196** (0.170) 0.911** (0.108)
ln GDPj 1.056**
(0.044) 1.172** (0.041) 1.192** (0.050) 1.229** (0.046)
ln Dij -0.941**
(0.129) -1.184** (0.090) -0.871** (0.140) -1.258** (0.107)
ln Ri 1.220**
(0.082) 0.123 (0.170) -0.410 (0.367) 0.508* (0.247) Adjacency 0.008 (0.323) -0.346 (0.228) -0.019 (0.273) -0.405 (0.255) FTA 0.009 (0.295) -0.297 (0.232) 0.561* (0.304) -0.167 (0.209)
EU 0.437*
(0.242) -0.460** (0.182) 0.519* (0.275) -0.444* (0.210)
Home 1.714**
(0.596) 0.826 (0.507) 2.400** (0.696) 0.729 (0.579)
R2 0.682 0.773 0.709 0.719
0 0.1 0.2 0.3 0.4 0.5 0.6 0.7 0.8 0.9 1
LATVIA
GREECE
BULGARIA LITHUANIA ESTONIA AUSTRIA ROMANIA Ext-EU12
SPAIN
DENMARK PORTUGAL
ITALY
FRANCE POLAND BEL-LUX Int-EU12 NETHS
UK
CZECH REP.
FINLAND SWEDEN
[image:30.842.112.756.90.462.2]