This is a repository copy of The effect of locomotion on early visual contrast processing in humans.
White Rose Research Online URL for this paper: http://eprints.whiterose.ac.uk/126452/
Version: Accepted Version
Article:
Benjamin, Alex Victoria, Wailes-Newson, Kirstie Holly, Ma-Wyatt, Anna et al. (2 more authors) (2018) The effect of locomotion on early visual contrast processing in humans. Journal of neuroscience. pp. 3050-3059. ISSN 1529-2401
https://doi.org/10.1523/JNEUROSCI.1428-17.2017
Reuse
1
Title: The effect of locomotion on
2
early visual contrast processing in
3
humans
4
A b b r e v i a t e d t i t l e : No effect of locomotion on human surround suppression 5
A u t h o r s :
6
Benjamin, A.V.* 1 7
Wailes-Newson, K * 1 8
Ma-Wyatt, A2 9
Baker, D.H. 1 10
Wade, A.R. 1 11
Affiliations: 12
1: University of York, UK 13
2: University of Adelaide, Australia 14
*
Both authors contributed equally to this work 15
Number of pages: 25 16
Number of figures: 7 17
Abstract: 248 words 18
Introduction: 513 words 19
Discussion: 1094 words 20
No conflict of interest 21
Acknowledgements: The work was funded by the European Research Council 22
and the BBSRC 23
24
1
ABSTRACT
2
Most of our knowledge about vision comes from experiments in which stimuli are 3
presented to immobile human subjects or animals. In the case of human subjects, 4
movement during psychophysical, electrophysiological or neuroimaging experiments 5
is considered to be a source of noise to be eliminated. Animals used in visual 6
neuroscience experiments are typically restrained and, in many cases, anaesthetized. 7
In reality however, vision is often used to guide the motion of awake, ambulating 8
organisms. Recent work in mice has shown that locomotion elevates visual neuronal 9
response amplitudes (Erisken et al., 2014; Fu et al., 2014; Lee et al., 2014; Mineault et 10
al., 2016; Niell and Stryker, 2010) and reduces long-range gain control (Ayaz et al., 11
2013). Here we use both psychophysics and steady-state electrophysiology to ask 12
whether similar effects of locomotion on early visual processing can be measured in 13
humans. 14
15
Our psychophysical results show that brisk walking has little effect on subjectsÕ 16
ability to detect briefly-presented contrast changes and that co-oriented flankers are, if 17
anything, more effective masks when subjects are walking. Our electrophysiological 18
data were consistent with the psychophysics, indicating no increase in stimulus-driven 19
neuronal responses whilst walking and no reduction in surround suppression. 20
In summary we find evidence that early contrast processing is altered by locomotion 21
in humans but in a manner that differs from that reported in mice. The effects of 22
locomotion on very low-level visual processing may differ on a species-by-species 23
basis and may reflect important differences in the levels of arousal associated with 24
locomotion. 25
Significance Statement
1
Mice are the current model of choice for studying low-level visual processing. Recent 2
studies have shown that mouse visual cortex is modulated by behavioural state: V1 3
neurons in locomoting mice tend to be more sensitive and less influenced by long-4
range gain control. Here we test these effects in humans by measuring psychophysical 5
detection thresholds and EEG responses while subjects walk on a treadmill. We find 6
no evidence of increased contrast sensitivity or reduced surround suppression in 7
walking humans. Our data show that fundamental measurements of early visual 8
processing differ between humans and mice and have important implications for 9
recent work on the link between arousal, behaviour and vision in these two species. 10
Introduction
1
Recent work in head-fixed mouse models has demonstrated that locomotion is linked 2
with changes in early visual processing. Many labs report that locomoting mice 3
exhibit increased responsivity in primary visual cortex (Fu et al., 2014; Niell and 4
Stryker, 2010; Polack et al., 2013) while there is also evidence for a locomotion-5
associated reduction in surround suppression (Ayaz et al., 2013) and locomotion-6
dependent visual plasticity (Kaneko et al., 2017; Kaneko and Stryker, 2014). These 7
measurements are broadly consistent with the more general observations that sensory 8
neuronal responses are dependent not just on stimulus strength but also on 9
behavioural state, arousal and attention (Haider et al., 2013; Harris and Thiele, 2011; 10
Lauritzen et al., 2010; McGinley et al., 2015; Motter, 1993; Posner and Petersen, 11
1990; Reimer et al., 2014). However, the underlying mechanisms linking locomotion 12
to visual sensitivity in mice are unclear, as are the implications for human vision. 13
Some labs do report modulations of early human visual processing during periods of 14
acute exercise changes but these are at the level of featural tuning (Bullock et al., 15
2016) while the effects on low-level contrast sensitivity are more ambiguous (Bullock 16
et al., 2015). Moreover, these effects are observed not during locomotion per se but 17
during intense bouts of exercise on a stationary bicycle. To our knowledge, the most 18
striking effect of true locomotion on human vision to date has been the observation of 19
a locomotion-related motion aftereffect whose cause has never been fully explained 20
(Pelah and Barlow, 1996) but which must act at a level above simple contrast 21
processing in V1. 22
23
If locomotion alters early contrast representations in humans it would have profound 24
implications for our understanding of natural scene processing. Orientation-selective 25
surround suppression (Cavanaugh et al., 2002; DeAngelis et al., 1994; Nelson and 26
Frost, 1978) has been hypothesized to play a critical role in scene segmentation by 27
increasing neuronal responses at the boundaries of different texture patches (Knierim 28
and van Essen, 1992; Lamme, 1995; Nothdurft et al., 2000; Rossi et al., 2001). The 29
discovery of a significant reduction in surround suppression during locomotion would 30
therefore raise the possibility that scene segmentation is altered (and potentially 31
impaired) while subjects are navigating their environment. Similarly, a locomotion 32
driven change in neuronal gain would reshape or reposition the contrast sensitivity 33
function with implications for the discrimination of both low- and high-contrast edges 34
as well as the computation of speed which is known to be contrast-dependent (Stocker 35
and Simoncelli, 2006; Thompson, 1982). 36
37
Here we measure two aspects of early contrast processing (neuronal sensitivity and 38
surround suppression) in locomoting humans. These measurements are made using 39
Methods
1
2
We performed behavioral and electrophysiological (SSVEP) experiments to measure 3
neuronal response amplitude and long-range, spatially-tuned gain control in human 4
subjects. 13 subjects (4 female, mean age 26) took part in the behavioural experiment, 5
13 subjects (10 female, mean age 24) took part in the SSVEP experiments and 12 6
subjects (8 female, mean age 24) took part in the pupilometry experiment. Nine 7
subjects took part in all experiments. All experimental protocols were approved by the 8
ethics committee of the University of York Psychology Department. 9
10
All measurements were collected under two conditions: A ÔlocomotionÕ or ÔwalkingÕ 11
condition (while subjects walked on a motorized treadmill) and a ÔstaticÕ condition 12
while they straddled the moving treadmill belt (width=60cm). Psychophysical 13
subjects also participated in a third Ôtarget movesÕ condition to test the potential 14
effects of retinal motion. 15
16
The same treadmill (Confidence Fitness, ÔGTR Power ProÕ) was used in all 17
experiments and ran constantly at a preset speed of 5Km/h which is equivalent to a 18
brisk walk. 19
–
20
Stimuli were presented on a Multisync CRT monitor (Mitsubishi Corp, Tokyo) 21
running at 100Hz under the control of an OSX 10.9 computer (Apple Inc, Cupertino) 22
running Psykinematix V1.4 (Kybervision, Japan). The monitor was positioned at a 23
distance of 110cm from the subjects and centered vertically at face level. Spectral and 24
gamma calibration was performed using a Spyder4 colorimeter, cross checked with a 25
fiber-optic photospectrometer (Jaz, Oceanoptics, Dumoulin, Fl). All stimuli were 26
presented on a mean-gray background with luminance of 94 cd/m2. Responses were 27
registered using an OSX-compatible USB gamepad (Logitech, Lausanne) fixed to the 28
handle of the treadmill. 29
30
Subjects performed a set of contrast discrimination/detection judgements using 31
stimuli similar to those described in Wade (Wade, 2009) and Petrov, Carandini and 32
McKee (Petrov et al., 2005). A pair of ÔprobeÕ Gabor patches (�= 1.5¡, spatial 33
frequency = 2cpd) were presented simultaneously for 200ms, 5¡ to the left and right 34
of a fixation marker. One of the probes had a ÔpedestalÕ contrast C, the other had a 35
contrast C+∆C and the subjectÕs task was to indicate which probe (left or right) had 36
the higher contrast. For each pedestal level (0, 1, 2, 5 and 10%), the magnitude of ∆C 37
was determined using a Bayesian adaptive staircase procedure (Kontsevich and Tyler, 38
1999) to obtain a threshold at 78% correct. Staircases for all pedestal levels were 39
interleaved and six repetitions of each threshold were obtained for each subject. 40
Motion conditions (walking / stationary / target moves) were interleaved at random 41
and each condition lasted around nine minutes. 42
43
To eliminate uncertainty about the spatial location of the probes (Petrov et al., 2006) a 44
thin gray circle was present around the probe locations throughout the experiment. 45
onset was cued by a subtle change in the shape of the fixation point 200ms before 1
stimulus onset. Subjects received audio feedback (high or low tones to indicate 2
correct or incorrect responses) throughout the experiments. 3
To measure the effects of surround suppression, we measured thresholds for isolated 4
probes and also for probes placed in the center of annular ÔsurroundsÕ containing high 5
contrast (90%) gratings. A gap of one grating wavelength (1l) was present between 6
the probe and the surround to minimize the contribution of isotropic precortical 7
Ôoverlay maskingÕ (Petrov et al., 2005) and the outer radius of the annulus was 6¡. 8
Because cortical surround suppression is tuned for orientation, we measured the 9
effects of surround gratings in two configurations: collinear and orthogonal with the 10
probe Gabor. 11
12
In addition to the 13
ÔlocomotingÕ and ÔstaticÕ 14
conditions, a third 15
Ôstatic/target movingÕ or 16
Ôs/tmÕ condition was 17
generated in an attempt to 18
simulate the effects of 19
locomotion on retinal image 20
position. In this Ôs/tmÕ 21
condition, both sets of 22
probe+surround drifted 23
rapidly (30¡/s) in the same, 24
randomly-chosen direction 25
for the duration of the 200ms 26
presentation. We included 27
this condition as a 28
conservative test of the effect 29
of retinal image motion and 30
blurring. In total, we 31
measured 32
discrimination/detection 33
thresholds for 15 different 34
combinations of surround 35
type (3) and contrast (5) for 36
each of three locomotion 37
conditions. 38
–
[image:7.595.79.512.243.592.2]39
The stimuli used in the steady-state visually evoked potential (SSVEP) experiment 1
were conceptually similar to those used in Experiment 1 but modified to optimize the 2
evoked neuronal signal. Stimuli were generated in using the Psychophysics toolbox 3
[image:8.595.104.473.77.552.2]running on an OSX 10.10 computer (Apple Inc, Cupertino) and displayed on a 4
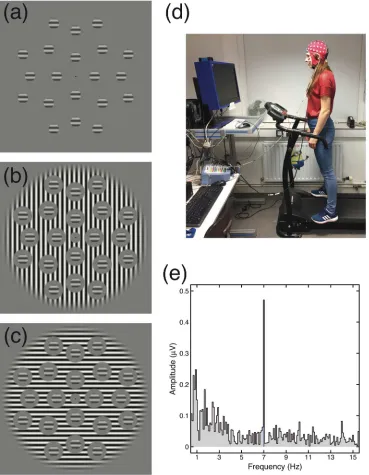
Figure 2Example stimuli, photograph of experimental set-up, and example Fourier spectrum. (a) shows the matrix of target stimuli, which were rotated about the central fixation by a random amount on each trial. (b) shows the target stimuli with an orthogonal surround mask. (c) shows the target stimuli with a collinear surround mask. The phase alignment between target and mask is arbitrary, as the drifting mask meant that the relative phases of the two stimuli changed over time. (d) is a photograph of the
calibrated ViewPixx monitor (VPixx Technologies, Montreal) running at a framerate 1
of 120Hz with a mean background luminance of 84 cd/m2. 2
3
The ÔprobeÕ Gabors had a spatial frequency of 2cpd and a diameter of 1.2¡, windowed 4
by a raised cosine envelope. These frequency tagged probes were presented at a range 5
of fixed contrast levels with three types of surround (no surround, collinear surround 6
and orthogonal surrounds). The probes appeared and disappeared (Ôon/offÕ) at a fixed 7
frequency (7Hz sinusoidal flicker) and therefore generated a phase-locked response at 8
7Hz in the EEG record over visual cortex with additional second harmonic transients 9
at 14Hz. When present, the high-contrast sine wave grating surround (96% contrast, 10
2cpd) drifted at a speed of 3 degrees per second. Drifting gratings are effective 11
surround masks (Xiao and Wade, 2010) but do not generate a coherent frequency-12
locked response in SSVEP (Norcia et al., 2015). 13
14
To maximize the EEG response, multiple probe patches (N=20) were present on 15
screen at any moment, arranged in a hexagonal grid with a diameter of 20¡ (Figure 16
2a). Absolute stimulus orientation was randomised on each trial to avoid local 17
adaptation aftereffects, but the relative orientation of target and surround was 18
controlled according to condition (collinear or orthogonal). The offset between the 19
edge of the target gratings and the inner edge of the mask was one full grating cycle 20
(0.5¡). 21
22
EEG data were recorded at 1kHz using an ANT Neuroscan EEG system with a 64-23
channel Waveguard cap. Stimulus onset was recorded on the EEG trace using low-24
latency digital triggers sent over a parallel cable from the ViewPixx device. The first 25
1s of each 11s trial was discarded to remove onset transients, and a fast Fourier 26
transform was taken of the EEG trace from the remaining 10s, giving a frequency 27
resolution of 0.1Hz. We performed coherent averaging across trials within a condition 28
for each participant, and then averaged the absolute amplitude values across 29
participants. To calculate signal-to-noise ratios (SNRs) we averaged the amplitudes in 30
the 10 frequency bins adjacent to the signal frequency (from 6.5-6.9Hz and from 7.1-31
7.5Hz in 0.1Hz steps) and divided the amplitude in the signal bin by this average. 32
33
As in the psychophysical experiments, responses were recorded under two 34
randomized, interleaved conditions: ÔstaticÕ and ÔlocomotingÕ (brisk walking at 5 35
km/h) in blocks of approximately 9 minutes. 36
–
1
Systemic arousal in both humans and mice can be correlated with both 2
neurophysiological and behavioural changes (Bradley et al., 2008; McGinley et al., 3
2015; Murphy et al., 2011). To measure the effects of treadmill walking on arousal we 4
used a head-mounted, infra-red illuminated, video-based eyetracker (Pupil Labs AG, 5
Berlin) to measure pupil sizes in subjects (N=12) performing the psychophysical task 6
in both stationary and walking conditions in a randomized order using room 7
illumination conditions identical to those in Experiment 1. The eye tracker software 8
ÔPupil CaptureÕ collected 10 minutes of samples at 120Hz and pupil size and 9
confidence measures for both left and right eye were recorded. Data from the first half 10
of each measurement block were discarded to remove artefacts due to residual light 11
adaptation and mechanical ÔsettlingÕ of the eyetracker on the head. A separate 12
measurement was conducted to measure maximum pupil size in perceptual darkness 13
(with infra-red pupil illuminations) to ensure that the pupil was not fully-dilated in the 14
psychophysics task under dim illumination. 15
16
Measurements were analyzed off-line using Matlab (Mathworks, Natick, MA) and R 17
(R Development Core Team, 2008) and only pupil diameters with a confidence rating 18
greater than .95 (Max=1) were retained. Because the absolute mean pupil size 19
depends on many factors including the angle of the eye-tracking camera and the 20
proximity to the head, we present all data in units of screen pixels and assess the 21
difference between walking and stationary conditions. We performed within-subjects 22
t-tests on raw pupil diameter measures from left and right eyes independently and a 23
paired t-test on the entire group. 24
c
25
We fit our psychophysical and neurophysiological data assuming an underlying 26
neuronal response function that has the form of a hyperbolic ratio function (see Eq 3) 27
(Albrecht and Geisler, 1991). 28
� = �∃ &∋
(&∋)∗) [E1]
29
30
In the case of our psychophysical data, we assumed that the thresholds were 31
proportional to the first derivative of this hyperbolic ratio function which we 32
computed analytically. This model is common in the psychophysical literature and 33
rests on the assumption that detection or discrimination is limited by a single, late 34
noise source (Boynton et al., 1999; Itti et al., 2000; Nachmias and Sansbury, 1974). 35
In the case of the neuronal data we fit the parameters of the hyperbolic ratio function 36
directly. 37
38
To obtain error bounds for our fits and avoid the use of parametric statistics, we used 39
permutation methods to bootstrap the model parameters by resampling data points 40
from our 13 subjects with replacement and re-computing model fits a total of 10,000 41
times (Efron and Tibshirani, 1993) using the Matlab function bootci. The error bounds 42
shown in Figure 3 and 6 are derived from these bootstraps and indicate the 95% 43
confidence intervals. Similarly, in Figures 4 and 7, the boxplots show the range of the 44
bootstrapped parameters with the notches indicating the 95% confidence intervals. 45
1
Niell and Stryker (Niell and Stryker, 2010) reported that motion increased population 2
activity by approximately 300% - both for spontaneous gamma power and for 3
measures of individual stimulus-driven neuronal responses (spikes/second). If such 4
large effects were present in our EEG data (where we also measure neuronal 5
responses to high contrast gratings) then we would expect to measure significant 6
(p<.001) walking-driven SNR differences for the high contrast, unmasked probes with 7
a sample size of no more than three subjects Ð even assuming a two-fold increase in 8
overall noise (Lenth, 2001; Rosner, 2011). Ayaz et al report a more modest reduction 9
in the amount of surround suppression that they measure in locomoting animals (Ayaz 10
et al., 2013). Their population average suppression index (defined as the normalized 11
difference in response between an optimal stimulus and one suppressed by the 12
surround) decreased by a factor of around 40% (from 38% to 23%) when their mice 13
were locomoting. 14
15
We acknowledge that the relationship between population average responses of 16
neuronal activity as measured by single units and scalp-level EEG is not direct Ð but 17
nevertheless we observe that our EEG measurements of Rmax are reduced by
18
approximately 25% between static/unmasked and static/suppressed suggesting that 19
our baseline suppression index would be comparable to that seen in the Ayaz paper.
20
Again, using realistic estimates of noise we calculated that we would require no more 21
than four subjects to detect this level of change at the p<.001 level and we estimate 22
that our actual sample sizes (13 subjects) had enough power to identify effects less 23
than half the size of the magnitudes reported in the single unit literature. 24
1
Results
2
-
3
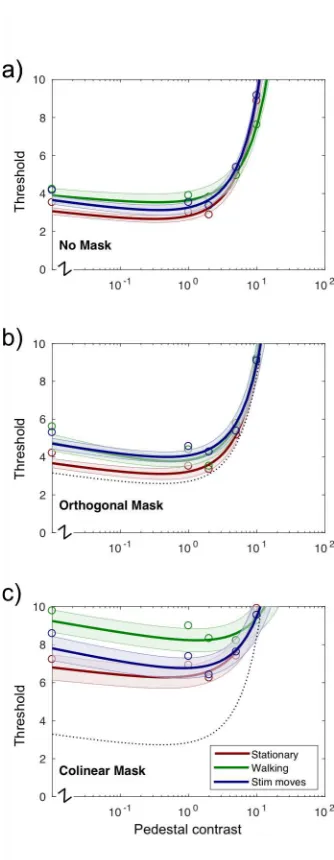
Figure 3 shows threshold data for all 4
combinations of locomotion condition and 5
surround type. Thresholds for the unmasked 6
condition are shown in 3a. These exhibit a 7
classic ÔdipperÕ shape (Foley and Legge, 8
1981; Nachmias and Sansbury, 1974) with 9
the lowest threshold occurring at a pedestal 10
level of approximately half the detection 11
threshold. Thresholds in the stationary 12
condition (red line) are slightly lower than 13
the other two conditions - for example, probe 14
detection thresholds (zero pedestal) in the 15
ÔNo maskÕ condition increase from 3.8% to 16
4.2% (p<.001) when subjects are walking. 17
However, in general, unmasked thresholds 18
for ÔstationaryÕ, ÔwalkingÕ and Ôstimulus 19
movesÕ conditions are strikingly similar 20
suggesting that subjects are able to perform 21
the task well under all conditions, that 22
walking per se does not impose a significant 23
attentional or fixational penalty and that in 24
this experiment, subjects can compensate for 25
relatively large amounts of retinal motion 26
(Westheimer and McKee, 1975). Walking 27
also does not appear to increase sensitivity to 28
unmasked targets which might be expected 29
to lead to reduced thresholds or a leftward 30
shift in the curve. 31
32
Panel 3b shows thresholds measured for the 33
Ôorthogonal maskÕ condition. The unmasked, 34
stationary thresholds are replotted as a dotted 35
line for reference. Thresholds are slightly 36
elevated in this condition but the effects are 37
small and consistent with those seen in other 38
studies of surround suppression (e.g. (Petrov 39
et al., 2005). 40
41
Panel 3c shows thresholds measured in the 42
Ôcolinear maskÕ condition where targets are 43
suppressed by a co-oriented annular 44
surround. These thresholds are significantly 45
higher than those measured in either the Ôno 46
[image:12.595.91.258.157.587.2]maskÕ or Ôorthogonal maskÕ conditions - consistent with the idea that we are 1
measuring a suppressive, long-range, orientation-tuned (and therefore cortical) 2
phenomenon. 3
4
Notably, Detection / discrimination thresholds measured during the conlinear 5
locomotion condition (3b, green line) are higher, not lower than those measured when 6
subjects are either stationary or viewing moving targets (red, blue lines). In brief, 7
walking appears to increase, not decrease psychophysical surround suppression. 8
While unmasked thresholds are also slightly higher in the ÔlocomotingÕ condition, 9
surround suppression is also increased significantly by walking when the effect is 10
computed as a multiple of the unmasked threshold contrast. 11
[image:13.595.90.447.257.565.2]12 13
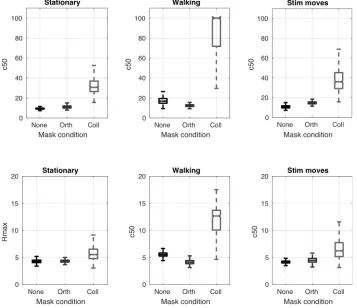
Figure 4 Bootstrapped parameters for hyperbolic ratio functions fitted to psychophysical data. Locomotion causes a significant increase in both the semisaturation constant (C50) and a small but
still significant increase in the predicted maximum response rate (Rmax). Notches indicate 95%
in a manner that increases the maximum response level of the neuronal population at 1
the highest contrast levels. 2
-
1
[image:15.595.70.332.73.355.2]2
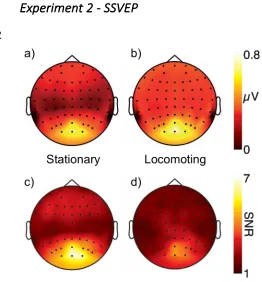
[image:15.595.94.492.515.629.2]Figure 5 shows the average response to unmasked probes combined across all 1
subjects. As expected, the dominant response is centered on Oz consistent with a 2
source in early visual cortex. Panels a) and b) show the raw response amplitudes in 3
the stationary and locomotion conditions respectively. Amplitudes are higher overall 4
in the locomotion condition but this could reflect either a higher neuronal response 5
restricted to the stimulus frequency or a generally increased response in the EEG 6
signal due to broadband noise. Panels c) and d) show SNR rather than raw amplitude 7
and confirm that SNR drops in the locomoting condition compared to the stationary 8
condition. There is therefore no evidence that active walking increases neuronal 9
responses to the frequency-tagged probe. 10
11
Figure 6 shows hyperbolic contrast response functions of the form described in E1 12
fitted to the population SNR data from all 13 subjects with bootstrapped 95% error 13
bounds. Consistent with the data from Figure 5, overall SNR is lower in the 14
locomoting condition (quantified in the fits below). Both conditions show evidence of 15
orientation tuned surround suppression: the lines in (6c) tend to lie to the right and 16
below of the corresponding lines in (6a). There is no overt reduction in the size of the 17
surround suppression during the locomoting condition Ð if anything the suppression 18
index (computed as the ratio of SNRs in the unmasked and collinear mask conditions) 19
is higher for walking than for stationary observers on average (6d). 20
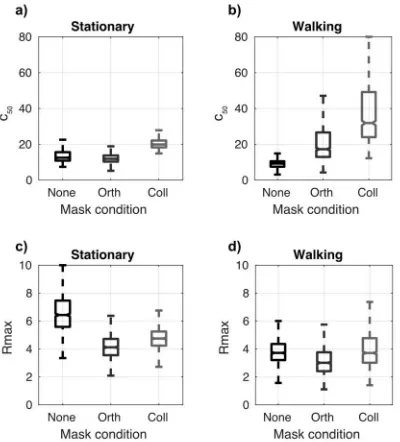
This is confirmed by examining the distribution of the bootstrapped fit parameters 1
(Figure 7): The semisaturation constant Ôc50Õ for unmasked probes is very similar to
2
that computed for psychophysical data Ð around 10% suggesting that our EEG 3
measurements provide a reliable estimate of behavioral sensitivity. It is not possible to 4
compare Rmax values in the psychophysical and SSVEP experiments directly due to
5
the change in measurement units. Evidence of orientation-tuned surround suppression 6
is provided by the fact that c50 for collinear surrounds is reliably higher than for the
[image:17.595.111.311.191.412.2]7
Figure 7. Parameter fits for SSVEP contrast response functions. In the stationary condition, orientation-tuned surround suppression increases c50 (reducing sensitivity). In the walking
condition this effect is increased. Overall, Rmax is reduced
unmasked stimulus or orthogonally-masked stimulus for both stationary and 1
locomoting conditions. Consistent with the psychophysical data, collinear-masked c50
2
is higher in the locomoting condition than it is in the static condition (p<.001), not 3
lower as we would expect if surround suppression was reduced. Rmax also shows a
4
statistically significant reduction overall (p<.001) in the locomoting condition 5
indicating that the SNR has not improved overall (see Discussion). 6
–
7
8
Pupil sizes measured in both eyes were significantly larger (35% increase in area on 9
average, p<.001) in the walking compared to the stationary conditions (See Figure 8). 10
This size increase was not an artefact of increased noise generated by head movement 11
during locomotion: we explicitly chose only measurements from frames with a high 12
confidence rating (>95%) indicating an error-free fit while visual inspection of 13
individual frames showed no evidence of motion blur or distortion. Similarly, task 14
difficulty (as assessed by raw unmasked detection thresholds) was not significantly 15
greater in the walking compared to the stationary condition (See Figure 4). 16
Discussion
17
We examined the effects of locomotion on long-range, orientation-tuned gain control 18
using both behavioural and electrophysiological methods. The data from the 19
locomotion condition clearly differed from those collected under static conditions but 20
we saw no evidence for an increase in either spontaneous firing rate or sensitivity 21
when walking. Instead, we measured very little effect of walking on 22
detection/discrimination thresholds when targets are unmasked or surrounded by an 23
orthogonal grating and significantly increased thresholds in the presence of a collinear 24
surround. Our EEG data were equally clear: walking reduced the SNR of our 25
responses slightly overall (possibly due to the introduction of broadband noise) and 26
sensitivity (as measured by c50) decreased significantly for collinear-masked targets,
27
and to some extent for targets with orthogonal masks while the responses to 28
[image:18.595.94.337.205.338.2]unmasked targets were essentially unchanged. Walking seemed to have little effect on 29
unmasked sensitivity and increased, rather than decreased surround suppression in 1
both experiments. 2
3
Robust changes in cortical visual sensitivity linked to locomotion have been measured 4
in mice (Ayaz et al., 2013; Fu et al., 2014; Lee et al., 2014; Niell and Stryker, 2010; 5
Polack et al., 2013; Reimer et al., 2014; Saleem et al., 2013): While locomotion does 6
not affect responses in the LGN or input layers (Niell and Stryker, 2010), neurons in 7
layer 2/3 of mouse visual cortex are relatively depolarized during locomotion (Polack 8
et al., 2013) leading to higher spontaneous firing rates and increased visual sensitivity. 9
One potential mechanism is that locomotion acts in a top-down manner through a 10
two-layer network regulating visual gain control: stimulating neurons that 11
subsequently inhibit a second class of inhibitory interneurons (Fu et al., 2014; Pfeffer 12
et al., 2013). The same mechanism may contribute to the finding that the suppressive 13
effects of extraclassical receptive fields are also reduced in locomoting animals (Ayaz 14
et al., 2013). 15
16
Recent work has also shown that locomotion and arousal are usually tightly coupled 17
in mice: high levels of arousal in mice often induce running behavior and running 18
mice tend to be highly aroused. When the physiological effects of arousal are isolated, 19
it can be shown that arousal that leads to an increase in neuronal sensitivity 20
(McGinley et al., 2015; Reimer et al., 2014) even in the absence of locomotion. In 21
support of this, recent work by Vinck et al has shown specifically that sensitivity 22
increases in mouse visual cortex due to arousal can be dissociated from an increase in 23
baseline firing rate due to locomotion (Vinck et al., 2015). 24
25
Our failure to find robust increases in neuronal sensitivity in locomoting humans 26
might be explained by the behavioural and cognitive differences between people and 27
mice. Humans are not necessarily aroused by brisk walking and in our experiments 28
walking speed was fixed by the treadmill rather than being determined by the arousal 29
state of the subjects. We note that the effects of exercise on neuronal feature 30
selectivity and intracortical excitability that have been reported to date (Bullock et al., 31
2015, 2016; Neva et al., 2017) required Ôsomewhat hardÕ acute pedaling exercise of a 32
type that the subjects in our own paper did not engage in. 33
34
Perhaps surprisingly therefore, our pupillometry measurements suggest that brisk 35
walking did generate some level of arousal in our subjects Ð the increase of 36
approximately 34% in mean pupil area is almost identical to the increase caused by a 37
transition from ÔrestÕ to Ôlow intensity exerciseÕ measured by Bullock et al in their 38
2016 paper (Bullock et al., 2016)Ð a change that the same group reports as causing a 39
Humans and mice may also differ in the level of neuronal modulation that can be 1
driven by attention. Desynchronized states observed during active behaviour in mouse 2
visual cortex may be similar to attention-driven modulation in primates (Harris and 3
Thiele, 2011) but it is possible that in our studies attentional drive was consistently 4
high because subjects were able to direct their attention to the task regardless of the 5
locomotion state. Could a constitutively high level of neuronal activity driven by 6
attention have masked more subtle modulations linked to locomotion or arousal? We 7
believe this is unlikely. The effects of attention on psychophysical contrast response 8
functions are difficult to measure in humans (because attention is intrinsically linked 9
to the psychophysical task) but when they are measured at a population level with 10
EEG, early visual areas exhibit a moderate but significant increase in response but not 11
contrast gain that is selective for neurons tuned to the stimulus (Lauritzen et al., 2010; 12
Verghese et al., 2012). There would seem to be no reason why changes in sensitivity 13
should be masked by such a modulation and, strikingly, we measured a significant 14
reduction in SNR Rmax for the unmasked probe during our EEG locomotion condition
15
indicating that we are able to measure a changes in this parameters but that these 16
changes are not in the direction predicted by mouse studies. Similarly, we measured a 17
significant increase in C50 for the collinear masking condition when subjects were
18
walking, again showing that this parameter was unlikely to have been driven to 19
saturation by attentional effects. Nevertheless, it is possible that attention was 20
masking activity in a sub-population of neurons which would otherwise have been 21
modulated by locomotion Ð further studies using EEG and a distractor task will be 22
required to dissociate these effects fully. 23
24
Not all animal work finds a correlation between alertness and contrast sensitivity. 25
Cano et al (Cano et al., 2006) and Zhuang et al (Zhuang et al., 2014) for example, 26
report a range of changes in layer 4 of the rabbit visual cortex correlated with 27
alertness including an increase in response gain and neuronal firing reliability but no 28
change in contrast sensitivity. While our stimuli were different to those used by this 29
group (specifically, we used flickering rather than drifting gratings), our 30
psychophysical model fits are consistent with their findings, suggesting a locomotion-31
driven increase in Rmax. Although our EEG data (which largely reflect activity in V1)
32
do not show such an effect, it is nevertheless possible that the mouse visual system is 33
modulated by locomotion or arousal in a manner that is simply different to that found 34
in other mammals. We believe that it would be valuable to measure the effects of 35
locomotion on some of the other parameters studied in rabbits Ð in particular 36
orientation tuning for moving stimuli. 37
38
Two other potential confounds relate to the motion of the head during the locomotion 39
condition: 40
41
First, it is possible that head motion generates retinal slip causing the images to move 42
across the retina slightly during each presentation. There is some evidence that retinal 43
ÔblurÕ can degrade acuity at velocities above 3¡/s (Westheimer and McKee, 1975). 44
While the effect of retinal motion is more complex than a simple temporal integration 45
(Burr, 1980), it is possible that center/surround stimuli are less well-segregated in 46
locomoting subjects and therefore overlap to some degree. This, in turn, might 47
introduce a second, largely precortical, and therefore untuned ÔoverlayÕ masking effect 48
(Petrov et al., 2005). We tested for the effects of poor image stabilization in the 49
move rapidly during the 200ms that they are presented. Thresholds in this condition 1
were not significantly elevated relative to the ÔstaticÕ condition (Figure 3) and, most 2
importantly, there was no significant increase in untuned masking from the orthogonal 3
mask condition. This is likely to be a conservative test for retinal slip: The motion of 4
the stimuli was both brief (and therefore untrackable) and random (and therefore 5
unpredictable) while motion on the retina introduced by imperfect fixation while 6
walking would have a predictable motion trajectory. We therefore believe that retinal 7
slip is not responsible for the increase in tuned surround suppression that we observed 8
in the locomoting condition. 9
10
Finally, head motion also contributed to broadband instrument noise in the EEG 11
signal. Could this have masked a spectrally-localized increase in signal amplitude? 12
Our data suggest not. Broadband noise increases the signal amplitude across all 13
temporal frequencies but the effect is strongly mitigated in SSVEP recordings because 14
of the high level of signal averaging: noise is phase randomized and therefore 15
averages rapidly to zero across multiple presentations. In comparison, the signal 16
generated by the flickering stimulus is phase locked and is therefore unaffected by 17
averaging across time bins. In our data, the mean response at the tagged input 18
frequency was 0.47µV in the stationary condition and 0.53µV in the walking 19
condition Ð an increase in magnitude of approximately 0.06µV. However, in 20
comparison, the mean sideband amplitude increased from 0.03 to 0.19µV Ð an 21
increase of approximately 0.13µV. We expect broadband noise to be approximately 22
equal across neighbouring frequency bins. Our data therefore suggests that, if 23
anything, the evoked signal amplitude decreased when subjects were locomoting and 24
the increase in raw amplitude at 7Hz was due to broadband noise (hence the apparent 25
decrease in SNR seen in Figure 6 and the corresponding decrease in Rmax in Figure 7).
26
Our results indicate that very low-level visual processing is not necessarily altered by 27
locomotion in humans. But it is also clear that periods of treadmill running can 28
recalibrate the perception of egomotion in humans (Pelah and Barlow, 1996) Ð 29
presumably through a normalization mechanism that combines information about 30
optic flow and motor function. The error-minimization mechanisms that drive this 31
normalization must be activated immediately when visual information fails to match 32
that expected from the locomotion state (as in our experiments) and experiments with 33
flow-fields in more complex simulations have revealed signals relating to this sensory 34
combination in mouse primary visual cortex (Keller et al., 2012; Saleem et al., 2013). 35
We therefore hypothesise that it might be possible to measure large EEG signals 36
relating to these errors in future experiments that present optic flow stimuli to 37
locomoting subjects Ð ideally in a head-mounted display system that eliminated 38
Bradley, M.M., Miccoli, L., Escrig, M.A., Lang, P.J., 2008. The pupil as a measure of 1
emotional arousal and autonomic activation. Psychophysiology 45, 602– 2
607. doi:10.1111/j.1469-8986.2008.00654.x 3
Bullock, T., Cecotti, H., Giesbrecht, B., 2015. Multiple stages of information 4
processing are modulated during acute bouts of exercise. Neuroscience 5
307, 138–150. doi:10.1016/j.neuroscience.2015.08.046 6
Bullock, T., Elliott, J.C., Serences, J.T., Giesbrecht, B., 2016. Acute Exercise 7
Modulates Feature-selective Responses in Human Cortex. Journal of 8
Cognitive Neuroscience 1–14. doi:10.1162/jocn_a_01082 9
Burr, D., 1980. Motion smear. Nature 284, 164–165. doi:10.1038/284164a0 10
Cano, M., Bezdudnaya, T., Swadlow, H.A., Jose-Manuel, A., 2006. Brain state and 11
contrast sensitivity in the awake visual thalamus. Nature neuroscience 9, 12
1240. 13
Cavanaugh, J.R., Bair, W., Movshon, J.A., 2002. Nature and Interaction of Signals 14
From the Receptive Field Center and Surround in Macaque V1 Neurons. 15
Journal of Neurophysiology 88, 2530–2546. doi:10.1152/jn.00692.2001 16
DeAngelis, G.C., Freeman, R.D., Ohzawa, I., 1994. Length and width tuning of 17
neurons in the cat’s primary visual cortex. J Neurophysiol 71, 347–374. 18
Efron, B., Tibshirani, R.J., 1993. An Introduction to the Bootstrap. Chapman \& 19
Hall. 20
Erisken, S., Vaiceliunaite, A., Jurjut, O., Fiorini, M., Katzner, S., Busse, L., 2014. 21
Effects of locomotion extend throughout the mouse early visual system. 22
Curr. Biol. 24, 2899–2907. doi:10.1016/j.cub.2014.10.045 23
Foley, J.M., Legge, G.E., 1981. Contrast detection and near-threshold 24
discrimination in human vision. Vision Res. 21, 1041–1053. 25
Fu, Y., Tucciarone, J.M., Espinosa, J.S., Sheng, N., Darcy, D.P., Nicoll, R.A., Huang, Z.J., 26
Stryker, M.P., 2014. A cortical circuit for gain control by behavioral state. 27
Cell 156, 1139–1152. doi:10.1016/j.cell.2014.01.050 28
Haider, B., Häusser, M., Carandini, M., 2013. Inhibition dominates sensory 29
responses in the awake cortex. Nature 493, 97–100. 30
doi:10.1038/nature11665 31
Harris, K.D., Thiele, A., 2011. Cortical state and attention. Nat. Rev. Neurosci. 12, 32
509–523. doi:10.1038/nrn3084 33
Itti, L., Koch, C., Braun, J., 2000. Revisiting spatial vision: toward a unifying model. 34
J Opt Soc Am A Opt Image Sci Vis 17, 1899–1917. 35
Kaneko, M., Fu, Y., Stryker, M.P., 2017. Locomotion Induces Stimulus-Specific 36
Response Enhancement in Adult Visual Cortex. J. Neurosci. 37, 3532–3543. 37
doi:10.1523/jn.3760-16.2017 38
Kaneko, M., Stryker, M.P., 2014. Sensory experience during locomotion promotes 39
recovery of function in adult visual cortex. Elife 3, e02798. 40
Keller, G.B., Bonhoeffer, T., Hübener, M., 2012. Sensorimotor mismatch signals in 41
primary visual cortex of the behaving mouse. Neuron 74, 809–815. 42
doi:10.1016/j.neuron.2012.03.040 43
Knierim, J.J., van Essen, D.C., 1992. Neuronal responses to static texture patterns 44
in area V1 of the alert macaque monkey. J. Neurophysiol. 67, 961–980. 45
Kontsevich, L.L., Tyler, C.W., 1999. Bayesian adaptive estimation of psychometric 46
slope and threshold. Vision Res 39, 2729–2737. 47
Lamme, V.A., 1995. The neurophysiology of figure-ground segregation in primary 48
Lauritzen, T.Z., Ales, J.M., Wade, A.R., 2010. The effects of visuospatial attention 1
measured across visual cortex using source-imaged, steady-state EEG. 2
Journal of Vision 10, 1–17. doi:10.1167/10.14.39 3
Lee, A.M., Hoy, J.L., Bonci, A., Wilbrecht, L., Stryker, M.P., Niell, C.M., 2014. 4
Identification of a brainstem circuit regulating visual cortical state in 5
parallel with locomotion. Neuron 83, 455–466. 6
doi:10.1016/j.neuron.2014.06.031 7
Lenth, R.V., 2001. Some Practical Guidelines for Effective Sample Size 8
Determination. The American Statistician 55, 187–193. 9
doi:10.1198/000313001317098149 10
McGinley, M.J., David, S.V., McCormick, D.A., 2015. Cortical Membrane Potential 11
Signature of Optimal States for Sensory Signal Detection. Neuron 87, 179– 12
192. doi:10.1016/j.neuron.2015.05.038 13
Mineault, P.J., Tring, E., Trachtenberg, J.T., Ringach, D.L., 2016. Enhanced Spatial 14
Resolution During Locomotion and Heightened Attention in Mouse 15
Primary Visual Cortex. J. Neurosci. 36, 6382–6392. doi:10.1523/jn.0430-16
16.2016 17
Motter, B.C., 1993. Focal attention produces spatially selective processing in 18
visual cortical areas V1, V2, and V4 in the presence of competing stimuli. J. 19
Neurophysiol. 70, 909–919. 20
Murphy, P.R., Robertson, I.H., Balsters, J.H., O’connell, R.G., 2011. Pupillometry 21
and P3 index the locus coeruleus-noradrenergic arousal function in 22
humans. Psychophysiology 48, 1532–1543. doi:10.1111/j.1469-23
8986.2011.01226.x 24
Nachmias, J., Sansbury, R.V., 1974. Letter: Grating contrast: discrimination may 25
be better than detection. Vision Res. 14, 1039–1042. 26
Nelson, J.I., Frost, B.J., 1978. Orientation-selective inhibition from beyond the 27
classic visual receptive field. Brain Res. 139, 359–365. 28
Neva, J.L., Brown, K.E., Mang, C.S., Francisco, B.A., Boyd, L.A., 2017. An acute bout 29
of exercise modulates both intracortical and interhemispheric excitability. 30
Eur J Neurosci 1–13. doi:10.1111/ejn.13569 31
Niell, C.M., Stryker, M.P., 2010. Modulation of visual responses by behavioral 32
state in mouse visual cortex. Neuron 65, 472–479. 33
doi:10.1016/j.neuron.2010.01.033 34
Norcia, A.M., Appelbaum, L.G., Ales, J.M., Cottereau, B.R., Rossion, B., 2015. The 35
steady-state visual evoked potential in vision research: A review. J Vis 15, 36
4. doi:10.1167/15.6.4 37
Nothdurft, H.C., Gallant, J.L., Van Essen, D.C., 2000. Response profiles to texture 38
border patterns in area V1. Vis. Neurosci. 17, 421–436. 39
Polack, P.-O., Friedman, J., Golshani, P., 2013. Cellular mechanisms of brain state-1
dependent gain modulation in visual cortex. Nat. Neurosci. 16, 1331–1339. 2
doi:10.1038/nn.3464 3
Posner, M.I., Petersen, S.E., 1990. The attention system of the human brain. Annu. 4
Rev. Neurosci. 13, 25–42. doi:10.1146/annurev.ne.13.030190.000325 5
R Development Core Team, 2008. R: A Language and Environment for Statistical 6
Computing. R Foundation for Statistical Computing, Vienna, Austria. 7
Reimer, J., Froudarakis, E., Cadwell, C.R., Yatsenko, D., Denfield, G.H., Tolias, A.S., 8
2014. Pupil fluctuations track fast switching of cortical states during quiet 9
wakefulness. Neuron 84, 355–362. doi:10.1016/j.neuron.2014.09.033 10
Rosner, B., 2011. Fundamentals of biostatistics. Brooks/Cole, Cengage Learning, 11
Boston. 12
Rossi, A.F., Desimone, R., Ungerleider, L.G., 2001. Contextual modulation in 13
primary visual cortex of macaques. J. Neurosci. 21, 1698–1709. 14
Saleem, A.B., Ayaz, A., Jeffery, K.J., Harris, K.D., Carandini, M., 2013. Integration of 15
visual motion and locomotion in mouse visual cortex. Nat. Neurosci. 16, 16
1864–1869. doi:10.1038/nn.3567 17
Stocker, A.A., Simoncelli, E.P., 2006. Noise characteristics and prior expectations 18
in human visual speed perception. Nat. Neurosci. 9, 578–585. 19
doi:10.1038/nn1669 20
Thompson, P., 1982. Perceived rate of movement depends on contrast. Vision 21
Res. 22, 377–380. 22
Verghese, P., Kim, Y.-J., Wade, A.R., 2012. Attention selects informative neural 23
populations in human V1. J. Neurosci. 32, 16379–16390. 24
doi:10.1523/JNEUROSCI.1174-12.2012 25
Vinck, M., Batista-Brito, R., Knoblich, U., Cardin, J.A., 2015. Arousal and 26
locomotion make distinct contributions to cortical activity patterns and 27
visual encoding. Neuron 86, 740–754. doi:10.1016/j.neuron.2015.03.028 28
Wade, A.R., 2009. Long-range suppressive interactions between S-cone and 29
luminance channels. Vision Res 49, 1554–1562. 30
doi:10.1016/j.visres.2009.03.023 31
Westheimer, G., McKee, S.P., 1975. Visual acuity in the presence of retinal-image 32
motion. Journal of the Optical Society of America 65, 847–850. 33
Xiao, B., Wade, A.R., 2010. Measurements of long-range suppression in human 34
opponent S-cone and achromatic luminance channels. Journal of Vision 10, 35
1–19. doi:10.1167/10.13.10 36
Zhuang, J., Bereshpolova, Y., Stoelzel, C.R., Huff, J.M., Hei, X., Alonso, J.-M., 37
Swadlow, H.A., 2014. Brain State Effects on Layer 4 of the Awake Visual 38
Cortex. J. Neurosci. 34, 3888–3900. doi:10.1523/JNEUROSCI.4969-39
13.2014 40
1
Legends
2
Figure 1 Stimulus configurations (a) No mask, (b) Orthogonal mask, (c) Collinear 3
mask. Stimuli were presented in a spatial 2AFC paradigm at +- 5¡ from fixation for 4
200ms at a time (d). Subjects indicated the position of the central probe with the 5
highest contrast while either standing on a powered treadmill (e) or straddling the 6
active treadmill belt. 7
8
Figure 2Example stimuli, photograph of experimental set-up, and example Fourier 9
spectrum. (a) shows the matrix of target stimuli, which were rotated about the central 10
fixation by a random amount on each trial. (b) shows the target stimuli with an 11
orthogonal surround mask. (c) shows the target stimuli with a collinear surround 12
mask. The phase alignment between target and mask is arbitrary, as the drifting mask 13
meant that the relative phases of the two stimuli changed over time. (d) is a 14
photograph of the experimental set-up, including the treadmill and a participant 15
wearing an EEG cap. (e) shows an example Fourier spectrum taken from the 16
stationary condition for the highest target contrast tested with no mask. A strong, well-17
isolated response is evident at the target frequency of 7Hz. 18
19
Figure 3 Detection/discrimination thresholds measured at five different pedestal 20
levels. Orthogonal masks (b) generate almost no change in threshold compared to the 21
unmasked condition (a) while collinear masks (c) raise thresholds significantly. 22
Notably, colinear masking is significantly higher in the walking (green) condition. 23
24
Figure 4 Bootstrapped parameters for hyperbolic ratio functions fitted to 25
psychophysical data. Locomotion causes a significant increase in both the 26
semisaturation constant (C50) and a small but still significant increase in the predicted 27
maximum response rate (Rmax). 28
29
Figure 5 Grand average responses at the first harmonic of the stimulus modulation 30
rate for isolated (unmasked) probes. Panels a) and b) show the raw amplitude at the 31
tag frequency F1 while panels c) and d) show the ratio of F1 to the average amplitude 32
of the local side bins (SNR). Although raw amplitude is higher in the locomotion 33
condition, this is due to an increase in broadband noise and not an increase isolated to 34
the SSVEP signal frequency. 35
36
Figure 6 Signal to noise (SNR) ratios as a function of stimulus contrast under 37
In the walking condition this effect is increased. Overall, Rmax is reduced slightly in 1
the walking/locomotion condition. 2
3
Figure 8 Pupil diameters measured in stationary (dark gray) and walking (light gray) 4
conditions. Data from left and right eyes plotted separately in (a) and (b) and each row 5
shows data from a different subject. All subjects had larger pupil diameters in the 6
walking condition (mean diameter increase of 16%, area increase of 34%, p<.001). 7