Good Bye, Agenda 2000
Hello, Agenda 2003
Effects of the Berlin Summit on Own Resources,
Expenditures and EU Net Balances
Jorge Núñez Ferrer
Michael Emerson
Abstract
This paper describes the development of the negotiations from the birth of the Agenda 2000 proposals to the end of the Berlin European Council Summit and discusses the consequences of the outcome. The study shows to what extent net contributions to the EU budget and narrow national interests dominated the negotiations, at the expense of the original aims of the reforms (to prepare the Union for enlargement and for the next round of WTO negotiations), which were practically forgotten. This type of behaviour is by no means unique. On the contrary, it has been recurrent in the history of the EU. Estimates of future expenditures and own resources show that the Berlin European Council conclusions will prove to be far from satisfactory.
Table of Contents
1. Introduction 1
2. The Birth of the Agenda 2000 proposals 1
2.1 Agriculture 1
2.2 Structural Funds and Cohesion Funds 2
2.3 The financial framework 2
3. The German Presidency 3
4. The First Round: Agriculture 6
5. The Berlin Summit 9
5.1 Change in the CAP reforms 10
5.2 Reform of the own resources 12
6. The effect of the Berlin Conclusions on own resources 12
7. Assessing the completeness of the agricultural reforms 18
7.1 Direct Payments and the problems with enlargement 18
7.2 The milkquestion 20
8. WTO 20
9. EU budget expenditure and enlargement 21
11. Conclusions and Recommendations 21
References 25
Annex A. Possible effects of German proposals to EU net balances 27
Annex B. Actual and estimated expenditures and contributions 28
Annex C. Berlin outcome vs. original Agenda 2000 31
Annex D. Own resources and net balances after Berlin 32
Jorge Núñez Ferrer and Michael Emerson .
1
1. Introduction
The Berlin Summit concluded with the suspicious outcome where every Head of State declared victory. The tone of the German Presidency was not so victorious declaring that Germany did not “win the lottery”. There is reason for suspicion if, after long and arduous discussions to reform policies and reduce EU expenditure, member states declare their satisfaction on the result. Something must be amiss, if painful reforms appear not to hurt. In fact, after preliminary calculations and some political considerations, there are grounds to suspect that the reforms proposed are less than satisfactory.
This paper describes the development of the negotiations from the birth of the Agenda 2000 proposals to the end of the Berlin Summit and discusses the consequences of the outcome. The study shows to what extent net contributions to the EU budget and narrow national interests dominated the negotiations, at the expense of the original aims of the reforms (to prepare the Union for enlargement and for the next round of WTO negotiations), which were practically forgotten. This type of behaviour is by no means unique. On the contrary, it has been recurrent in the history of the EU. A comprehensive study on the development of the EU finances can be found in Laffan (1997). In fact, Laffan correctly predicted a confrontation over net balances for the negotiation of the financial framework 2000 to 2006.
2. The Birth of the Agenda 2000 proposals
The European Council Meeting in Madrid, December 1995, requested the European Commission to prepare an outlook for the development of the European Union. In July 1997 the European Commission presented the Agenda 2000 (Commission, 1997a) in response. This document outlined a strategy to tackle the problems of the future, particularly the enlargement of the Union. It also included an assessment of the readiness to accede to the EU of the ten applicant countries from Central and Eastern Europe. This document was followed by detailed reform proposals for the Common Agricultural Policy (CAP) (Commission, 1998a), the Structural (Commission, 1998b) and Cohesion Funds (Commission 1998c, 1998d), the Instrument for Structural Policies for Pre-Accession (ISPA) (Commission, 1998e, 1998f) and a financial perspective for the Union with and without enlargement (Commission, 1998g).
The proposals of the Commission were wide-ranging and aimed, at least officially, at helping the Union to prepare for enlargement and to improve its negotiating position in the WTO talks. The most important proposals for agriculture and Structural and Cohesion Funds can be summarised as follows:
2.1 Agriculture
2.2 Structural Funds and Cohesion Funds
The size of the funds was increasing in real terms, following the rule agreed for the period 1994-99 that these should amount to 0.46 per cent of the EU’s GNP. The regulations proposed to increase the concentration of the funds to smaller areas of the EU and to restrict the allocation to fewer objectives and initiative. Even excluding the amounts set for the acceding member states, the EU15 would spend 32 billion Euro more during the programming period. This was to ensure that more funds were available for better-targeted projects.
2.3 The financial framework
The financial framework for the EU15 (Commission, 1998h) presented an important real rise in the expenditures of the budget primarily caused mostly by the proposals to reform the CAP. This expenditure, combined with the expected and to some extent unpredictable extra costs of enlargement, worried the net contributors considerably. The financial framework was not breaching the ceiling of the EU budget at 1.27 per cent of GNP (although the reliability and accurateness of the Commission numbers have been often questioned), but it would have worsened the balances of the net contributors (or so the interested parties claimed). An estimate of the net balances in 2006 is compared with the year 19971 in Figure 1.2
Interestingly, the balances of Austria and Sweden do not deteriorate according to our estimates. On the contrary, they even improve slightly. This is due to the changes in the distribution of the CAP and the Structural Funds, as well as the fact that TOR3 and VAT contributions were falling from 1997 to 1999. The estimates for 2006 use the 1999 TOR and VAT. The fall has affected the distribution of the contributions.
Given the margin of error in calculating the Structural Fund allocations and the expenditures for the CAP, the net balance estimates have to be taken with care. The 1997 budget itself is affected by the differences between appropriations and actual expenditures and the corrections to the UK rebate, which occurs with a two-year time lag.
From the beginning of the negotiations, four net contributors (Austria, Germany, the Netherlands and Sweden) began discussing their budgetary burden, which they regarded as ‘excessive’. This movement culminated in a proposal by the Austrian Presidency to reform the own resources system in view to correct the ‘excessive’ net balances. The proposal was based on the Fontainebleau European Council of 1984, according to which ‘any Member State sustaining a budgetary burden which is excessive in relation to its
1
1997 is the most recent year with comprehensive data on the breakdown of expenditures.
2
Technical details and assumptions used throughout the text can be found in Annex F. When comparing the budgetary balances, the special circumstances of the year 1997 have to be taken into account. The expenditures were considerably higher than the contributions due to the rollover from funds of the previous year. Furthermore, the UK’s net contribution is small, because of the combination of a particularly high rebate combined with receipts of funds due to other factors such as the BSE crisis. Refunds for the definitive calculations of past rebates and exchange rate fluctuations caused the high rebate. All the details are explained in Commission (1998h).
3
Jorge Núñez Ferrer and Michael Emerson .
3 relative prosperity may benefit from a correction at the appropriate time’ (European Council, 1984).
The Austrian Presidency offered as an option to introduce a generalised correction mechanism, which would work in a similar manner as the UK rebate. This proposal was strongly contested by Spain. It threatened to veto the final EU summit of the Austrian Presidency in Vienna unless the issue was withdrawn from the table. Fearing an inconclusive presidency, the Austrian government opted for the latter, probably in the knowledge that the German Presidency would take up the subject again.
3. The German Presidency
The Spanish reaction at the Vienna Summit did not deter Germany from presenting similar proposals for a budgetary rebate together with a number of other measures to reduce the EU budget burden. The measures discussed by the Presidency can be summarised as follows:
1. Change the budget own resources system by scrapping the VAT resource and only keep the TOR and GNP resources.
2. Introduce a correction mechanism for “excessive net contributions” for member states.
3. Renegotiate budget rebate of the UK.
4. Co-financing4 of the direct payments to farmers.
5. Phase out Cohesion Funds for the member states, which have entered the single currency.
6. Reduce or limit the Structural Funds expenditures.
7. Introduce a ceiling to agricultural spending limiting spending to an annual average equal to the expenditure for 1999 (40.5 billion euro) for the period 2000 to 2006.
The mechanism to cut the net contributions to the Budget would follow a system similar to the one presented by Commission (1998h). Member states, which exceeded in their net contribution to the EU budget 0.3 per cent or 0.4 per cent of GNP, would be eligible for a rebate of 66 per cent of the sum over this level. This follows the rationale of the system for the UK rebate, with the exception that the UK’s threshold is 0 per cent, which makes it valid for the whole net contribution.
4
Belgium Denmark
Germany Greece
Spain
France Ireland
Italy
Luxembourg Netherlands
Austria Portugal Finland
Sweden
UK
-15000 -10000 -5000 0 5000
million euro
Belgium Denmark
Germany Greece
Spain
France Ireland
Italy
Luxembourg Netherlands
Austria Portugal Finland
Sweden
UK
1997 budget
Agenda 2000 proposals - year 2006
[image:8.842.84.700.97.439.2]________________________Jorge Núñez Ferrer and Michael Emerson__________________________
5
The German Presidency began the negotiating process with the principal aim of limiting EU expenditures and reducing the burden to the net contributors (i.e. including itself). In so doing the package of reforms demanded sacrifices of different kinds to the member states. The idea was to have all member states giving up benefits from the budget which can be contested as being too generous or unbalanced. These included the benefits from the Common Agricultural Policy for France, of which it is the main beneficiary. For the UK it required reducing the size of its budgetary rebate. The Cohesion countries had to give up some of the transfers to their economies in the form of Structural or Cohesion Funds. The presidency even mentioned abolishing the cohesion funds for those countries which became members of the Euro-zone. Finally, Italy was asked to accept a switch in the own resources mechanism of the EU budget from the VAT key to GNP, until now Italy was benefiting from VAT system. The measures would also have affected negatively other member states by a combination of the above measures.
[image:9.595.121.483.412.670.2]It was possible to identify at that point a division in the Council in the form of five more or less stable coalitions led by Germany, France, Spain, Italy and the UK (see Figure 2). The loosest of all is the Italian coalition, which is more a group of countries affected negatively by the proposed changes in the own resources decision, rather than from changes in the CAP or Structural Funds. Italy was the most affected country of this group and most vociferous in a number of issues, therefore it is given the leading position.
Figure 2. Negotiating Positions: The German Proposals
D (A, NL, SW)
F (E, EL, I, Irl, P)
E (EL, P, Irl)
UK
Changing Budget rebate Co-financing of CAP Direct Payments Budget rebate
Reduction of Structural and Cohesion Funds Budget rebate
I
(B, DK, Fin, Lux)
VAT/GNP Budget Rebate
Pressure:
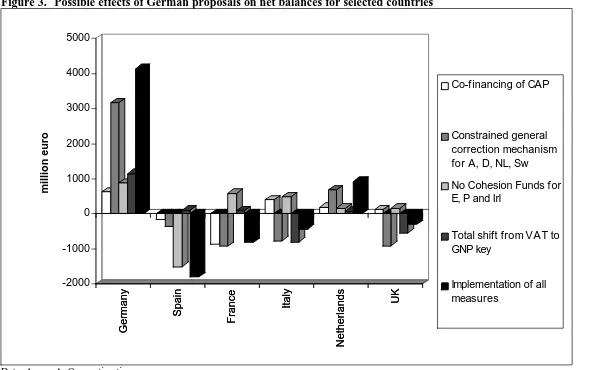
The calculations of net balances of the German proposals assume the following:
• After the price reforms for the CAP, the level of co-financing in agriculture brings EAGGF expenditure down to 40.5 billion for the year 2006.
• Cohesion Funds are eliminated for Ireland, Spain and Portugal.
• Structural Funds are not cut but some areas lose their Objective 1 status.5
• The VAT resource is abolished and only TOR and GNP finance the budget. TOR is maintained at 1999 levels, as its future size is unknown.
• A constrained generalised correction mechanism is introduced, which reimburses 66 per cent of net contributions exceeding 0.3 per cent of national GNP. Members getting the rebate are, however, not exempt from participating in the reimbursement of rebates by other members, i.e. Germany has to contribute to the rebate of the Netherlands and vice versa. For technical details see Commission (1998h).
• The UK correction mechanism remains untouched. It was quite clear from the beginning of the process that not much was to be expected as a concession from the UK.
4. The First Round: Agriculture
By putting the reform package of the CAP as the first item to be solved, the German presidency probably expected to have more influence on the outcome. The need for a positive conclusion of the Agenda 2000 should have pressurised the member states to accept a solution favoured by the Presidency. If this expectation were to be true, it backfired. The French took the opposite view. If the successful conclusions of the overall Agenda 2000 are of paramount importance for the EU and in particular for Germany, then France can just force through its own interests by simply not co-operating.
Figure 4 shows the coalitions during the initial stages of the negotiations. More formal coalitions are presented in the black boxes, agreements on particular issues across coalitions are connected by arrows. It is worth mentioning that the coalitions on agricultural policy differ of the alliances on an overall package. This is clear when comparing figures 4 and 5. This can have positive or negative effects during negotiations for a reform of the CAP. Positive, because the CAP comes under pressure from other interest groups, or negative, because agricultural reforms can lose importance inside a broader package.
It was immediately observable that the predominant view was against agricultural reforms. These were not considered urgent. The only countries calling for a radical reform were the UK, Sweden and Italy, forming the so-called 'London Group'. However, there was no clear common position. Italy's commitment to reform was particularly unstable due to its interest on a milk settlement. This and other similar weaknesses soon eroded the coalition. Other hidden agendas on the overall situation of the net contributions soon affected the UK’s and Sweden's resolve for a reform.
5
Figure 3. Possible effects of German proposals on net balances for selected countries
Germany
Spain
France
Italy
Netherlands
UK
-2000 -1000 0 1000 2000 3000 4000 5000
million euro
Germany
Spain
France
Italy
Netherlands
UK
Co-f inancing of CAP
Constrained general correction mechanism for A, D, NL, Sw
No Cohesion Funds f or E, P and Irl
Total shift from VAT to GNP key
Implementation of all measures
Figure 4. Initial Coalitions for CAP reform negotiations I only D (A, NL) F E (EL, P,Irl)
Co-financing of CAP No need for strong
reforms
UK
SW, I
'The London Group'
No clear alliance, no clear leader
(B, DK, Fin,Lux)
Increase in milk quotas No need for strong reforms
Co-financing OK
Increase in milk quotas No need for strong reforms Co-financing OK Strong reforms, but no clear
common position. Co-financing OK Drastic dairy reform (I has faltering commitment) No change in milk
regime
No need for strong reforms
No Co-financing
Degressivity inDPs
No need for radical reforms Increase in milk quotas Co-financing acceptable
Serious negotiations began with the reform proposals for the agricultural sector. From the beginning, an impasse was formed by France and Germany. France could not accept co-financing of the direct payments for the CAP, which to an extent was accepted by most other member states. This measure was unpalatable for the farmers in France, who claimed that this would be a move towards discrimination in the future among producers of different member states. Furthermore, France would have to spend more of its own state funds to finance the direct payments for its large agricultural sector.
Farmers (and in particular the vociferous French farmers) were probably also worried that this move would speed up the process of reform, reducing the size of the direct payments. Common policies are generally believed to be more resistant to change. There is a large amount of literature which supports the idea that the Council of the EU has the tendency to keep common policies untouched, which at national level would not survive (a good review of the effects on decision making in the Council of Ministers can be found in Hayes-Renshaw and Wallace, 1997).6
However, France accepted to a degree that the expenditures for agriculture were increasing too much with the reform proposals by the Commission. It therefore proposed
6
Other recommended readings: Scharpf (1988) discusses in more detail how the Council of Agricultural
Ministers fosters the status-quo for the CAP. Ten years later the situation has not changed much.
________________________Jorge Núñez Ferrer and Michael Emerson__________________________
9
to reduce the size of the price cuts for cereals and beef, to abandon the milk reforms and to introduce a gradual fall of the direct payments by a certain percentage every year for larger farms, the so called "degressive payments".
Germany could not accept the gradual reductions in direct payments. It was here that the German intentions became obvious. It was proposing co-financing instead. This system would replace partially the direct payments to farmers from the budget with direct handouts from the national budget. This measure was able to kill two problems at once. One would have been to reduce the politically controversial transfers to the European budget, which would have then been replaced with less transparent national transfers. The second would have been a reduction in the transfers through the CAP of funds from the net contributors to the net beneficiaries of the direct payments policy. Co-financing was important for Germany because it guaranteed the farmers from East Germany, who are under an extreme financial strain, the full amount of direct payments. Germany demonstrated little interest in radical reforms and was indirectly trying to use the Presidency as a tool to generate a reform, which would serve well its national interests. It also regarded quite favourably calls by various members to reduce the size of reforms. Soon Germany offered then a highly diluted proposal after bilateral negotiations with France, which demonstrates that it did not regard substantial agricultural reforms as necessary.
This was generally considered a exaggeratedly weak proposal, and was also strongly contested by the 'London group'. The negotiations stalled again. At this stage, the German Presidency made a final move and proposed a package, which was similar to the original Commission proposals. However, it reduced overall expenditure for the period until 2006 by delaying the introduction of the milk reforms and introducing transition periods for the remaining reforms. Interestingly, yearly expenditure at the end of the period from 2006 onwards would have reached practically identical levels to the Commission estimates for the original Agenda 2000 package. It is worth noting the deletion of Article 6 of the horizontal measures, which stipulates a degressive element for payments over a certain amount. This article was affecting negatively East German farmers. In the end, the option to reduce direct payments by a certain percentage every year was kept open, but not agreed upon. The negotiations on the CAP conclude with a non-voted “agreement”. The Agricultural Council defacto left the situation unsolved and open to change in the Berlin Summit, partly because there was no time to further delay the issue. The Presidency's claim that an agreement was reached was clearly not shared by France and some other member states, which hinted that all was open for negotiation in Berlin.
5. The Berlin Summit
Again five positions were observable. The first consisted in the coalition of Germany, Austria, the Netherlands and Sweden. This was the group of member states claiming that their net contributions are excessive. The second group was formed by the Cohesion countries and headed by Spain, defending their benefits trough the Structural and Cohesion Funds. France held the third position and was determined to reopen the agricultural chapter. The UK entrenched itself to defend the UK rebate, and the last group consisted on the member states with less clear preferences. Italy is at a leading position in the picture, because of interests to secure an even higher milk quota for itself.
As a consequence of the above constellation, the Summit's agenda looked more like a set of proposed “fine tunings” than an radical change of the Unions' policies. Small changes here and there were possible allowing a conclusion of the negotiations. A fundamental change in the Union’s policies was already out of sight.
• Agriculture: “Fine Tuning” consisted in insisting on limits to direct payments, through modulation (ceilings on what farmers can get) or using a system of degressive direct payments.
• Structural Funds: “Fine tuning” consisted in a conservative reduction in Structural and Cohesion Funds (scrapping the Cohesion Funds was out of question). Some compensation for Ireland and Portugal was to be expected to cushion the negative impacts for due to the losses caused planned changes of the Objective 1 criteria of the Structural Funds.
• Financing (Budget rebates): “Fine tuning” here consisted of technical adjustments to the financing of the UK rebate and some compromises on the treatment of future enlargement costs. Those expenditures to the CEECs before accession, which are external to the Union and excluded from the rebate, should not be included in the rebate calculation after enlargement.
The constrained general correction mechanism for net balances disappeared from the programme.
• Financing (own resources): The shift from the VAT to GNP key was expected to go through, mainly because until then it had not been contested seriously on any particular occasion.
5.1 Change in the CAP reforms
________________________Jorge Núñez Ferrer and Michael Emerson__________________________
[image:15.595.132.463.121.390.2]11
Figure 5. Initial negotiating positions: Berlin Summit
D
(A, NL,
F E
(EL, P,
UK
“Fine Tuning” of CAP expenditure degressivity in direct payments
I
(B?, DK?, Fin?, Pressure for cut in UK
rebate:
Pressure for Degressivity of CAP Directpayments:
Pressure for Cohesion and Structural Fund cuts:
“Fine Tuning” of Structural and Cohesion Funds
UK rebate reforms
The reduction in expenditures is, however, more fictitious than real. The new 'reformed' CAP is less expensive then in the original Agenda 2000 proposals because of the reduction and postponement of reforms. Ironically, once most of the reform delays are over, the budget expenditures for agriculture in 2006 approximate in our estimates the originally planned levels in the Commission’s financial framework. The expense would reach similar levels after 2006, but without the same depth of reform. The problem of the CAP has simply been shifted to the next generation.
The behaviour of the 'London group' is a clear sign of the low priority the CAP reform has in the list of national interests. For Italy, the calls for a fundamental reform of the CAP were mainly a search for a solution to its problems with the dairy quota. As soon as the quota was increased for Italy to an acceptable level, Italy lost any interest of a fundamental reform. It did not even seem very affected by the fact that the actual reform of the milk regime was postponed and that the lack of reform coupled with an increase in the quotas runs counter to the logic of economic efficiency, enlargement or WTO.
Sweden was also interested in finding a domestically 'sellable' outcome to the summit, and a special budget rebate suited the government fine, despite the distortions such rebate systems introduce at EU level. Once such an interesting system was granted, Sweden apparently lost its appetite for reform.
5.2 Reform of the own resources
Own resources were modified to correct ‘excessive’ net contributions (as well as to reduce ‘unfair’ benefits). In order to achieve this, reductions of the VAT call rate to 75 per cent by 2002 and to 50 per cent by 2004 were scheduled. For traditional own resources, the percentage retained as the share of so-called collection costs will be increased from 10 to 25 per cent. The system of financing of the UK rebate by the remaining 14 member states has been altered in an ad-hoc fashion, reducing the contribution towards the rebate for Germany, the Netherlands, Austria and Sweden to 25 per cent of the unadjusted amount. The UK rebate itself has remained practically untouched.
Despite the apparent achievement to limit expenditure, it has to be noted that the reforms in agriculture are less expensive budgetarily because the reforms themselves were substantially diluted. It also seems paradoxical that when the Union is expanding its influence in the international arena (e.g. in the Balkans) the amount scheduled for external action has been revised downwards.
6. The effect of the Berlin Conclusions on own resources
After the unconvincing end of the Berlin Summit, it is the opinion of the authors that the survival of the conclusions until 2006 is not possible. In particular, this is expected to be true at least for decisions on the own resources and the expenditure allocation for enlargement. The analysis that follows will elucidate the reasons for such an opinion. The analysis will show the effects of the reform on the net balances after the full implementation of the reforms, i.e. 2006 (except for milk which will still be in the transition period of implementation). These figures exclude the enlargement costs. The costs of enlargement will be discussed later.
According to estimates the overall expenditure for the EU15 in 2006 will reach 92.8 billion euro (Annex B, Table B.3.2), close to but higher than the estimate presented in the Presidency Conclusions of 90.3 billion euro. This is a saving from the estimate of 102.5 billion euro for 2006 under the original Agenda 2000 Commission proposal (Annex B, Table B.2.2). Our estimates show savings for this year of 9.7 billion euro.
This has been achieved in a number of ways such as reducing planned expenditure on agriculture, structural and cohesion funds as well as internal policies and external action. The net balances for the year 2006 after all the Berlin changes are compared in Figure 6 to the original Commission proposals and the 1997 budget. The estimated changes to the Agenda 2000 in the Berlin Summit can be found in Annex C - Table C.1.
________________________Jorge Núñez Ferrer and Michael Emerson__________________________
13
The effect on net contributions is quite clear, the net contribution reduction by approximately 2.7 billion euro for Germany is affected strongly by the reduction in the overall expenditure. The own resources reform in itself only brings 1,3 billion euro as saving.7
We can see some other interesting developments in Figure 7. The shift from the TOR and VAT keys to GNP strongly benefits Germany and the Netherlands. Italy is as expected the main loser from the changes, increasing its net contribution by 865 million euro, 574 from the VAT to GNP change and 291 as contribution to the UK rebate. For the UK the loss amounts to 270 million euro. This is after deducing the UK advantage8 from the rebate. Without this reduction, the UK would benefit from the changes and reduce its net contribution by 84 million euro. This assumes, however, that the UK will not contribute to the rebate of its own rebate to Austria, Germany, the Netherlands and Sweden. This is not clear in the Berlin Conclusions.
One question that is now interesting to clarify is to what extent the new balances have improved the relationship between the ability to pay and the net contributions. Figures 8a and 8b give an answer. This figures shows the relationship between GNP per capita and net contributions for the years 1997 and 2006.9
7
It has to be noted that the reduction in the contribution to the UK rebate calculated here is not for the previous year 2001 (as specified in the Berlin Conclusions), but for 2002 for mathematical convenience.
8
This follows the Berlin Conclusions text; "In accordance with the principles reflected in the conclusions of
the 1988 Brussels and 1992 Edinburgh European Councils, its amount shall not include windfall gains from changes to the financing system. So technical adjustments in the new Own Resources Decision will, as before, neutralise windfall gains resulting from the progressive reduction of the VAT reserve and now from the increase in the percentage of Traditional Own Resources retained by Member States to cover their collection costs." This has been taken into account for the estimates in 2006. However, as Annex F explains the UK advantage pre 1998 is not properly modelled in, due to its complexity.
9
Belgium Denmark
Germany Greece
Spain
France Ireland
Italy
Luxembourg Netherlands
Austria Portugal Finland
Sweden
UK
-15000 -10000 -5000 0 5000 10000
million euro
Belgium Denmark
Germany Greece
Spain
France Ireland
Italy
Luxembourg Netherlands
Austria Portugal Finland
Sweden
UK
1997
Commission proposals for 2006
Berlin - 2006
[image:18.842.79.675.102.471.2]Figure 7. Breakdown of effects in changes of the own resources decision
Germany France
Spain Italy
Netherlands
UK
-5000 -4000 -3000 -2000 -1000 0 1000 2000 3000 4000 5000
million euro
Germany France
Spain Italy
Netherlands
UK
TOR
VAT
GNP
Uk Correction
TOTAL
Figures 8a. Relationship between net contributions per capita and GNP per capita, 1997 0 5000 10000 15000 20000 25000 30000 35000 40000 45000 Luxembourg
Denmark AustriaGermany Sw eden Belgium France Netherlands UK Finland Italy
Ireland SpainGreece Portugal
GDP per capita ('000 euro)
-500 0 500 1000 1500 2000
Net Contributions per capita (euro)
GDP per capita
Net contributions
Data: Annex E
Figures 8a. Relationship between net contributions per capita and GNP per capita, 2006
Data: Annex E 0 5000 10000 15000 20000 25000 30000 35000 40000 45000 50000 Luxembourg
Denmark AustriaGermany Sw eden Belgium France Netherlands UK Finland Italy
Ireland SpainGreece Portugal
GDP per capita ('000 euro)
-500 0 500 1000 1500 2000
Net contributions per capita (euro)
GDP per capita
Net contributions
________________________Jorge Núñez Ferrer and Michael Emerson__________________________
17
Figure 9a. Average Farm Net Value Added compared to per farmer receipts from EAGGF10, 1996
[image:21.595.83.478.99.372.2]Data source: Court of Auditors (1997)
Figure 9b.Average Farm Net Value Added compared to per farmer receipts from EAGGF, 2006
Source: Own calculations
10
European Agricultural Guidance and Guarantee Fund
0 2000 4000 6000 8000 10000 12000 14000
0 10 20 30 40 50 60 70 80
NVA-Farm (ECU 1000)
average FEOGA expenditure per farmer (ECU)
P EL E I Swe Fin D Lux F Irl DK B UK NL A 0 2000 4000 6000 8000 10000 12000 14000
0 10 20 30 40 50 60 70 80
NVA-Farm (euro 1000)
average FEOGA expenditure per farmer (euro)
[image:21.595.84.477.417.675.2]The ability to pay is assumed to be based on GNP per capita. Not everybody does necessarily consider this as an acceptable method. Commission (1998h) discusses various interpretations. Putting aside differences of purchasing power due to price differences, a proper functioning EU budget following the solidarity and convergence criteria, should show a negative linear relationship between net balances and GNP per head. The relationship is there, but relatively weak. The changes agreed in Berlin do not seem to change much the picture although some improvements have been achieved. The strongest change is due to the Irish position, which actually seems an improvement in fairness.
The outcome is leaving a lot of budgetary distortions, mainly due to the perverse distribution effects of agricultural policies. These are very visible for Belgium, Denmark, France and Ireland11. The relationship of income per farmer to CAP receipts is extremely regressive in nature and clearly one of the main causes of the distortions. Figures 9a and 9b shows the regressive nature of the policies. In 1996 the relationship between NVA (Net Value Added) per farm was positively correlated with income per farmer! As the reforms have not changed the nature of the policies, this relationship was hardly affected. Different proposals to induce some kind of degressivity to direct payments to farmers have failed to be agreed. Only a voluntary introduction of degressive measures by the governments of the member states is permitted. The application and impact of these has yet to be seen. However, the redistribution of the funds deduced from the direct payments to farmers would be redirected for other related measures within the member state, thus not changing at all the relationship depicted in Figures 9a and 9b.
7. Assessing the completeness of the agricultural reforms
This reform was supposed to have paved the way for a smooth enlargement to the CEECs and to give the EU a strong position in the WTO negotiations. Do these reforms really fulfil these requirements? Unfortunately the answer is no. They help, of course, but they have not tackled some of the most problematic and controversial issues. One may argue the contrary, claiming that the main problem was intervention price levels in the agricultural sector and that these have been cut. Prices are without a doubt an important, but not the only, element; direct payments to farmers involve a large number of problems that have not been really solved in the negotiations. Also worrying is the postponement of the milk reform. The timetable for reforms brings the quota system well into the years after the expected first wave of enlargement. The quota regime will bring not only technical difficulties for accession, but will introduce some paradoxes that are presented below. As for whether the price reductions are adequate, future developments in the world market will decide for the EU if the cut was enough.12
7.1 Direct Payments and the problems with enlargement
The EU’s reform is based on the weakly founded assumption that enlargement will not entail making any direct payments to the new members. This assumption has its origins in
11
Luxembourg has an extreme positive relationship with the highest receipts per capita and the highest income per capita. However, this is due to the size of the country and the high administrative expenditures of the EU in the operation of its institutions. A similar, but smaller effect is found in Belgium’s net balance.
12
________________________Jorge Núñez Ferrer and Michael Emerson__________________________
19
the White Paper published in the Madrid EU summit in 1995. This declaration was based on the argument that the Central and Eastern European Countries did not suffer from the cuts caused by the MacSharry reforms and they therefore have no grounds to expect the payments. The real reason, however, is budgetary. Extending the payments to the CEECs would increase the EU expenditures on the CAP considerably, a development which is not welcomed by a number of member states. Since the new members have low GNPs, their contribution to the budget will be very limited, shifting the burden to the present 15 members.
Although there is some logic in the argument about the CEECs not being members when intervention prices were cut, it is far from satisfactory. First, a new farmer in the EU would be entitled to the payments despite the fact that he/she was not farming at the time of the reforms. Furthermore, the farmers of Eastern Germany are entitled to all direct payments, while their prices increased during the period of the MacSharry reforms. Austria, Sweden and Finland are also benefiting from direct payments despite the fact that these countries were not in the EU at the time of the introduction of the reforms of 1992. Second, excluding the CEEC farmers from the direct payments would entail an automatic increase in the regressivity of the policy, i.e. the direct payments will be going to the richer western farmers. Third, there is the question of the single market: it seems inconsistent to pay subsidies to farmers in some regions and not in others; this is discrimination. There is another argument being voiced: since GDP capita in the new member states is low, direct payments at EU level would increase the income of farmers disproportionally and cause unacceptable distortions in income distribution. This is a good argument, but unfortunately the payments in the EU are not linked to GDP per capita. Some members such as Greece, Portugal and Spain have similar incomes per capita as some of the applicant countries, so why should their payments not be also adjusted? For all these reasons, there are no valid arguments for excluding the future CEEC members from these benefits.
While it is true that the EU15 should not deny the direct payments to the new members, it can offer to give the funds in a more efficient way during a transition period for rural and structural development purposes, a sort of addition of the SAPARD13 after accession. Once the transition period is over, the new member should be treated equally. The proper solution is to reform in the meantime the direct payment system of the EU15 to avoid an exacerbation of the present misallocation of CAP resources.
The latest speeches by Commissioner Fishler and some press commentaries, also point out that the Commission is aware that just denying the present system of direct payments to the CEECs is not politically acceptable. A formal solution to the problem has not yet been proposed.
It has to be noted that reforming the direct payment levels and distribution after accession of the first group of six applicants (including Cyprus) would be very difficult, as the ministers of the CEECs will be sitting at the Council, increasing number of decision-makers to 21. This situation should be avoided.
13
7.2 The milkquestion
The milk reform has been postponed again, now until 2005. What will this mean? First and foremost it reduces the expenditures of the CAP for the period until 2005. The reform would have been costly. This is another sign that most of the “reform savings” have been created by reforming less and by postponing the implementation. The milk quota reform is now, however, scheduled for a year after the expected entry of the first CEECs to the EU. This has the unfortunate implication that CEECs may have to adopt the quotas and then participate in the negotiation of a reform of the regime. The failure to abolish quotas before enlargement, or even only reduce them may become very costly. If the CEECs implement the quota system and guarantee high prices for the milk producers, the EU will find itself in a dilemma when reducing prices. The farmers of the CEECs will claim with reason the direct payments, thus reinforcing the argument above. There will be no getting round the compensation problem. For an enlarged Union, Brenton and Núñez Ferrer (1999) predict a compensation payment between 6 billion (50 per cent compensation) to 12 billion euro (full compensation). It seems also irrational to introduce a complicated policy like the milk quota regime in the new member states to then subsequently abolish it. Apart from these problems, the highly fragmented farm structure in some of the member states and in particular Poland will make the imposition of quotas a technical nightmare.
8. WTO
________________________Jorge Núñez Ferrer and Michael Emerson__________________________
21
9. EU budget expenditure and enlargement
It was claimed by the heads of state that the Berlin Summit made the necessary changes to pave the way for accession. The margin available in the projected 2006 budget seems to be able to accommodate even the extension of the direct payments for agriculture to the CEECs. The total margin after accession is of 17.096 billion Euro, i.e. 0.18 per cent of EU GNP.1 In a recent calculation of the effects of the CAP on the applicant countries (excluding Cyprus) and the EU budget using the Agenda 2000 proposals, the cost of enlargement including the direct payments to farmers would increase the estimated costs of enlargement by 6 to 7 billion Euro (Münch, 1999). Therefore there is no apparent problem with the ceiling.
The issue however does not stop at this level. 2006 is a year in which the acceding countries are still on a transition period. In fact, the Structural Fund payments would still too low if compared to the present members. The new members are all eligible to have all their national territory under Objective 1 of the Structural Funds. Taking the reasonable assumption that the receipts from the Structural Funds per capita will rise to the same levels as in other low income regions of the EU, the results are striking. Using for simplicity Greece as a benchmark, the planned average yearly expenditure for Objectives 1 to 3 of the Structural Funds in Greece is 2,99 billion euro (without including other community initiatives not in the Objectives). This is equivalent to 285 euro per capita. The population in the first wave of acceding CEECs is of 66 million. If the transfers per capita reached 285 euro, the increase in the Structural Funds would reach nearly 19 billion euro, up to 7 billion more than in the 2006 projected levels. Thus the final bill for the budget of the five CEECs could easily reach over 30 billion euro if combined to the direct payments (not including any milk reform).
There is a final concern left. The new members would contribute 3-4 billion euro to the budget due to their very low GNP levels. The result could easily mean for the EU15 budget contributions an increase by 6 - 12 billion euro after 2006, of which nearly a third would fall on Germany. The rebates for net contributors, so arduously negotiated in Berlin, would be swamped by this.
It is reasonable to expect a new round of discussions on these issues during the present financial framework given also the "unexpected" rise in expenses for external action (e.g. Kosovo).
11. Conclusions and Recommendations
All the arguments presented above point to the conclusion that the Berlin Summit reforms, despite moving in the right direction, fell far short of solving the problems of net contributions, the WTO, enlargement and the rationality of agricultural policy. The EU is driving straight into a collision course with enlargement and the WTO, overshadowed by increasing conflicts on the EU budget distribution based on the unhealthy argument of the juste retour.
shows the Common Agricultural Policy as the centrepiece of the imbalances. However, instead of addressing the problem directly and efficiently, EU member states have preferred to introduce complicated and theoretically questionable “rebate systems”. The new ingenious “rebate on the rebate” for example has no clear theoretical foundations, shifting the burden of the budget to poorer regions.
Therefore, new reforms in the EU should be negotiated before enlargement. A failure to redress these shortcomings before enlargement would require reforms with 21 members or more taking part in decision-making with a new set of policy preferences and disputes. Changes in an enlarged European Union with countries undergoing difficult periods of economic reform can only be more difficult, risking further aggravation of the situation. Furthermore, larger Union with obscure and unclear expenditure systems, corrected by even more obscure and blurred rebate systems, will reduce the citizens' confidence in EU institutions.
For this reason, it is urgent to reform the Common Agricultural Policy and the own resources system. A negotiation of these issues should not wait for the next financial framework for 2006 to 2012, but should rather be an Agenda 2003. The negotiation should occur before the accession of the new member states. As the Union expands further and specially with poorer regions, the proper functioning of the EU budget is of paramount importance.
Reforming the Common Agricultural Policy
The following reform package is proposed:
1) The present system of direct payments based on the principle of price compensation, should be decoupled from production, phased out and not be available to any farmers which enter the market after this reform. This eliminates the problem of eligibility with farmers in the CEECs.
2) The support system should be replaced by decoupled payments. Production decisions and set aside areas should be based on market conditions and be of a voluntary nature. This would bring the EU direct payments in line with WTO ‘green box’ rules. 3) These decoupled payments should be “Green payments” linked to the application of
improved environmental farming techniques.
4) A greater share of the Common Agricultural Policy budget should be directed to rural development programmes. Farming is not the only activity in rural areas. On the contrary, it is the lack of other services and activities, which fosters the depopulation and degradation of rural areas. Problems the CAP should officially be addressing. 5) Except for the compensatory payments, which are phased out, all funds should be
available for the CEECs after accession. 6) Export subsidies should be abolished.
________________________Jorge Núñez Ferrer and Michael Emerson__________________________
23
8) The sugar policy should be reformed; there is no need to maintain the excessively high price levels presently in operation. Compensation payments as set out in point 2 could be introduced.
This set of changes fits the original objectives of the Common Agricultural Policy better than the present system and is in line with the newest ideas of multifunctionality and the European model of agriculture.
The speed and shape of the introduction of the reforms is discussed further below.
The own resources system
The own resources system along should revised the following lines:
1) Eliminating all rebate systems. This can go hand in hand with the changes in the distortions on the expenditure side. The agricultural policy changes should reduce the imbalances and therefore invalidate the arguments for rebates. The overall budget expenditure on agriculture also should fall as the funds are distributed on more clearly defined and better-targeted objectives.
2) It is recommended to move to a budget based solely on customs duties/levies and GNP keys. The elimination of the VAT resource should be completed. This would also further facilitate the elimination of budget rebates.
Enlargement and reform converge
The proposals above mean making clear a missing element in the EU’s present strategy and introducing a double transition and convergence policy. A transition period in agriculture is introduced in the CEECs, for them to adapt to the CAP policies, which are themselves changing over the same transition period. Policies on both sides should converge on a common denominator, for example by 2010. By this date, the EU should have completed all of the above-mentioned changes, including changes in own resources.
The own resources reforms should be introduced without delay. The rebate systems can be phased out in parallel with the reforms in the agricultural policy, and are abolished before the end of the transition periods for the CEECs.
For agriculture, Figure 10 below describes a possible accession strategy with a six-year transition period. The phasing out of compensatory payments should go hand in hand with the increase in funds in other support measures, which should also be available in the new member states. The CEECs would receive therefore not only equal treatment, but would introduce a reformed agricultural support system simultaneously with the EU.
0 5 10 15 20 25 30 35 40
2004 2005 2006 2007 2008 2009 2010
billion euro
Direct payments
Rural development
Environmental p a y m e n t s
Dairy and sugar compensatory p a y m e n t s Total new system EU 15
CEECs
Total new system EU 21
Note: The Figure includes only the direct payments and their replacement other forms of support.
The direct payments of the CAP would be phased out completely from 2004 to 2010, as would export subsidies (not shown in the figure), and reforms of the dairy and sugar regimes would see the scrapping of quota systems. There would be compensating measures, with permanent environmental payments and rural development aids, and transitional aids to the milk and sugar sector. Under this scenario, the net budgetary saving would amount to more than 12 billion euro, in addition to which there would be the abolition of export subsidies (about 6 billion euro in recent years). These savings leave ample room for manoeuvre for the subsequent further enlargements.
The CEECs’ receipts from the budget through the new agricultural support system would amount to approximately 3.5 to 4 billion euro, compared to 6 or 7 billion under the full introduction of the present direct payments.
________________________Jorge Núñez Ferrer and Michael Emerson__________________________
25
References
Brenton P. and J. Núñez Ferrer (1999), EU Agriculture, the WTO and Enlargement, Working Document No 134, CEPS Brussels.
Commission (1997), Agricultural Statistics. Website of the European Commission Directorate General for Agriculture. http://europa.eu.int/comm/dg06/agrista/table_en/ index.htm (7.2.2000)
Commission (1997a), Agenda 2000: For a stronger and wider Union, COM (97) 2000.
Commission (1998a), Proposals for Council regulations (EC) concerning the reform of the common agricultural policy. COM (1998) 158 (final), Brussels, 18.03.1998.
Commission (1998b), Proposal for a Council regulation (EC) laying down general provisions on the Structural Funds, Proposal for a Council regulation (EC) on the European Regional Development Fund, Proposal for a Council regulation (EC) on the European Social Fund, Proposal for a Council regulation (EC) on structural Measures in the fisheries sect . COM (1998) 131 (final), Brussels, 18.03.1998.
Commission (1998c), Proposal for a Council regulation (EC) No… amending Regulation (EC) No 1164/94 establishing a Cohesion Fund, Commission web-site: www.europa.eu.int/comm/dg16/document/doc1g_en.htm/dwnld/pdf/draft/fcoheen.pdf (18.03.98)
Commission (1998d), Working Document -Proposal for a Council regulation (EC) No amending Regulation (EC) No 1164/94 establishing a Cohesion Fund, Proposal for a Council regulation (EC) No amending annex II to Regulation (EC) No 1164/94 establishing a Cohesion Fund, Commission web-site: www.europa.eu.int/comm/dg16/ document/doc1g_en.htm/dwnld/pdf/draft/expocoen.pdf (18.03.98)
Commission (1998e), Draft Proposal - Draft Council regulation (EC) No /98 of 1998 Establishing an Instrument for Structural Policies for Pre-Accession, Commission web-site: www.europa.eu.int/comm/dg16/document/doc1g_en.htm/dwnld/pdf/draft/ expopaen.pdf (18.03.98)
Commission (1998f), Draft Proposal - Council regulation for an Instrument for Structural Policies for Pre-Accession- ISPA Explanatory Memorandum, Commission web-site: www.europa.eu.int/comm/dg16/document/doc1g_en.htm/dwnld/pdf/draft/ expopaen.pdf (18.03.98)
Commission (1998g), Communication from the Commission to the Council and the European Parliament - on the establishment of a new perspective for the period 2000-2006, COM (1998) 164 final.
2000 - Financing the European Union - Commission Report on the Operation of the Own Resources System. Bulletin of the European Union, Vol. 2/98, Office for Official Publications of the European Communities, L - 2985 Luxembourg.
Commission (1998i), Twenty-seventh Financial Report concerning the European agricultural guidance and guarantee fund EAGGF, Guarantee section- 1997 Financial Year, COM(1998) 552 final.
Commission (1999), ‘Financial allocations’, Commission website, http://europa.eu.int/ comm/regional_policy/ag2000/finan_en.htm (5.2.2000)
European Court of Auditors (1997),Annual report concerning the financial year 1996, (97/C 348/01), Volume I, http://www.eca.eu.int/EN/reports_opinions.htm (5.2.2000)
European Council (1984), 'Conclusions of the Presidency', Bulletin of the European Communities, 6 - 1984.
European Council (1999), 'Conclusions of the Presidency', Press Release (Berlin 25-03-1999) - Nr. sn 100 (Presse).
European parliament (1999), ‘Reform of the own resources system and net positions in the EU budget’, Directorate-General for Research, Budgetary Affairs Series, Working Paper BUDG 100 - 10/1998, Website: http://www.europarl.eu.int/dg4/wkdocs/budg/100 /en/
Hayes-Renshaw, F. and Wallace, H. (1997), The Council of Ministers, The European Union Series (London: MacMillan Press Ltd).
Laffan, B. (1997), The Finances of the European Union, The European Union Series, MacMillan Press Ltd, London.
Münch W. (1998), Effects of CEC-EU Accession on Agricultural Markets in the CEC and on Government Expenditure, Agricultural Implications of CEEC Accession to the EU, Draft Final Results, Institute of Agricultural Economics, University of Göttingen.
Sharpf, F. W. (1988), ‘The joint decision trap: lessons from German federalism and European integration’. Public Administration, Vol.66, No.3, pp.239-78.
Webber, D. (1998), 'The Hard Core: The Franco-German relationship and Agricultural Crisis politics in the European Union', Working paper, European University Institute, Florence (RSC No. 98/46).
________________________Jorge Núñez Ferrer and Michael Emerson__________________________
27
[image:31.595.83.533.136.423.2]Annex A. Possible effects of German proposals to EU net balances
Table A.1 Possible effects of original German proposals to EU net balances - own estimates
Co-financing of CAP
Constrained general correction mechanism for A, D, NL, SW
No Cohesion Funds for E, P and Irl
Total shift from VAT to GNP key
Implementation of all measures
Belgium 122 -165 103 -110 3
Denmark -119 -107 67 -70 -194
Germany 625 3160 869 1143 4141
Greece -36 -78 -582 32 -638
Spain -151 -366 -1511 99 -1812
France -859 -936 585 84 -825
Ireland -269 -45 28 29 -243
Italy 405 -771 482 -805 -442
Luxembourg 10 -12 7 -3 6
Netherlands 190 672 155 71 923
Austria 8 -139 87 63 63
Portugal -36 -68 -587 52 -618
Finland -28 -80 50 -41 -72
Sweden 25 -150 94 3 19
Annex B. Actual and estimated expenditures and contributions
Table B.1.1 1997 own resources (at 1999 prices)
1997 TOR VAT GNP UK
correction
TOTAL
Belgium 1091 944 955 102 3092
Denmark 300 641 560 65 1567
Germany 3571 10414 7575 514 22074
Greece 170 575 433 48 1226
Spain 657 2680 2018 228 5584
France 1613 6536 4987 582 13719
Ireland 234 261 198 22 715
Italy 1166 3587 3814 450 9017
Luxembourg 23 86 62 7 178
Netherlands 1798 1749 1335 151 5033
Austria 265 1077 768 86 2196
Portugal 161 552 367 41 1121
Finland 150 488 419 47 1105
Sweden 378 1129 825 89 2420
UK 3167 5020 3660 -2558 9289
Total 14745 35739 27977 -126 78335
Table B.1.2 Expenditures 1997 (at 1999 prices)
Agriculture Structural Cohesion other internal
TOTAL
Belgium 1023 372 0 2819 4215
Denmark 1286 176 0 176 1638
Germany 6012 3783 0 894 10689
Greece 2841 2154 596 183 5774
Spain 4792 5575 1059 334 11760
France 9519 2560 0 828 12906
Ireland 2116 1040 221 123 3500
Italy 5296 3012 0 645 8953
Luxembourg 24 21 0 888 932
Netherlands 1828 438 0 398 2665
Austria 896 379 0 168 1443
Portugal 683 2521 539 209 3953
Finland 594 395 0 174 1163
Sweden 777 240 0 228 1245
UK 4577 2007 0 833 7417
Total EU (1) 42265 24673 2415 8901 78254
non EU 5435
Total 83689
________________________Jorge Núñez Ferrer and Michael Emerson__________________________
[image:33.595.86.509.107.377.2]29
Table B.2.1 Estimated own resources in the year 2006 for the Commission proposal (1999 prices)
TOR VAT GNP UK
correction
TOTAL
Belgium 1133 790 1757 202 3881
Denmark 290 516 1143 131 2081
Germany 3219 8080 14825 1703 27826
Greece 166 456 826 95 1542
Spain 705 2096 3898 448 7146
France 1547 5194 9973 1145 17860
Ireland 221 273 478 55 1027
Italy 1202 3402 8211 943 13758
Luxembourg 14 61 125 14 213
Netherlands 1589 1428 2648 304 5968
Austria 276 820 1479 170 2745
Portugal 166 425 729 84 1404
Finland 124 395 850 98 1467
Sweden 387 820 1595 183 2986
UK 2791 5619 9764 -5574 12600
Total 13829 30374 58301 0 102504
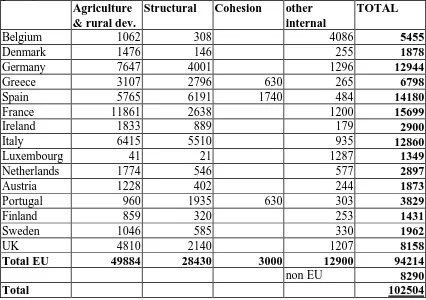
Table B.2.2 Estimated expenditures for the year 2006, Commission proposals (1999 prices)
Agriculture & rural dev.
Structural Cohesion other internal
TOTAL
Belgium 1062 308 4086 5455
Denmark 1476 146 255 1878
Germany 7647 4001 1296 12944
Greece 3107 2796 630 265 6798
Spain 5765 6191 1740 484 14180
France 11861 2638 1200 15699
Ireland 1833 889 179 2900
Italy 6415 5510 935 12860
Luxembourg 41 21 1287 1349
Netherlands 1774 546 577 2897
Austria 1228 402 244 1873
Portugal 960 1935 630 303 3829
Finland 859 320 253 1431
Sweden 1046 585 330 1962
UK 4810 2140 1207 8158
Total EU 49884 28430 3000 12900 94214
non EU 8290
[image:33.595.83.509.418.718.2]Table B.3.1 Estimated own resources for the year 2006, Berlin outcome (1999 prices)
TOR VAT GNP UK
Correction
TOTAL
Belgium 944 395 1992 240 3571
Denmark 242 258 1297 156 1953
Germany 2682 4040 16814 326 23863
Greece 138 228 937 113 1415
Spain 587 1048 4421 532 6588
France 1289 2597 11311 1361 16559
Ireland 184 137 542 65 928
Italy 1002 1701 9313 1121 13136
Luxembourg 12 30 141 17 200
Netherlands 1324 714 3003 58 5099
Austria 230 410 1677 33 2350
Portugal 138 213 827 100 1277
Finland 104 197 964 116 1381
Sweden 322 410 1810 35 2577
UK 2326 2810 11074 -4273 11937
Total 11524 15187 66123 0 92834
Table B.3.2 Estimated expenditures for the year 2006, Berlin outcome (1999 prices) Agriculture
& rural dev.
Structural Cohesion other internal
TOTAL
Belgium 1042 269,352 3579 4890,6
Denmark 1356 109,313 223 1688,3
Germany 6616 4084,24 1135 11835
Greece 2671 3026,75 527,1 232 6457,1
Spain 5128 6233,2 1455,8 424 13242
France 10922 2133,52 1051 14106
Ireland 1636 454,643 157 2247,4
Italy 5640 4122,3 819 10581
Luxembourg 34 11,703 1127 1173,4
Netherlands 1692 388,248 506 2585,4
Austria 1073 215,54 213 1501,8
Portugal 862 2747,78 527,1 266 4402,3
Finland 768 267,537 221 1256,5
Sweden 916 318,26 289 1523,8
UK 4318 2277,6 1058 7652,9
Total EU 44674 26660 2510 11300 85144
non EU 7690
[image:34.595.83.509.396.703.2]Annex C. Berlin outcome vs. original Agenda 2000
Table C.1 Changes in expenditures and receipts, Berlin budget compared with Commission proposals for 2006 TOR change VAT change GNP change UK rebate
change
Agriculture & rural
developmenta
Structural Funds
Cohesion funds
Total
Belgium 189 395 -236 -38 -20 -38 0 252
Denmark 48 258 -153 -25 -121 -37 0 -29
Germany 536 4040 -1989 1376 -1031 83 0 3016
Greece 28 228 -111 -18 -436 231 -103 -181
Spain 117 1048 -523 -84 -637 42 -284 -321
France 258 2597 -1338 -216 -939 -505 0 -143
Ireland 37 137 -64 -10 -196 -434 0 -532
Italy 200 1701 -1102 -178 -775 -1388 0 -1541
Luxembourg 2 30 -17 -3 -7 -10 0 -3
Netherlands 265 714 -355 246 -82 -158 0 629
Austria 46 410 -198 137 -155 -186 0 54
Portugal 28 213 -98 -16 -99 812 -103 737
Finland 21 197 -114 -18 -91 -53 0 -58
Sweden 64 410 -214 148 -130 -267 0 12
UK 465 2810 -1310 -1302 -493 137 0 308
Total 2305 15187 -7822 0 -5210 -1770 -490 2200b
a) Assumptions concerning the increase in the resources available for rural development and its distribution affect the outcome.
Annex D. Own resources and net balances after Berlin
Table D.1 Effect of changes in the own resources decision on net balances for the 2006 Berlin budget
TOR VAT GNP UK
Correction
TOTAL
Belgium 189 388 -527 -62 -13
Denmark 48 272 -343 -41 -64
Germany 536 4039 -4448 1168 1295
Greece 28 240 -248 -29 -10
Spain 117 1034 -1169 -138 -156
France 258 2596 -2992 -353 -492
Ireland 37 129 -143 -17 6
Italy 200 1689 -2464 -291 -865
Luxembourg 2 40 -37 -4 0
Netherlands 265 726 -794 209 405
Austria 46 415 -444 116 134
Portugal 28 201 -219 -26 -16
Finland 21 192 -255 -30 -72
Sweden 64 406 -479 126 118
UKa 465 2821 -2930 -627 -270
Total 2305 15187 -17492 0 0
________________________Jorge Núñez Ferrer and Michael Emerson__________________________
33
[image:37.595.82.415.155.699.2]Annex E. Relationship between net contributions per capita and GNP per capita
Table E.1. Relationship between net contributions per capita and GNP per capita,years 1997 and 2006
1997 GNP per capita
euro (‘000)
Net contributions per capita
Luxembourg 40012 1767
Denmark 29837 18
Austria 25222 -112
Germany 24950 -145
Sweden 24717 -139
Belgium 23812 175
France 23390 -31
Netherlands 23305 -82
UK 22815 -12
Finland 22801 0
Italy 19735 -10
Ireland 17768 796
Spain 13734 147
Greece 10786 427
Portugal 10221 282
2006 GNP per capita
euro (‘000)
Net contributions per capita
Luxembourg 45961 2351
Denmark 34273 -21
Austria 28972 -81
Germany 28660 -123
Sweden 28392 -94
Belgium 27352 152
France 26868 -19
Netherlands 26771 -139
UK 26207 -51
Finland 26192 -2
Italy 22670 -26
Ireland 20410 378
Spain 15776 182
Greece 12389 490
Portugal 11740 326
Annex F. Technical aspects and assumptions used in the calculations of net balances
The estimations on budget expenditures and own resources are the result of two models created by J. Núñez Ferrer. The first model estimates expenditures for agriculture. The second model estimates the expenditures for structural funds and uses the results from the agricultural model to estimate the total EU budget expenditure. The same model then calculates the contributions of each member state to the EU budget, following closely the own resources system as described by Commission (1998h).
The system used to calculate different scenarios and the final results following the decision in the Berlin European Council is as follows. A base scenario is constructed, which simulates the budgetary expenditures and the contributions of each member state in the hypothetical case that the Agenda 2000 proposals were accepted and implemented in full. All differences between this scenario and any other agreements in the Council, hypothetical or real, are simulated by changing the parameters in the models.
I. Base scenario
Agriculture
The agricultural model analyses the effects on the budget of changes in the CAP for cereals, oilseeds, beef and dairy, as these are the main items of reform. The proposals and the final decision of the Agenda 2000 reforms for Agriculture specify for each member state the number of hectares, heads of cattle and tons of milk, which will be eligible for direct payments. Together with the average regional base yields for oilseeds and cereals, the model calculates what the expenditure on direct payments would be, if the member states claim all their allocated limits.
Expenditures on other items are assumed to be equal to the 1997 figures Commission (1998i) for all remaining products (set at 1999 prices). For cereals and beef no export refunds or storage costs are included. As the national maximum allowed support claims have not been usually used in full, this partially counterbalances any excessive fund allocations by the model. For dairy, the difference between the Commission predictions (Commission, 1998a) and the calculations of the expenditure on direct payments for milk are assumed to be expenditures for other costs and export refunds. The difference is distributed among the member states according to their corresponding 1997 share in the expenditures.
Structural Funds
For the Agenda 2000 initial proposals, the structural funds model allocates the funds using the following criteria:
1. The structural funds budget line in the proposals has to be fully utilised in 2006.
2. It uses the expenditure on Structural funds for 1997 (at 1999 prices) as a base for estimation as follows.
________________________Jorge Núñez Ferrer and Michael Emerson__________________________
35
average EU GDP per capita have been removed from the areas eligible for Objective 1 support. The average yearly expenditure for these regions between 1995 and 1999 has been deduced from the 1997 expenditure. The funds have been redistributed among the member states according to the share of Objective 1 allocations in the member states, assuming that the global expenditure on Objective 1 does not fall. The expenditures on Objective 6 have been added to Objective 1.
• New Objective 2: Objectives 2 and 5b have been added together.
• New Objective 3: Objectives 3 and 5a have been added together
After these operations 4,5 billion euro were not allocated (excluding pre accession aid, which is treated as external expenditure). These funds have been redistributed among the member states according to their shares in total receipts under the structural funds.
Cohesion Funds
The 3 billion euro programmed in the financial framework for 2006 have been distributed as follows:
• No funds for Ireland.
• The distribution among the remaining 3 countries Greece, Portugal and Spain use 1997 shares as base. These were 18 per cent for Greece, 55 per cent for Spain and 18 per cent for Portugal. Assuming a similar distribution, their shares have been increased by 3% each to cover the exit of Ireland.
Own Resources
The methodology used follows the rules of the calculation of budget balances including the UK budgetary rebate as presented in Commission (1998h). The UK rebate has been calculated using few simplifications, but trying to stay as close to the actual mechanism as possible. The methodology is as follows:
• TOR and VAT are the same as estimated for 1999 by the Commission (1998h) throughout the simulations.
• The UK rebate is equal to 66% of its budgetary imbalance. This imbalance is calculated by multiplying the difference between the UK’s average of the sum of the percentage shares in VAT and GNP payments and its share in allocated expenditure times allocated expenditure. In the actual rebate only the share in VAT is used, using the old pre–1988 contributions system as a calculation tool and then deducing the UK advantage after the 1988 reforms, which have introduced GNP as a resource. The calculations in the present paper try to evade complications by using the average of the sum of shares in VAT and GNP contributions. The Commission (1998h) also does not use the UK advantage in their simulations to avoid unnecessary complications.
• The rebate used is for the net contributions of the year analysed. The actual two year time lag in the budgetary procedures is eliminated for mathematical simplicity.
Other costs