Int. J. Electrochem. Sci., 7 (2012) 6622 - 6637
International Journal of
ELECTROCHEMICAL
SCIENCE
www.electrochemsci.org
Antibacterial Cephalosporin as Inhibitors for the Corrosion of
Iron in Hydrochloric Acid Solutions
M. Abdallah1,3, I.Zaafarany1, J.H. Al-Fahemi1,Y.Abdallah2 and A.S. Fouda2 1
Department of Chemistry, Faculty of Applied Science, Umm Al-Qura University, Makkah Al Mukaramha, Saudi Arabia.
2
Department of Chemistry, Faculty of Science, El-Mansoura University, El Mansoura- EGYPT. 3
Previous address: Department of Chemistry, Faculty of Science, Benha University, Benha, EGYPT.
*
E-mail: metwally555@yahoo.com
Received: 15 June 2012 / Accepted: 2 July 2012 / Published: 1 August 2012
The inhibition efficiency of the antibacterial cephalosporin e.g. cefotaxime, cefalexin, cefradine and cefazolin toward the corrosion of iron in 1.0 M HCl was investigated using electrochemical techniques. The results of these techniques indicated that the inhibition efficiency increased with the concentration of inhibitor but decreased with temperature. Potentiodynamic studies proved that the inhibitors act as mixed mode of inhibition and the inhibitor molecules adsorb on the metal-solution interface. The adsorption of the inhibitors on iron surface obeys the Langmuir adsorption isotherm equation. All impedance spectra in EIS tests exhibit one capacitive loop which indicates that the corrosion reaction is controlled by charge transfer process. Inhibition efficiencies obtained from Tafel polarization, charge transfer resistance (Rct) is consistent.
Keywords: iron, antibacterial cephalosporin,inhibitors,adsorption
1. INTRODUCTION
phosphor,sulphur, nitrogen, oxygen or those containing multiple bonds which are considered as adsorption centers, are effective as corrosion inhibitors[2-10]
These investigated inhibitors are classified as the first generation of cephalosporin and were found to have good activity against gram-positive bacteria and relatively moderate activity against gram-negative microorganisms[11]. No data are recorded in the literature about the behavior of this investigated cephalosporin as inhibitors for metallic corrosion. Most of the data recorded in the literature were about the electro analytical behavior of this investigated cephalosporin. These inhibitors were selected as inhibitors because: They are nontoxic, relatively cheap, and easy to produce in purities with proportion of more than 99 % and they are rich in donating atoms such as -N, -O and –S atoms.
Continuation to our goal for searching for safe, ecofriendly and non-toxic corrosion inhibitors, this work aims to investigate the inhibitive action of cephalosporin (which is a safe compound) towards the corrosion of iron in 1.0MHCl using potentiodynamic and electrochemical impedance spectroscopy (EIS) techniques.
2. EXPERIMENTAL
2.1. Working electrode
An iron rod was served as working electrode. The bottom end of the rod specimen with a mean surface area 0.52 cm2 was polished with different emery papers up to 600 grades, degreased with acetone and finally washed with second distilled water.
2.2. Inhibitors
The following four cephalosporin antibiotics (cefotaxime, cefalexin, cefradine and cefazolin) were kindly provided from Misr Company for Pharmaceuticals and Chemical Industries, Egypt and were used as received without further purification. Their structures are presented in Table 1.
2.3. Solutions
Stock solutions (1000 ppm) of these inhibitors were prepared by dissolving the appropriate weight (1 gram) of each compound separately in bidistilled water in 100 ml measuring flask, then the required concentrations (10, 20, 30, 40,50 and 60 ppm) were prepared by dilution with doubly distilled water. The aggressive solutions (HCl) used were made of analytical reagent grade. Stock solution of the acid (5 M) was prepared using bidistilled water and this concentration was checked using standard solution of Na2CO3. From this stock concentrated solution, exactly 1 M HCl were prepared by dilution with bidistilled water, which was used throughout experiments for the preparation of solutions.
[image:3.596.74.522.207.760.2]
electrode (SCE) to which all potentials are referred. The SCE was connected to the main compartment via a Luggin capillary. The cell was water-jacketed and was connected to an ultra thermostat at 25 °C. The electrode potential was allowed to stabilize for 60 min before starting the measurements. For potentiodynamic polarization measurements the corrosion current density (jcorr) is determined, which is a measure of corrosion rate.
Table 1. Chemical structures, names and molecular weights of cephalosporin
Molecular Weight Name
Structure Inh.
347.39 Cefotaxime
(6R,7R,Z)-3-(acetoxymethyl)-7-(2-(2-aminothiazol-4-yl)- 2-(methoxyimino)acetamido)-8-oxo-5-thia-1-azabicyclo[4.2.0] oct-2-ene-2-carboxylic acid 1
454.51 Cefalexin
(6R,7R)-7-{[(2R)-2-amino-2-phenylacetyl]amino}- 3-methyl-
8-oxo-5-thia-1-azabicyclo[4.2.0]oct-ene- 2-carboxylic acid
2
455.47 Cefradine
(6R,7R)-7-{[(2R)-2-amino-2-(1-cyclohexa-1,4-
dienyl)acetyl]amino}-3-methyl-8-oxo-5-thia-
1-azabicyclo[4.2.0]oct-2-ene-2-carboxylic acid
3
349.41 Cefazolin
3-[(5-methyl-1,3,4-thiadiazol-2-yl)sulfanylmethyl]-
8-oxo-7-([2-(tetrazol-1-yl)acetyl]amino)- 5-thia-1-azabicyclo[4.2.0] oct-2-ene-2-carboxyla
Stern-Geary method [12] used for the determination of corrosion current is performed by extrapolation of anodic and cathodic Tafel lines. Then jcorr was used for calculation of inhibition efficiency and surface coverage (θ) as follows [13]:
% IE = [1 – (jcorr (inh)/ jcorr (free))] x 100 (1) θ = [1 – ( jcorr (inh)/ jcorr (free))] (2)
where, jcorr (free) and jcorr (inh) are the corrosion current densities in the absence and presence of inhibitor, respectively.
The potentiodynamic current-potential curves were recorded by changing the electrode potential automatically from -500 to 500 mV with scanning rate 5mVs-1.All measurements were conduced using an electrochemical measurement system (Volta Lab 21) comprised of a PGZ 100 potentiostat , a PC and Voltamaster 4 version 7.08 software for calculations. All the experiments were carried out at 25 ± 1 °
C by using ultracirculating thermostat and solutions were not deaerated to make the conditions identcial to weight loss measurements. The procedure adopted for the polarization measurements was the same as described elsewhere[14]. Each polarization was run three times and corrosion potentials and corrosion currents were reproducible within ± 5 mV and ± 1 µA cm-2
respectively. The AC impedance measurements were carried out in the frequency range 105 – 5 x 10⁻¹ Hz with amplitude 10 mV peak-to-peak using ac signals at the open potential circuit. All measurements were performed using potentiostat/galvanostat Gamry PCI 300/4 connected to computer. A corrosion software model EIS 300 was employed. The experimental impedance were analyzed and interpreted on the basis of the equivalent circuit.
3. RESULTS AND DISCUSSION
3.1. Potentiodynamic polarization measurements
Figure 1 represents the potentiodynamic polarization curves for iron in 1 M HCl with and without the addition of compound 4 as an example of the studied compounds. Similar curves were obtained for other three compounds (not shown) .The corrosion kinetic parameters such as corrosion current density (jcorr.), corrosion potential (Ecorr.), and Tafel slopes a and c of different inhibitors derived from these Figures are given in Table (2). In all investigated compounds the inhibition efficiencies increase with increasing the concentration of these compounds. Addition of all molecules shifts the corrosion potential slightly in the positive direction without an appreciable change in a and
c values. This suggests that the added compounds do not change the mechanism of iron dissolution and hydrogen evolution reactions and the inhibitors decrease both reactions by surface coverage. The polarization resistance (Table 2) values showed an increase in the presence of inhibitors and also increases with increasing the concentration.
-6 -5 -4 -3 -2 -1 0
-1.0 -0.8 -0.6 -0.4 -0.2 0.0 1M HCl 10 ppm 20 ppm 30 ppm 40 ppm 50 ppm 60 ppm po ten tia l,(V ) v s. ref .
[image:5.596.166.414.84.294.2]log i, A/cm2
Figure 1. Potentiodynamic polarization curves for iron in 1.0 M HCl in the absence and presence of different concentrations of inhibitor (4) at 25 oC.
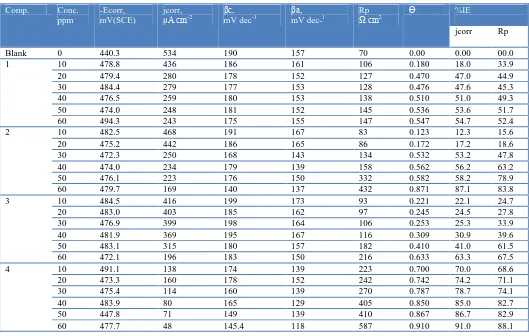
Table 2. The effect of concentration of compounds (1-4) on the free corrosion potential (Ecorr), corrosion current density (jcorr), Tafel slopes (βa, βc), polarization resistance (Rp) degree of surface coverage (θ) and the inhibition efficiency (℅ IE),) for the corrosion of iron in 1 M HCl at 25 oC.
Comp. Conc. ppm
-Ecorr, mV(SCE)
jcorr, μA cm-2
βc, mV dec-1
βa, mV dec-1
Rp Ω cm2
Ө %IE
jcorr Rp
Blank 0 440.3 534 190 157 70 0.00 0.00 00.0
1 10 478.8 436 186 161 106 0.180 18.0 33.9
20 479.4 280 178 152 127 0.470 47.0 44.9
30 484.4 279 177 153 128 0.476 47.6 45.3
40 476.5 259 180 153 138 0.510 51.0 49.3
50 474.0 248 181 152 145 0.536 53.6 51.7
60 494.3 243 175 155 147 0.547 54.7 52.4
2 10 482.5 468 191 167 83 0.123 12.3 15.6
20 475.2 442 186 165 86 0.172 17.2 18.6
30 472.3 250 168 143 134 0.532 53.2 47.8
40 474.0 234 179 139 158 0.562 56.2 63.2
50 476.1 223 176 150 332 0.582 58.2 78.9
60 479.7 169 140 137 432 0.871 87.1 83.8
3 10 484.5 416 199 173 93 0.221 22.1 24.7
20 483.0 403 185 162 97 0.245 24.5 27.8
30 476.9 399 198 164 106 0.253 25.3 33.9
40 481.9 369 195 167 116 0.309 30.9 39.6
50 483.1 315 180 157 182 0.410 41.0 61.5
60 472.1 196 183 150 216 0.633 63.3 67.5
4 10 491.1 138 174 139 223 0.700 70.0 68.6
20 473.3 160 178 152 242 0.742 74.2 71.1
30 475.4 114 160 139 270 0.787 78.7 74.1
40 483.9 80 165 129 405 0.850 85.0 82.7
50 447.8 71 149 139 410 0.867 86.7 82.9
[image:5.596.34.563.428.764.2]
0.0001 0.0002 0.0003 0.0004 0.0005 0.0006 0.0007 0.0002
0.0004 0.0006 0.0008 0.0010 0.0012 0.0014
R2=0.999
R2=0.998
R2=0.970
R2=0.997
(1) (2) (3) (4)
C/
C, M
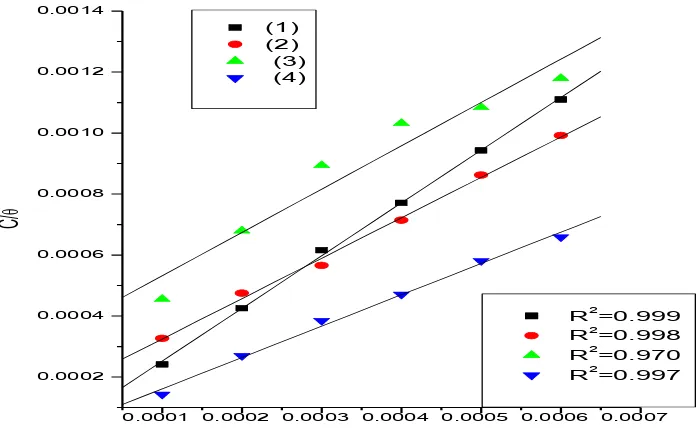
3.2. Adsorption isotherm
The establishment of adsorption isotherms describes the adsorptive behavior of inhibitor molecules which can provide important ideas to the nature of the metal inhibitor interaction. Adsorption of the organic molecules occurs as the interaction energy between molecule and the metal surface is higher than that between the water molecules and surface [15]. Basic information dealing with the interaction between the inhibitor molecule and metal surface can be provided by adsorption isotherm [16]. In order to find out the adsorption isotherm, attempts were made to fit various isotherms viz., Frumkin, Langmuir and Temkin. However, the best fit was obtained only with Langmuir adsorption isotherm (equation 3) where C/θ was plotted against concentration (C) which resulted with straight lines with slope equal to unity (Fig. 2). The equilibrium constant of the adsorption process, , which is related to the standard free energy of adsorption (Δ Go ads) by [17,18].
C/Ө = 1/β + C (3) β= (1/55.5) exp [-ΔGo
ads / RT] (4)
[image:6.596.97.447.428.642.2]where ,R is the universal gas constant and T is the absolute temperature, C is the inhibitor concentration and β is the equilibrium constant of adsorption.
Figure 2. Langmuir adsorption isotherm plotted as (C/Ө) versus C of compounds (1-4) for corrosion of iron in 1 M HCl solution at 25 oC.
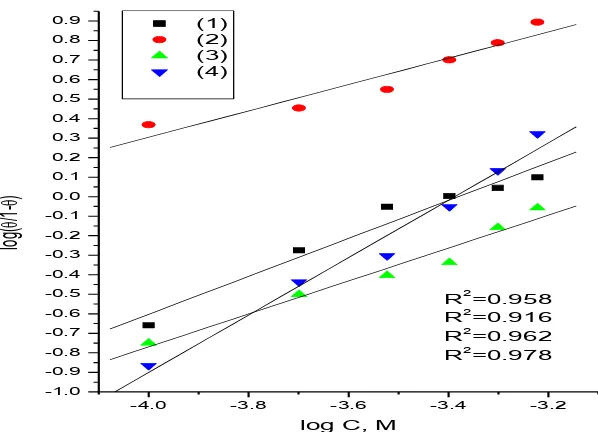
log (Ө/1-Ө) = log K\
+ Y log C (5)
is agree to operate the present adsorption data. β= βo (1/y), βo is constant, and 1/y is the number of the surface active sites occupied by one inhibitor molecule.
The values of G°ads were calculated and are listed in Table 3, It is clear that the value of G°ads decreases in the following order: 4 > 2 > 3 > 1 which is parallel to inhibition efficiency. The negative values of G°ads obtained here indicate that the adsorption process of these compounds on the iron surface is spontaneous one. The higher values of β suggested strong interaction of the inhibitors and the iron surface [20]. The increasing of β (4 > 2 > 3 > 1) reflects the increasing adsorption capability, due to structural formation on the metal surface.
-4.0 -3.8 -3.6 -3.4 -3.2
-1.0 -0.9 -0.8 -0.7 -0.6 -0.5 -0.4 -0.3 -0.2 -0.1 0.0 0.1 0.2 0.3 0.4 0.5 0.6 0.7 0.8 0.9 log ( /1- ) (1) (2) (3) (4)
log C, M
R2=0.958
[image:7.596.131.430.284.500.2]R2 =0.916 R2 =0.962 R2 =0.978
Figure 3. El-Awady et al. model plotted as log(Ө/1-Ө) versus log C of compounds (1-4) for corrosion of iron in 1 M HCl solution at 25 oC.
Table 3. Number of active sites (1/Y), Slopes of Longmuir isotherm lines, equilibrium constant of the adsorption reaction (K) and free energy of adsorption (ΔGoads) of inhibitors (1-4) on iron surface in 1 M HCl at 25 oC.
Inhibitor Kinetic Model Langmuir isotherm
1/Y log K -ΔGoads
k J mol-1
K L mol-1
-ΔGoads kJ mol-1
1 1.190 0.41 24.8 257.1 23.7
2 1.031 0.52 28.7 1261.0 27.6
3 1.492 0.48 27.1 718.2 25.5
[image:7.596.47.551.628.774.2]
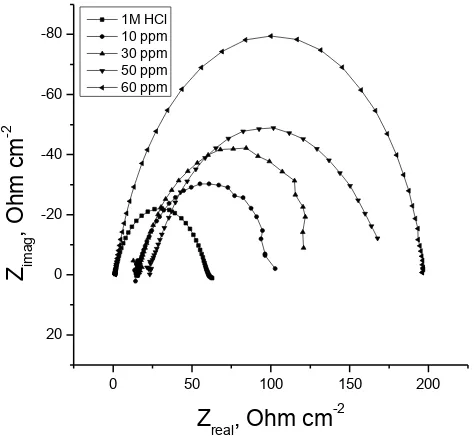
3.3. Electrochemical impedance spectroscopy (EIS)
The corrosion behavior of iron in 1 M HClsolution in the absence and presence of different concentrations of compound 1 is investigated by the EIS method at Ecorr at 25 oC after 30 min of immersion. The charge transfer resistance Rct values were calculated from the difference in impedance at lower and higher frequencies from Nyquist plot (Fig. 4). Using Rct ,values of capacitance double layer values ( Cdl) were computed from the Bode plot (Figs.5) by using the following equation:
Cdl = 1/ 2π fmax Rct (6)
where, fmax is the frequency at which the imaginary component of the impedance (-Zmax) is maximal . Similar curves were obtained for other compounds used (not shown) and the impedance parameters derived from investigations are given in Table 4. It is worth noting that the presence of inhibitor does not alter the profile of impedance diagrams which are almost semi-circle, indicating that a charge transfer process mainly controls the corrosion of iron. Deviations of perfect circular shape are often preferred to the frequency dispersion of interfacial impedance. This anomalous phenomenon is interpreted by the in homogeneity of the electrode surface arising from surface roughness or interfacial phenomena [21,22]. In fact, the presence of investigated inhibitors enhances the values of Rct in the acidic solution. Values of double layer capacitance decreased in the presence of inhibitors revealing the adsorption of the inhibitor on the metal surface in the acidic solution.
0 50 100 150 200
20 0 -20 -40 -60
-80 1M HCl 10 ppm
30 ppm 50 ppm 60 ppm
Z im
a
g
, Ohm cm
-2
Zreal, Ohm cm-2
Figure 4. The Nyquist plots for iron in 1 M HCl solution in the absence and presence of different concentrations of compound (1) at 25 oC.
[image:8.596.146.383.431.649.2]
%IE = [1- (Roct/Rct)] x 100 (7) Θ = [1- (Ro
ct/Rct)] (8)
where, Roct and Rct are the charge transfer resistance in the absence and presence of inhibitor, respectively.
The %IE obtained from EIS measurements are close to those deduced from polarization. The order of inhibition efficiency obtained from EIS measurements is as follows: 4 > 2 > 3 > 1.
0 1 2 3 4
0.0 0.2 0.4 0.6 0.8 1.0 1.2 1.4 1.6 1.8 2.0 2.2 2.4 0 -10 -20 -30 -40 -50 -60 -70 P ha se a ng le Lo g Z m od Log freq. 0 M 10 ppm 30 ppm 50 ppm 60 ppm
Figure 5. The Bode plots for corrosion of iron in 1 M HCl in the absence and presence of different concentrations of compound (1) a
Table 4. Electrochemical kinetic parameters obtained by EIS technique for corrosion of iron in 1 M HCl at different concentration of compounds (1-4) at 25 oC.
Comp. Conc., ppm
Cdl µFcm-2
Rct ohm
θ IE%
Blank 0.0 86.2 52.7 0.0 0.0
1 10 81.7 71.4 0.262 26.2
30 73.6 97.9 0.462 46.2
50 58.7 114.5 0.540 54.0
60 59.9 178.1 0.704 70.4
2 10 75.6 76.6 0.312 31.2
30 51.0 111.9 0.529 52.9
50 39.8 168.5 0.687 68.7
60 33.2 219.1 0.760 76.0
3 10 73.3 85.0 0.380 38.0
30 61.8 124.1 0.575 57.5
50 41.1 165.6 0.682 68.2
60 39.78 228.1 0.769 76.9
4 10 69.4 84.4 0.376 37.6
30 34.77 123.9 0.575 57.5
50 37.5 175.4 0.700 70.0
[image:9.596.172.441.230.425.2] [image:9.596.46.555.529.764.2]
3.4 Theoretical study of cephalosporin derivatives and their potential activity as corrosion inhibitors.
Quantum-chemical calculations have been widely used to study reaction mechanism and to interpret the experimental results as well as to resolve chemical ambiguities. They have also proved to be a very important tool for studying corrosion inhibition mechanism [23-26]. In recent times, Density Functional Theory (DFT) has become an attractive theoretical method because it gives exact basic vital parameters for even huge complex molecules at low lost. Furthermore, by using sophisticated computational tools, we can understand reactivity behavior of hard and soft acid-base (HSAB) theory that provide a systematic way for the analysis of the inhibitor / surface interaction [27]. Thus, the DFT has become a main source of connecting some traditional empirical concepts with quantum mechanics. Therefore, DFT is a very powerful technique to probe the inhibitor/ surface interaction and to analyze experimental data.
The effectiveness of an inhibitor can be related to its spatial molecular structure, as well as with their molecular electronic structure [28]. Also, there are certain quantum chemical parameters that can be related to the interactions metal-inhibitor. Among these, we can mention the energy of the HOMO that is often associated with the capacity of a molecule to donate electron so therefore, an increase in the value of EHOMO can facilitate the adsorption and therefore the inhibition efficiency, by indicating the disposition of the molecule to donate orbital electrons to an appropriate acceptor with empty molecular orbital. In the same way low values of energy gap ΔE= ELUMO-EHOMO will render good inhibition efficiencies, because the energy needed to remove an electron from the last occupied orbital will be low [29]. Similarly low values of the dipole moment µ will favor us the accumulation of inhibitor molecules on metallic surface [30].
Over the past decades the semi empirical molecular orbital (MO) methods have been used widely in computational studies. In practice, these methods serve as efficient computational tools which can yield fast quantitative estimates for a number of properties.
In this study, the optimized geometries of molecules are shown in Fig (6) from PM3 electronic energy point of view.The Mulliken charge densities of investigated compounds have been calculated together with some physical characters like the EHOMO, ELUMO, ΔE=ELUMO-EHOMO and dipole moment (µ) (Table 5). The results seem to indicate that both the value of the gap energy ΔE (energy required to move an electron from HOMO to LUMO), as well as the value obtained for the dipole moment µ, favor compound (4), implying its effectiveness as a corrosion inhibitor. . Low ΔE facilities adsorption [31-33] of the molecule and thus will cause higher inhibition efficiency.
The use of Mulliken population analysis to probe the adsorption centers of inhibitors have been widely reported [34-36]. There is a general consensus by several authors that the more negatively charged heteroatom is the more it can be adsorbed on the metal surface through donor acceptor type reaction. It has also been reported that electrophiles attack molecules at sites of negative charge [37], which means that sites of ionic reactivity can be estimated from the atomic charges in the molecule.
The bond gap energy ΔE increases from (1 to 4). This fact explains the decreasing inhibition efficiency in this order (4>2>3>1), as shown in Table (5) and Figs. (6&7) show the optimized structures of the four investigated compounds. So, the calculated energy gaps show reasonably good correlation with the efficiency of corrosion inhibition. Table (5) also indicates that compound (4) possesses negative EHOMO that means that compound (4) adsorption occurs easily and is favored by the highest softness. The HOMO and LUMO electronic density distributions of these molecules were plotted in Fig (7). For the HOMO of the studied compounds that the benzene rings, N-atoms and O-atom have a large electron density. The data presented in Table (5) show that the calculated dipole moment decreases in the following order: (4>2>3>1)
Structure Charge density distribution
(1)
(2)
(4)
Figure 6. Optimized molecular structure of cephalosporines compounds, and the charge density distribution
LUMO HOMO
(1)
(2)
[image:12.596.54.547.70.205.2][image:13.596.65.536.70.222.2]
(4)
Figure 7. HOMO and LUMO structure of cephalosporin compounds.
3.5. Mechanism of corrosion inhibition
Corrosion inhibition of iron in acid chloride solution by the investigated cephalosporines drugs as indicated from potentiodynamic polarization and ac impedance was found to depend on the concentration and the nature of the inhibitor.
It is generally, assumed that adsorption of the inhibitor at the metal/solution interface is the first step in the action mechanism of the inhibitors[38-41] in aggressive acid media. In fact, the solvent molecules could also adsorb at metal/solution interface. So, the adsorption of organic inhibitor molecules from the aqueous solution can be regarded as a quasi-substitution process between the organic compounds in the aqueous phase (org(sol)) and water molecules at the electrode surface (H2Oads) [42].
Org (sol) + x H2O (ads) Org (ads) + x H2O (sol)
where, X is the size ratio, that is, the number of water molecules replaced by one organic inhibitor. The transition of metal/solution interface from a state of active dissolution to the passive state is attributed to the adsorption of the inhibitor molecules at the metal/solution interface, forming a protective film. The rate of adsorption is usually rapid and hence, the reactive metal surface is shielded from the aggressive environment [43].
surface and an aromatic molecule depends on the relative coordinating strength towards the given metal of the particular groups present[44].
In general, owing to the complex nature of adsorption and inhibition of a given inhibitor, it is impossible for single adsorption mode between inhibitor and metal surface.
The adsorption of these drugs can be attributed to the presence of polar N atoms and aromatic/heterocyclic rings. therefore, the possible reaction centers are unshared electron pair of hetero-atoms and π- electrons of aromatic ring.The adsorption and inhibition effect of investigated compounds in 1 M HCl solution can be explained as follows; drug molecules might be protonated in the acid solution as:
[C16H17N5O7S2] + x H+ → [C16H17+XN5O7S2] x+ [C16H17N3O4S] + n H+ → [C16H17+nN3O4S] n+ [C16H19N3O4S] + y H+ → [C16H19+yN3O4S] y+ [C14H13N8O4S3] + z H+ → [C14H13+zN8O4S3] z+
In aqueous acidic solutions, these drugs exist either as neutral molecules or as protonated molecules (cations).Four types of adsorption may take place during inhibition involving organic molecules at the metal/solution interface[45-47]:
(1) Electrostatic attraction between charged molecules and the charged metal. (2) Interaction between unshared electron pairs and the metal.
(3) Interaction of π-electrons with the metal.
A combination of the above [48]. Concerning inhibitors, the inhibition efficiency depends on several factors; such as the number of adsorption sites and their charge density, molecular size, heat of hydrogenation, mode of interaction with the metal surface and the formation of metallic complexes [49].
4. CONCLUSIONS
Antibacterial cephalosporin is found to be good inhibitors for iron corrosion in 1 M HCl. The inhibition is accomplished by adsorption of cephalosporin molecules on to the iron electrode surface without changing the mechanism of partial corrosion reactions. Adsorption of these compounds follows Langmuir adsorption isotherm. In 1 M HCl these antibacterial cephalosporins act as mixed-type inhibitors. EIS measurements indicate the single charge transfer process controlling the corrosion of iron. The order of the inhibitive effect has been found to be: 4 > 2 > 3 > 1.
References
1. G. Schmitt, Br. Corr. J., 19 (1984) 165.
2. A.Doner,R.Solmaz,M.Ozcan and G.Kardas,Corros.Sci 53(2011)2902. 3.
M.Abdallah , Basim H. Asghara,I.Zaafarany and A.S.Fouda, Int.J.Electrochem Sci.7(1) (2012)282 . 4. M. Abdallah.Sh.T.Atwa ,N M.Abdallah, I.M.El-Naggar and A.S . Fouda, Anti Corrosion Methods
and Materials,58(1), (2011) 31
5. S.M.A.Hosseini,M.Salari,E.Jamalizadeh,S.Khezripoor and M.Seifi, Mater.Chem and Phys.119(2010)100.
6. M. Abdallah.H.E Megahed and M.S.Motae, Mater.Chem and Phys,118, (2009)111 7. M. Abdallah., E.A. Helal and A.S. Fouda, Corros. Sci., 48 (2006)1639.
8. X.Li,S.Deng and H.Fu, Corros. Sci.,53(2011)3241. 9. K.S.Jacob, G.Parameswaran, Corros. Sci.,52(2010)224.
10.M. Abdallah.,,I.Zaafarany, K.S.Khairouand M.Sobhi, Int.J.Electrochem Soc., 7(2)1564-1579 (2012)
11.G.Subramanian, K.Balasubramanian and P.Sridhar, Corros.Sci., 30 (1990)1019. 12.M. Stern and A.I.J. Geary, J. Electrochem. Soc., 104 (1957) 56.
13.F.Bentiss, C.Jama, B.Mernari, H.El Attari, L.El Kadi, M.Lebrini, M.Traisnel and M.Lagrenee, Corros.Sci., 51 (2009) 1628.
14.F.Bentiss, M.Lagrenee, M.Traisnel and J.C.Hornez, Corros.Sci., 41(1999)789 15.E.McCafferty, in: Leidheiser, Jr.(Ed), (1979) 279.
16.F.Bentis,M.Traisnel, N.Chaibi, B.Mernari, H.Vezin andM.Lagrenee, Corros.Sci., 44(2002) 2271. 17.M.Kliskic, J. Radosevic and S. Gridic; J. Appl. Electrochem., 27 (1997) 947
18.A. M. S. Abdel and A. El- Saied; Trans. Soc. Adv. Electrochem. Sci. Technol., 16(1981)197. 19.Y.A.,El-Awady and A.I. Ahmed, J. Ind. Chem., 24A (1985) 601.
20.E.E. Oguzie, Corros. Sci. ,49 (2007) 1527.
21.S.L.F.A.DA Costa and S.M.L.Agostinho, Corros. Sci., 45(1989)472. 22.H.Shih and H.Mansfeld,Corros.Sci., 29 (1989)2271.
23.J. Bessone, C. Mayer, K. Tuttner, W. J. Lorenz; Electrochim. Acta, 28 (1983) 171. 24.F. Bentiss, M. Traisnel and M. Lagrenee, Corros. Sci., 42 (2000) 127.
25.M. G. Hosseini, Electrochim. Acta, 52 (2007) 3650.
26.I. B. Obot and N. O. Obi-Egbedi, Colloids and Surface A: Physicochem. Eng. Aspects, 330 (2008) 207.
27.I. B. Obot and N. O. Obi-Egbedi, Surf. Rev. Lett, 15(6) (2008) 903.
28.28 .I. B. Obot, N. O. Obi-Egbedi and S. A. Umoren, Corros. Sci., 51 (2009) 276. 29.J. Cruz, T. Pandiyan and E. Garcia-Ochoa, J. Electroanal . Chem., 583 (2005) 8.
30.H. Ashassi-Sorkhabi, B. Shaabani and D. Seifzadeh, Electrochim. Acta, 50 (2005) 3446. 31.N. Khalil, Electrochim. Acta, 48 (2003) 2635.
33.N. K. Allam, Appl. Surf. Sci., 253 (2007) 4570.
34.F. Kandemirli and S. Sagdina, Corros. Sci., 49 (2007) 2118.
35.G. Bereket, C. Ogretic and C. Ozsahim, J. Mol. Struct., (THEOCHEM), 663 (2003) 39. 36.M. Ozcan, I. Dehri and M. Erbil. Appl. Surf. Sci., 236 (2004) 155.
37.D. Wang, S. Li, Y. Ying, M. Wang, H. Xiao and Z. Chem, Corros. Sci., 41 (1999) 1911. 38.M. H. Kelestemur and T.K. Chaki, International Journal of fatigue 23 (2001) 169. 39.39 .L.W. Tsay, M.C. Young, C. Chen, Corros. Sci. 45 (2003) 1985.
40.L.W. Tsay, Y.C. Liu, M.C. Young, D. Y. Lin, Mater. Sci. Eng. A 374 (2004) 204. 41.L.W. Tsay, M.C. Young, F.Y. Chou, R.K. Shiue, Mater. Chem. Phys.88 (2004) 348. 42.M.Sahin, S.Bilgic and H.Yilmaz, Appl. Surf. Sci., 195(2002)1.
43.C.Y.Cho, L.F.Lin and D.D.Macdonald, J.Electrochem. Soc.,128(1981)1187) 44.I.M. Ritchie, S. Bailey and R. Woods, Adv. Colloid interface Sci., 80(1999) 183 45.Gihan I. Youssef, M.SC. thesis Cairo Univ., Egypt (1992).
46.P. W. Athins, Physical Chemistry, Oxford University Press, Oxford, 5th ed., (1994), p. 922. 47.B.B. Damaskin, O.A. Petrij and V.V. Batrakov, Adsorption of Organic Compounds on Electrodes
Plenum Press, New York, 86 (1971).
48.D.Schweinsberg, G.George, A.Nanayakkara and D.Steinert, Corros. Sci., 28(1988) 33. 49.A.S.Fouda, M.N. Moussa, F.I. Taha and A.I.El-Neanaa, Corros. Sci., 26(1986) 719. 50.G.N.Mu, T.P. Zhao, M.Liu and T.Gu, Corros., 52(1996) 853.