Rochester Institute of Technology
RIT Scholar Works
Theses
Thesis/Dissertation Collections
11-1-1998
Study of microwave annealing effects on polymer
crystallization
Junmei Ji
Follow this and additional works at:
http://scholarworks.rit.edu/theses
This Thesis is brought to you for free and open access by the Thesis/Dissertation Collections at RIT Scholar Works. It has been accepted for inclusion in Theses by an authorized administrator of RIT Scholar Works. For more information, please [email protected].
Recommended Citation
Study of Microwave Annealing Effects on
Polymer Crystallization
Junmei Ji
November, 1998
Thesis
Submitted in partial fulfillment of the requirements for the degree
of Master of Science in Chemistry
Approved:
Andreas Langner
Project Advisor
Gerald Takacs
Department Head
Study
ofMicrowave
Annealing
Effects
onPolymer Crystallization
I,Junmei
Ji,
hereby
grant permissionto theWallace MemorialLibrary,
ofR.I.T.,
toreproducemythesisinwhole orinpart.
Any
reproduction will notbe forcommercial useorprofit.
Acknowledgements
Iwouldliketothankmyadvisor, Dr. Andreas
Langner,
forhisadvice andsupport. His extensive knowledge and creative ideas made it possible to initiate this
thesis. His effective guidance and
help
taughtmehowto becomeagoodresearcher andexperimentalist. Hishumorgaveme alotoffun
during
mystudies.Ialsowouldliketo thankmygraduatecommittee,Dr. Gerald
Takacs,
Dr.Joseph
Homak,
andDr. MassoudMM,
forall theirhelp
and support. I have benefitedfrom their suggestions and questions. I would like to extend my thanks to Ms. Ruth
Willerthfor her
help
inthe constructionoftheexperimental set-up.Nowordsare enoughtoexpressmythanks tomyparents.Withouttheir
understandingand support, Iwould neverhave finishedthisthesis. I alsowould liketo
Abstract
Inthis project, theeffect of melt annealing onthe crystallization ofpoly(ethylene
oxide),
(PEO),
was studiedby
comparingthermal annealing to microwave annealing. After thesubsequent controlledcrystallization, thecrystallinemorphologyoffilmswascharacterized
by Polarizing
LightMicroscopy
(PLM);
themelting curvesfor both films and bulk samples were measuredby
DifferentialScanning Calorimetry
(DSC). Thesemeasurements revealed significant differences between microwave and
thermally
annealed samples. We propose thatmicrowave annealing has a "quantum on polymercrystallization. The difference in morphologycannotbe explainedby
a change inthetemperatureprofile ofthe two annealingmethods.By
investigating
thedifference betweenmicrowaveannealingandthermalannealing, while changing the crystallizationtemperature, we found that microwave
absorption could change the polymer chain conformation more efficiently. The application of microwaves accelerates the dipolemoment oscillation thus speeding up
rotation of polymer chain segments. In this way, microwave annealing could
destroy
the residual nuclei leftfroma prior crystallinemorphology,decreasing
the nucleationsite density.
Consequently,
homogeneous nucleation becomes more important inthe case of microwave annealing, and the morphology and melting behavior of thecrystalline phase are both changed. As molecular weight ofPEO was
increased,
themicrowave effect became more evident. Some factors in the crystallization process
whichmay mask the microwave effects are the surface area ofthe film samples, the
coolingrate andthe crystallizationtemperature.
Itisbelievedthatmicrowave annealinghaspotentialtoproducenewcrystalline
Table
ofContents
Chapter 1: Introduction 1
Chapter 2: Background 3
2.1
Morphology
ofCrystalline Polymers 32.2 NucleationandGrowth StepsofCrystallization 6
2.3 Homogeneous andHeterogeneous Nucleation 7
2.4
Melting
BehaviorofCrystalline Polymers 82.5 Microwave
Processing
ofPolymers 1 1Chapter3: Experimental 16
3.1 Polyethylene oxide) Samples 16
3.2 Experimental
Set-up
for MicrowaveAnnealing
173.3
Morphology
Characterizationby
PLM 183.4Investigationof
Melting
BehaviorofCrystalline Polymersby
DSC 18Chapter 4: ResultsandDiscussions 21
4.1 Microwave EffectsonPEO Crystallization 21
4.2 The MechanismsoftheMicrowaveEffects 24
4.2.1 DependenceofMicrowaveeffects onCrystallization Temperature 25
4.2.2 Dependenceof
Melting
BehavioronPEO Molecular Weight 42Chapter 5: Conclusions 47
List
ofFigures
IV
Figure 1: Theoreticalplot ofTm*versusTcforindicatedchainlength
oflinearpolyethylene 10
Figure 2: Typicalvariationindielectric constantanddielectric losswith
frequency
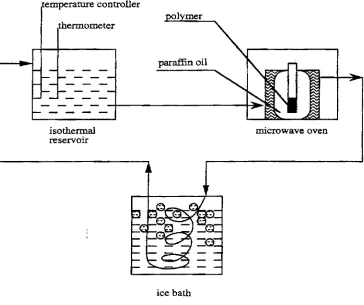
forpolymers 13Figure 3: Experimental set-up formicrowaveannealing 19
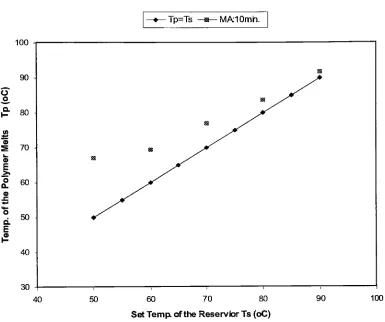
Figure4: The calibrationtemperatureofthepolymer meltsvs. setting
temperature ofthereservoir 20
Figure 5:
Morphology
of crystallinePEO,
crystallizedat25C
inair aftera)thermalannealing, andsuccessively
b)
microwaveannealing 22Figure6:
Morphology
of crystallinePEO,
crystallizedat25C
inair aftera)microwaveannealing, andsuccessively
b)
thermal annealing 23Figure 7:
Morphology
of crystallinePEO,
crystallized at-44C
ondry
iceaftera)microwaveannealing,
b)
thermalannealing 28Figure 8:
Morphology
of crystallinePEO,
crystallized 1 hrat55C,
after
(a)
microwave annealing,(b)
thermalannealing 29Figure 9:
Morphology
of crystallinePEO,
crystallized 15hr at55C,
aftera)microwaveannealing,
b)
thermalannealing 31Figure 10: DSCthermogramsofthefilm samples afterdifferentannealing
treatments 33
Figure 1 1: DSCthermogramsofthebulksamples afterdifferentannealing
Figure 12:
Morphology
ofcrystallinePEO,
crystallized at0C,
aftera)microwave annealing,
b)
thermalannealing 37Figure 13:
Morphology
of crystallinePEO,
crystallizedat40C,
aftera)microwaveannealing,
b)
thermalannealing 39Figure 14: DSCthermograms ofthebulkandfilmsamplescrystallized
at^4C 40
Figure 15: DSCthermograms ofthebulkandfilmsamples crystallized
atOC 41
Figure 16:
Morphology
ofcrystallinePEO (Mn:2000g/mol), crystallizedat25
C
inair, aftera)microwaveannealing;b)
thermalannealing 44Figure 17:
Morphology
of crystallinePEO (Mn:400,000 g/mol),crystallized atVI
List
ofTables
Table 1: Comparison of microwave andthermal
heating
characteristics 12Table 2: Samplecharacteristics of poly(ethyleneoxide) 16
Table3: Comparisonofmelting behaviors for filmsamples 26
Chapter
1 Introduction
Crystallinepolymersrepresenta class of materialsthat, insolidstate, can
develop
complex morphologies for which ordered structures occur over a wide range of
dimensions.
Moreover,
these ordered crystallites are oftenintimately
mixed withamorphousdomainsproducinga composite structure. Avarietyof microstructures ofthis
kindprovide a goodpossibilitytodesignthe crystalline polymeric materials withunique
properties.
Therefore,
it is ofimportancetounderstandpolymercrystallizationto achievebetterprocess control and obtaindesiredproperties.
Animportant issue inthestudyof polymer crystallizationis theannealing behavior
of polymeric materials below and above their melt temperatures. In this work,
"annealing"
refers to
heating
thepolymer aboveitsmelttemperature. In a previous studyabout the crystallization kinetics of poly(ethylene oxide),
(PEO),
a model had beenproposedtosimulate the exothermicbehaviorofits crystallization(1). Themodelfitthe
experimental datawell for lowmolecularweight polymers, butnot for high molecular
weight polymers. One explanation for this disagreement was the memory effect of
previous morphology on subsequent recrystallization. When crystalline polymers melt,
polymerchains can
locally
break thebonds.However,
itwilltakemore timeandenergyfor longer polymer chains to move around in a
highly
viscous melt. As a result, somepartiallyordered regions still exist after melting. The chains intheseregions can rapidly
revertback toform bondswhenthe crystallization occurs uponcooling. Becauseofthis,
crystallization events. Conventional thermalannealingofpolymer melts to eliminate this
local,
partialordering istedious andtime-consuming.Therefore,
inthisstudy, weattemptto introduce microwave radiation to speedup annealing.
By
accelerating the rotation ofpolymerchains, it is expected thatmicrowave radiation willbe able to heat thepolymer
melt volumetrically and quickly,
leading
to rapiddisordering
ofits molten phase, andachieving better subsequentcrystallizationprocess control.
Inthispreliminarywork,wehavecarriedoutparallel experimentsto studythe
effects of microwave annealing
(MA)
and thermal annealing(TA)
on the PEOcrystallization. Sample morphology and the subsequent melting behavior were
characterized
by
polarizing light microscopy(PLM)
anddifferential scanning calorimeter(DSC),
respectively. Eachparallel experiment ofMA andTAhas beenconductedunderthesame coolingconditions. Theeffects ofsurface area, crystallizationtemperature, and
molecularweight on the morphology and melting behaviors ofcrystalline
PEO,
treatedChapter
2 Background
2.1.
Morphology
Itiswellknownthat some polymermelts, ata certaindegreeof supercoolingwill
rearrange themselves to form more ordered arrays characteristic of a crystalline state,
resulting in specific morphologies. A detailed study of crystalline morphology will not
only make it possible to better understand crystallization mechanism, but also
help
toachieve desiredpolymer properties.
Here,
we will discuss fourtypicalmorphologies forcrystallinepolymers,
including
theamorphousstructure,lamellae,
axialiteandspherulite,aswell astheirrelationshipto crytallization conditions.
Amorphous Structure: One important feature of crystalline polymers,
distinguishing
them from small molecularcrystalline solids, is that there is considerable fraction of a
disordered,
liquid-like,
amorphous component.Usually,
this component forms acontinuousmatrixinwhichthecrystalline regions are embedded. Therelativeamountof
the amorphous componentvaries considerably
depending
on the chemical nature ofthepolymer chains and on the crystallization conditions. Each polymer chain may be
incorporated
into,
or pass through several crystalline regions. As a result, crystallineregions are tied togetherprimarily
by
covalent bonds fromsegments ofthe chainin theamorphous region(2).
Lamellae:
X-ray
diffraction experiments of semi-crystalline polymers often give averychain is observed. On a larger scale, the
"chain-folding
lamellae"
concept predicts that
the representative structural element ofthe crystallite is the plate-like lamellae(3). It is
typically
about 100A
in thickness,independent
ofmolecular weight. The molecularchain axis or the C-axis of the unit cell lays in the direction of the thickness,
perpendicular to the plane surface ofthe lamellae. Each constituent molecule traverses
the lamellaemanytimes. Thethickness ofthelamellae grownfrom a melt is reasonably
uniform, and it is
inversely
related to the degree ofsupercooling at which the crystalswere grown.
Axialite and Spherulite: Single crystal lamellae can be formed under extreme
conditions.
However,
uponcoolingof a polymermelt,many lamellaearegenerated.They
may
break-up,
branching
throughscrewdislocations,
andfinally
impingeorinterconnectwitheach otherthroughchainswhichare anchoredinmorethanone lamellae. Aggregate
lamellar layers may link and align to take a characteristic shape, either sheaf-like or
spherical. A sheaf-like morphology is referred to as either axialite or
hedrite,
while aspherical oneisusuallycalled a spherulite.
Relationship
betweenThese Structures: Themulti-layeredlamellaraggregates,formedthrough the action of screw dislocations about one axis, may appear sheaf-like
(3)
ifviewed along the edges ofthe lamellae. Axialites result when all the lamellae grow to
their final size without interconnection witheach other except along the axis. Axialites
are formed at a temperature near the melt temperature.
They
grow slower, and theaxialite, all the layers tend to splay apart from each other, with non-crystallizable
componentsinthegrowthfront
being
rejectedinto theinterstitialsites(2-3).The maltesecross-sectionimageof a spherulite,viewedunderapolarizing light
microscope,
indicates
that all the radii are equivalent. In practice, spherulites arecomposed of radial sequences oflamellaewhich are often linked
by
screwdislocations.Thegrowthproceeds
by
theinitialformationofanarrayofdominantlamellae,
composedofthe longest and mostregularmolecular chains present withinthe melt.
Following
theestablishment ofthe dominant
framework,
subsequent subsidiary crystallization oflesscrystallizablematerial occurs attheinterstitial sites ofbranched lamellae. Componentsor
impuritiesunable to crystallizebecome trapped in amorphousdomains iftheir diffusion
is slow relativeto theadvancing growthfront (2).
Axialites are believed to represent the precursor to a full spherulite. Lamella
branching
or interconnection may take place anywhere in the growthfront,
and screwdislocations may occur around any axis, when crystallization proceeds rapidly.
Eventually,
all solid angles will be filled and a near spherical envelope is generated.Therefore,
the formation ofaxialites or spherulites, under a particular set of growthconditions, depends upon the
frequency
with which thebranching
occurs. Thesestructuresdiffer
by
degreeratherthanby
anymorefundamentalaspect(3).Theprecisearrangementoflamellaand amorphousdomainswithinthebulk
polymerisof greatimportancein
determining
microscopic properties.Forexample,ithaslong
been accepted that as the crystallization proceeds, the shorter, less crystallizablespherulites. As such inter-spherulitic regions constitute the sites ofpotential weakness,
crack propagation, or dielectric
break-down
may start from these regions. In practice,spherulite sizerepresentsanimportantparameterfor bulk propertycontrol(2).
2.2 Nucleation
Step
andGrowth
Step
during
Crystallization
Twosteps areinvolvedinthecrystallizationfroma polymermelt. Initially, a
nucleus ofcritical size mustbe formed. Ifthenucleus is too small, its high surface free
energy prevents it from
being
stablelong
enough to make crystal growth possible.Nucleation cantakeplace spontaneously in 3
dimension,
or on anexisting surface, i.e. ina growth front. Once the growth front is established, crystal growth can take place.
During
crystal growthstage, polymer chainsmust align themselves to the growthfront.As chains continually add to the growth
front,
layers of polymers form the edge ofthelamellae. It is believed that the morphology ofthe crystalline phase depends on the
relative rate ofnucleation to the rate at which polymer chains are "reeled in"
to the
growth front. The
"reeling
in"ofthe chains depends on the
diffusion,
or the reptationrate. At a small degree of supercooling, or a high crystallization temperature, the
reptation rateof polymerchainsisrelatively
high,
andthelateral growth rate of a nucleusacross the face ofthe crystal is much fasterthanthe nucleation rate. This leads to full
lateral growth oflamellaewith little interconnections. As aresult, axiallites are formed
undertheseconditions. In contrast,ifthedegreeofsupercoolingis sufficiently
large,
thenucleation rate will be much higher than the lateral growth rate. Multiple nucleation
events take place simultaneously, and lateral growth ofnuclei is retarded. Now the
bridgeandimpingeto forma muchmore complexmorphology. The resulting structure is
thespherulite (4).
2.3 Heterogeneous
andHomogeneous
Nucleation
Nucleationcanbeclassified ashomogeneous orheterogeneous. Homogeneous
nucleation involves a spontaneous, 3-dimentional aggregation of polymer chains at a
temperature below its meltingpoint, in a mannerwhich isreversibleup to a pointwhere
its critical size is reached. Beyond this point, the subsequent addition of chains is
irreversible,
andthepolymer aggregatewillgrow. Heterogeneousnucleation,ontheotherhand,
arises fromadventitiousimpurities,
eitherrandomly distributedthroughout thebulkorpossibly localizedon a surface.Nucleation atthe surface ofthesample containeris an
example of the later case (2). These sites are one example of residual nuclei, as
mentioned earlier.
Insome crystallization studiesitwasfoundthatnucleation sites appearinsimilar
positions
during
successive melting and re-crystallization cycles. This suggests thatchemically different sitesmay notbe necessary for heterogeneous nucleation to occur.
Thoseregions ofphysical ordering maypersist abovethe meltingpoint, and take a
long
time todisperse. Someevidence
(5)
suggested thatchainorientation inthepolymer meltmight indeed affect the rate of the subsequent crystallization process. It is
likely
thatmuch ofthe data
indicating
adependence onthemelthistory
arise fromthis factor. Theseresidualnuclei, defined
by
Sharpies as"tiny
regions with ahigh degreeof order thatmaypersistina meltfora
long
timeand will act as predetermined nucleiforre-crystallizationofresidual nuclei depends on the
annealing
conditions, such as annealing temperature,annealingtimeandannealingmethod.
Thenumber of nuclei generatedinthecourse ofcrystallizationisof
importance,
because it
determines
thefinal size ofthegrowth-units. Thisparameterisnowrecognizedas
being
correlated with the optical and mechanical properties of semi-crystallinepolymers.
Therefore,
astudyofthenucleation processisnecessary.Considerableevidenceindicates thatheterogeneousnucleation predominatesin
practice. The majorityofhomogeneousnucleation events require a muchhigher degree
ofsupercooling, (e.g. 50
C)
insteadof20C,
whichis usuallyneededforcrystallization(2). The higher the nucleation rate, the smaller the size ofthe growth-units (either
axiallite or spherulite). The nucleation rate will be the sum of the homogeneous
nucleation rate andtheheterogeneousnucleation rate.
2.4
Melting
Behaviors
ofCrystalline Polymers
Althoughthemeltingof polymersisafirst-ordertransition,unlikethe sharp melting
curves often observed forsmallmolecules, themeltingcurves of crystalline polymers are
quitebroad. The
broadening
ofthemeltingrange canbe attributedto a largevariation ofsurface energyoriginatedfrom crystal size
distribution,
andthecomplex morphologyofpolymers. The polymer morphology
typically
depends on processing conditions andmolecularproperties, such asend-group effect, molecularweightandpolydispersity,and
the extent of chain regularity.
Thus,
a detailed investigation ofthe polymer meltingMoreover, the accurate measurement of the polymer melting temperature is of
importance to
calculating
the degreeofsupercooling
forboth kinetic andthermodynamicstudies.
A broadrange ofmeltingtemperaturessuggeststhatalarge range of crystallite
stabilities, orqualities are involved. The high qualitycrystalsthatare formedwill melt at
a higher temperature than more disorderedcrystals. When a crystal melts, it consumes
energy.
Therefore,
an endothermic peak is observed on a DSC curve. Tm* is usuallydefinedas the meltingtemperature at whichthemelting is completed. Tm* may increase
with
increasing heating
rate, and with the crystallization temperature for a specificpolymer sample. In this research, in order to investigate the effect of microwave
annealing and compareit withthermal annealing, the
heating
rate and thecrystallizationtemperature arekept the same in both cases.
Therefore,
ifthere exist different meltingcurves between microwave annealing andthermal annealing, it canbe deduced that the
differencesare caused
by
theannealingconditions.Tm
isanothercharacteristicmeltingtemperature.Itis definedastheequilibriummeltingtemperature of chains with finite molecular weight (4). Although
Tm
cannot bemeasured
directly,
it is animportantparameter. Itcanbe approachedwhen a samplehasbeen crystallized very slowly. When this equilibrium meltingtemperature is compared
withthose melting temperatures,
Tm*,
obtained fortypical polymer systems, important10
Tm
. themeltingtemperatureofthe perfectcrystal formedby
infinite molecularweightpolymers, is also a thermodynamic equilibriummelting temperature(4). It canbe
seen that
Tm
isatheoretical parameterunderidealized conditions: no surface effects, noend-group effects. Chains are
fully
extended andequilibrium conditions are satisfied.l-16r
Tm*
Tm
'3000
i?4 12?
Tc
Figure
1: Theoretical
plot ofTm* againstTc
for indicated
chainlength
of
linear
polyethylene(6)
The approachofHoffmanandWeeks
(6)
canbeusedtoestimateTm
andTm based
[image:19.561.71.486.198.512.2]11
Hoffman-Weeks method is given in Figure 1. A plot
of Tm* vs.
Tc
is made. Theintersection oftheextrapolatedcurveswiththe straightline
Tm*=Tc
givestheequilibriummelting temperature Tm.
Moreover,
an extrapolation to infinitemolecular weight yieldsthe thermodynamic equilibrium temperature Tm.
However,
the crystallinity level hasbeendemonstratedtobeimportant for obtainingaccurateresult(7).
2.6
Microwave
Processing
ofPolymers
Theuse of microwaveradiationfor processingpolymers offers a number ofdistinct
benefits over conventional processing approaches. These include: enhanced
polymerization rates
(8),
increased glass transition temperatures(Tg)
ofthe cured epoxy(9),
improvedinterfaciaibonding
betweengraphite fibers andtheir matrix, andincreasedmechanical properties ofthe resulting composites (10). The advantages ofmicrowave
heating
over conventional thermalheating
are summarized in Table 1 (11). Thecharacteristics of microwave
heating
include: volumetric "inside toheating,
direct and quick
heating,
high selectivity, and high controllability. In additionto thesethermal characteristics, there are so-called "microwave which include anything
thateitherisdifferent fromthermalprocessingorcan notbepredicted oreasilyexplained
by
thedifferent,
temperatureprofile(12). Allofthesecharacteristicshave aroused alotofresearch interests in exploiting microwave radiation to either produce new polymeric
materials with desired properties, oruse it as a new alternative technique forpolymer
12
willnot enumerate themhere.However, a more detailed discussionaboutthemechanism
[image:21.561.68.504.190.363.2]ofmicrowave
heating
willbehelpful forunderstanding
ourexperiment results.Table 1:
Comparison
ofmicrowave and thermalheating
characteristics(H)
Thermal
Heating
MicrowaveHeating
Heating
RateSlow,
controlledby
heat transferFast,
Direct coupling of energy into moleculesSelectivity
No,
Heating
is due to temperature gradientYes,
Heating
isproportional to material
loss factor and input
power
Heatmovement Outto
in,
Surface drivenheating
from hottocoldInto out,Volumetric
heating
with
boundary
heat lossControllability
No,
Heat source can't be readily controlledYes,
Microwave energy can be readily removedThemajormechanism
(13)
ofcouplingofmicrowave radiationtopolymersisthrough dipole reorientation
by
the electric field (Figure 2). The relaxation of thisreorientation has a maximum at a
frequency
of about 10E+7Hz,
but there is a highfrequency
tail, which reaches the microwave region (10E+11 Hz).However,
themaximum value ofthis relaxation varies
during
a processing cycle, as the temperatureincreases. Put in other words, the dielectric loss
factor,
which is related to microwaveabsorption, isafunction ofboththe
frequency
andthe temperature.Consequently,
as thetemperature changes, the microwave absorption changes. Anotherconsideration for the
use of microwave
heating
is thattheprocessing temperature formostpolymers may beverycloseto the thermal degradationtemperatureofthepolymer.
Therefore,
it is strictlytnrougnout the part
being
processed, and it is necessary toprecisely control the
temperatureofthe partinorder to avoidthermalrun-away.
C|
e.
So
a
ii
I
TTEHFACUL
PCUWZATON
s
ATOUC
BESONAWCE
afcmcMC
RESONANCE
-3 12 IS
[image:22.561.100.430.160.390.2]LOG! (Hi)
Figure 2: Typical
variationin dielectric
constant anddielectric loss
with
frequency
for
polymers(13)
Atthemolecular
level,
whenno electricfield ispresent, thedipolemoments arerandomly orientedthroughoutthe medium. Butwhen an electric field isapplied, there is
a
tendency
fordipolemomentsto orientinthedirectionofthefieldto lowertheirenergy.An imposed alternatingelectric fieldwillcause oscillations ofdipole moments, with the
adjacent groups acting to inhibit the motion of the dipoles. The resulting friction
14
Theefficiencyofthiscoupling depends on anumber of
factors,
including
thedipole strength, themobilityofthedipole
andthemass ofthedipole.Strong
dipole couplingto the radiation leads to high efficiency for energy transfer. In the condensed state, the mobility ofthemedium aroundthedipole isalso important. Smallpolarmoleculesobtaintranslational energy in additionto theenergy fromreorientation(rotationalenergy). This
will
dramatically
increase the coupling ofthese molecules to the radiation field as comparedwithasegment ofa largemacromolecule.Similarly,
adipole thatis apart of apendentgroup will couplemore stronglythanagroup inthemainchain, dueto itsgreater
mobility. To summarize the behaviors for polymers, the melt couples the strongest
followed
by
therubberystate, glassypolymers and crystalline materials.Amechanismfor explainingthe"microwave onpolymerprocessing has
been proposed based on a non-equilibrium, non-uniform energy distribution between
neighboring groups. For the solution imidization of a polymeric acid
(12),
microwaveheating
increasedthe"temperature"
ofthereacting groups
by
approximately50C,
overthe temperature range investigated. The energy couples
directly
with a reactive polargroup in this system and dissipates through adjacent groups
by
random collisions.However,
ifthe energy absorptionis fasterthan energytransport, possibleat the initialstages ofreaction, there will be a non-uniformity in the temperature profile. This is consistent with some recent pulsedradiation studies
(13),
inwhichthepulsed repetition rate was set equal torate ofenergytransfer alongthe chain. Theoretical calculationsby
Brook et al
(14)
predict that a small perturbation to the higher energy region ofthe energy distributionwas sufficient to account for some "microwave which have15
proposed forpolymers, butthe
details
are different. Polymer systems are not ashighly
ordered as ceramics systems. In this work, for the first time, we introduce microwave
heating
for annealing a polymer melt, and investigate the "microwave effect 'on the
16
Chapter 3 Experimental
3.1.
Sampling
ofPoly(ethylene
oxide)
Inthisstudy,threetypes of poly(ethyleneoxide),
(PEO),
were used. Thesematerialswere allcommerciallyavailablePEOwithnarrowmolecularweightdistributions. Major
informationaboutthePEOsamples is listed in Table 2.
Table
2: Sample
characteristics ofPEO
Molecular Weight Physical Description Manufacturer
2000 g/mol
Waxy
flakes Fluka20,000 g/mol
Waxy
power Fluka400,000 g/mol White fine power Aldrich
The PEOpowderswerespread on glass slides andwere moltenon ahot stageto
form liquid films. The films were annealed
by
either TA orMA,
and then crystallizedinto solid films for further characterization. The bulk samples were prepared in glass
tubes which were
heated,
annealed and subsequently, cooled. At the same time, filmsamples could also be prepared in the tubes, because a liquid filmwas automatically
formedontheupper wall ofthetubes whenthe powdersinthetube melted and shrank.
After annealing and crystallization, the tube was
broken,
and the polymer film on theglasswallwas analyzed
by
PLMdirectly,
then the filmwas scratched offthe glass wall [image:25.561.67.507.321.382.2]17
3.2 Experimental
Set-up
for
Microwave
Annealing
Theexperimentalset-up for annealingofthepolymer samplesis showninFigure 3.
The sampletubewas placedin a microwave oven
(Multiwave, MA-693M,
Goldstar Co.Themicrowave oven wasrun at 100%powerwitha
frequency
of1.47GHz)
surroundedby
a paraffin oil bath.During
microwave annealing, the temperature of the polymersample could be controlled
by
the paraffin oilbath,
which did not absorb microwaveradiation. A recirculating isothermal water systemwas used tojacket the oil
bath,
andtake excess heat out ofthemicrowave oven in orderto
keep
the sample at a constanttemperature. Afterthe annealingwas complete, the temperature ofthe sample polymer
melt was
immediately
measuredwitha digitalplatinum thermometer(Interstate ElectricDT6)
through a hole ontop
ofthe oven.Therefore,
the calibration curve between thesetting temperature ofthe isothermalreservoirand the temperature ofthepolymer melt
couldbeobtained, as shownin Figure 4.
Itwasfoundthatasteadytemperatureofthepolymer melt couldbe achieved after
the microwave power was turned on for a period oftime. Ifthe set temperature was
above 60
C,
10 minuteswereusuallyneededto reachasteady temperature. At alowerset temperature, alongertimewas required.As seenfromFigure
4,
anincrease inthe settemperatureledtoasmallertemperaturedifference betweenthepolymer melt andtheset
temperature. At higher temperatures, the heat transfer was more efficient, and the
18
Oncethemicrowaveannealingwascompleted, thepolymer sampletubewas
quicklytakenout ofthemicrowave oven, and placedinawater
bath,
whichwas set ataspecifiedtemperature.
By
this way, the crystallization couldbecarried outisothermally.Afterthe crystallization was
finished,
the sampleswere characterizedusing differentialscanning calorimetry
(DSC)
andpolarizing light microscopy (PLM).Forthermalannealing
(TA),
polymer sampletubeswereplacedina controlledwaterbath. The temperature ofthe water bath was calibrated to maintain the same sample
temperatureas forMA. Crystallizationwasconducted asdescribedabove.
3.3
Morphology
Characterization
by
PLM
A polarizing lightmicroscope
(Reichert-micro)
withaJVC TK-10video camera anda Metier FP-52 hot stage was used to characterize the morphology of film samples
(magnification: 200X). The morphology ofthebulk samples couldnotbe examined
by
PLM because
they
were too thick for the light to pass through. An attempt to crosssectionbulksampleswitha microtomledtounclearimages.
3.4 Investigation
of theMelting
Behaviors
for
theCrystalline
PEO
by
DSC
The differential scanning calorimetry
(DSC)
isathermalanalysistechniqueforaccurate measurements oftransition temperatures and heat capacities. The DSC curve,
refered to as a thermogram, is proportional to the heat capacity of a sample. In our
experiments, themelting curves of allthe samples weremeasured at a
heating
rate of519
different annealing methods, the
difficulty
intransferring
ahot meltinto theDSC panpreventedus from
doing
so.Instead,
both filmandbulk samples werecharacterizedaftertheannealedmeltswere crystallized under controlledcoolingconditionsso thatwe could
obtainthemelting curves for boththefilmand the bulksamples underthe same
heating
conditions.A SeikoInstrumentInc. DSC 220C Modulewas usedhere.
temperaturecontroller
thermometer
polymer
isothermal
reservoir
microwaveoven
[image:28.561.98.462.258.563.2]ice bath
20
100
40
-? Tp=Ts sMA1 Omh.
50 60 70 80
SetTemp,ofthe ReserviorTs(oC)
[image:29.561.76.461.121.443.2]100
Figure 4: The
temperature calibration curvefor
thepolymer melt and21
Chapter
4
Results
andDiscussions
4.1 Microwave
Effects
onPEO Crystallization
Forcomparison,we wouldliketomaintainthesameannealingtemperaturefor both
MA and TA samples.
However,
the energy can be coupled into the systemdirectly,
quickly andvolumetrically usingmicrowave annealing. In contrast, thermal annealing
requires alongertime toachievethermal equilibrium,becausepolymers areusuallypoor
thermal conductors.
Thus,
weintentionally
prolonged the annealingtime forboth MAand TA to eliminate potentialtemperature gradientsinside thepolymermelt, especially
for TAsamples
Allthebulk PEOsamples
(
Mn: 20,000 g/mol)wereannealed at100C
forvarioustime periods,from 5minutesto2 hours. Afterannealing,theywereallquenched at25
C
inair untilthe crystallization was complete.DSC melting behavior for eachbulksample
wascharacterizedusing=10mgsemi-crystalline specimens removedfromthecenter of
thesampletube.
ItwasfoundthatDSC meltingcurveswere superimposableforalltheMAbulk
samples when the annealing time was larger than 10 minutes, while the DSC melting
curves were also superimposable forall the TA bulk samples when the annealing time
was larger than 10minutes.
However,
no DSC thermograms ofthe MA samples weresuperimposable onthose oftheTA samples. The factthatanannealing timelongerthan
had been reached
by
10 minutes, no matter if MA or TA was used.Therefore,
thedifference
between
MA and TA cannot be explainedby
the difference oftemperaturegradient
inside
the polymer melt. There must be a fundamental difference betweenmicrowave
annealing
and thermal annealing, as evidencedby
different DSC meltingbehaviors.
[image:31.562.67.500.205.523.2](a)
(b)
Figure 5:
Morphology
of crystalline polymers-PEO crystallized at25C
in airafter
(a)
thermal annealing, and subsequent(b)
microwaveannealing(Annealing
temperature: 100C;
annealingtime: 10min.; Mn: 20,000 g/mol.)Theeffect oftheannealingmethod onPEOcrystallizationbecamemore evident
when the crystallinemorphology offilm samples was examined usingPLM. As seen in
subsequently
annealing the same sample withmicrowaves, the fine texture inthe image5bwas observed. Crystallizationconditionsforbothmicrographswereexactlythesame.
(a)
(b)
Figure6:
Morphology
of crystalline polymers-PEO crystallized at25C
inairafter
(a)
microwaveannealing,and subsequent(b)
thermalannealing(Annealing
temperature:100C;
annealing time: 10 min.;Mn: 20,000 g/mol.)Whentheorder ofannealingconditions wasreversed, theresulting PLM images
were also reversed. This is shown in Figure 6.
Therefore,
it could be concluded thatdifferent annealing methods gave rise to different crystalline morphologies. The result
was reproducible, and was independent of the annealing order. This was a true
[image:32.562.67.497.135.451.2]24
As discussed inchapter
2,
aMaltesecross patterninaPLMimageimpliedthatthelamellae of the crystalline polymer aligned, branched and splayed in a spherical
symmetry,which wasobservedinthePLMimages oftheTAsamples.
However,
thefinetexture in the PLM images ofthe MA samples implied that the structure might be
anisotropic.Anisotropicmechanicalproperty
(15)
had beenreportedforpolyimidefilms,
whenmicrowaves were employed to assistthe imidization. This could be explained
by
the
inability
for polymer chains to regularly align to the film plane when usingmicrowave radiation.
4.2 Mechanism
ofMicrowave Effects
Beforewe couldcomparethe effects of microwave annealingandthermalannealing
by investigating
samplemorphologyandits meltingbehavior,
subsequent crystallizationhad to be completed for all the samples. It is important to
keep
inmindthat there aresomeotherfactors affectingthePLM andDSCresultsfor PEOcrystallinepolymers, such
as annealing temperature, annealingtime, crystallizationconditions, sampling type(bulk
or
film),
and molecularweight.Here,
we have changed onefactor,
andkeptalltheotherconditionsthe samewhile studyingthe effects ofMAandTAonPEO crystallization. In
the next section, we will investigate themicrowave effects on PEO crystallization
by
changing either the crystallization temperature or the molecular weight of PEO.
Moreover,
we will discuss the nature of microwave effects and specify the conditions25
4.2.1 Dependenceof microwave effects on crystallizationtemperature
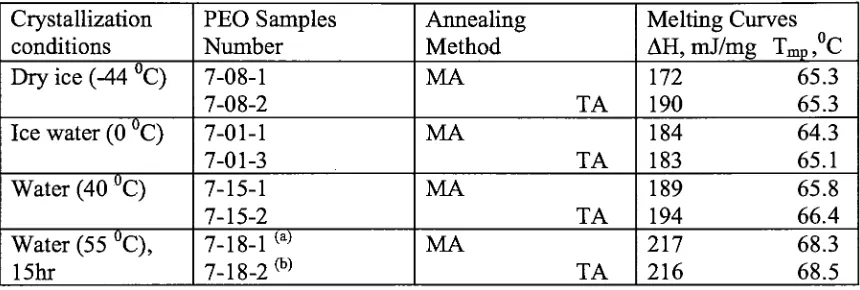
Table3 andTable 4give a comparisonofthemelting behaviorofMAandTA
samples. The precision of these measurements is within 2%. Similar trends were
observed for both film and bulk samples, as exhibited in these tables. When the
crystallization was carried out at -44
C
(dry
icebath),
the extent of crystallinity formicrowave annealing was much lower than forthermal annealing, as indicated
by
theenthalpychange
during
themeltingtransition.The enthalpyofmelting, orAHoftheMAsampleat-44
C
was about 10% lowerthan thatofthe TAsamplefor both filmandbulksamples. Whenthe crystallization wasperformedina waterbathathighertemperatures,
the difference ofthe enthalpychangebetween MA andTAbecomesmuch smaller. This
phenomenonwasobservedin both filmandbulksamples. BasedontheseDSCresults,if
a difference in crystallinity existed for film samples between MA and
TA,
a similardifferencewouldbe expectedto exist for bulksamples. Therole of substrate surface area
onthe crystallizationfor filmsampleswillbe discussed inmore detail later.
AlthoughthemeltingcurvesfortheMA andTAsamples crystallized at55
C
seemed to be similar, their crystallizationkinetics were different. After annealing, the
polymer melts were
immediately
transferred into a 55C
water bath. Since thetemperaturewasrelatively
high,
the crystallizationwas slow, and couldbe observedby
eye. Forthe sample 7-18-1
by
MA,
countablecrystallites became visible afterthemeltwas cooledfor 10 minutes.
However,
the sample 7-18-2by
TA exhibited atleast triplethe amount ofvisible crystalliteswith the samemass ofthemelt afteritwas placed into
26
thatmicrowave annealing decreased the nucleation
density
andretarded the rate ofthecrystallization process. Although the final extent ofcrystallinity, and the meltingpoint
didnot change
by
changing annealingmethod, thekinetics ofthecrystallization processof MA and TA were different. This might explain why at the low crystallization
temperature-44
C,
the crystallinityofmicrowave annealed samples was lowerthanthatofthermal annealed samples. At such alowtemperature, the crystal growthis diffusion
(reptation)
limited.As aresult, the extentofcrystallization depended onthe number ofnuclei. Inthepolymer meltannealed
by
microwaves,the nucleidensity
waslow,
becausemostoftheresidualnuclei weredestroyed
by
microwave-assistedchain rotations.Table
3: Comparison
ofmelting behavior for
film samplesCrystallization Conditions PEOSamples Number
Annealing
MethodMelting
CurvesAH,
mJ/mg Tmp,CDry
ice(-44C)
7-08-1 7-08-2MA
TA
175 65.2
189 65.2
Icewater
(0C)
7-01-17-01-3
MA
TA
183 65.1
178 65.1
Water
(40C)
7-02-17-02-2
MA
TA
193 65.7
190 65.7
Water
(55C)
lhr 7-08-37-08^1
MA
TA
203 68.3
200 67.7
(Annealing
temperature: 78C: Annealing
time: 10min.;Mn: 20,000g/mol;DSC
heating
rate:5C/min.;
Tmp: meltingpoint atthepeakposition.)PEOchains possess largedipolemoments atthehydroxylterminatedchain ends.An
appliedalternating electric fieldwill causethe oscillation ofthese dipole moments, and
[image:35.561.72.503.383.527.2]27
rotationenergy ofthe system, speeding up the elimination ofresidual nucleiin themelt.
In contrast, energy is transferred
by
less efficient collision for thermal annealing, andchain conformations do not change as easily. Some residual nuclei will persist after
annealing, and act asheterogeneousnucleiforsubsequent crystallization.
Table
4: Comparison
ofmelting behavior for bulk
samplesCrystallization conditions PEO Samples Number
Annealing
MethodMelting
CurvesAH,
mJ/mg Tmp,CDry
ice(-44C)
7-08-17-08-2
MA
TA
172 65.3
190 65.3
Icewater(0
C)
7-01-17-01-3
MA
TA
184 64.3
183 65.1
Water(40
C)
7-15-17-15-2
MA
TA
189 65.8
194 66.4
Water(55
C),
15hr 7-18-1 (a) 7-18-2w MA TA 217 68.3 216 68.5(Annealing
temperature: 78C;
Annealing
time:lOmin.;
Mn: 20,000g/mol;DSC
heating
rate:5C/min.;
Tmp: meltingpoint atthepeakposition.)(a)
Countablecrystallitesbecamevisibleatthe 10thminutes afterthemelt wasplacedin 55
C
waterbath.(b)
Atleasttriple theamountofvisiblecrystallitespresentinthesame amount ofmelt as comparedto(a) atthe4thminutesafterthemelt wasplacedin
55
C
waterbath.As discussed
before,
homogeneousnucleationtakeslongertimeand requires lowertemperatures than heterogeneous nucleation. Homogeneous nucleation appears to
predominate in PEO crystallization
following
microwave annealing. This gives an [image:36.561.72.502.236.381.2]7-08-2. For the
latter,
heterogeneous nucleation may be the dominant mechanism. Thecomparison isgivenin Table 4.
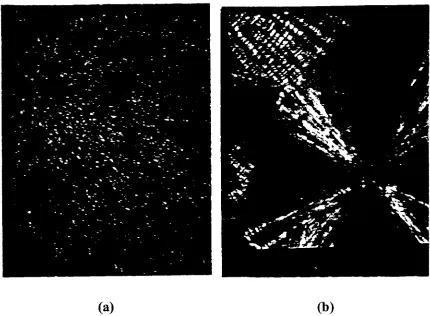
[image:37.562.68.501.148.424.2](a)
(b)
Figure 7:
Morphology
ofPEO
crystallized at-44C
ondry
ice
after
(a)
microwave annealing,(b)
thermalannealing
(Annealing
temperature:78C;
Annealing
time: 10rnin.;Mn: 20,000 g'mol)Themorphologies ofthe filmsamples 7-08-1 and7-08-2wereexamined
by
PLM.As shown in Figure
7a,
only one crystallite was observed for the MA sample, which29
lamellae
werejustlocally
aligned, notradially symmetric aroundthe center. In contrast,as
indicated
in Figure7b,
more crystallites existed for the TA sample,implying
morenuclei. The Maltesecross patternindicatearadiallysymmetric lamellaestructure.
(a)
(b)
Figure
8:
Morphology
ofPEO
crystallizedfor
1 hr
at55C
after(a)
microwave annealing,(b)
thermalannealing
[image:38.562.70.499.196.495.2]30
Figure 8representedthemorphologies forthefilmsamplesfor MA
(7-08-3)
andTA(7-08^1)
crystallized at 55C
inthewaterbathforonehour,
thenkeptat25C
inair.Forthemicrowave-annealed sample, as shownin Figure
8a,
the lamellae arewelldefined,
smooth and of a large size. There may be amorphous structures or less crystallized
domains in the dark regions. Since the crystallization had not been finished for this
samplewithin one
hour,
itcontinuedtoformcrystalswith poorqualityduring
the coolingat 25
C.
However,
the image ofthethermally
annealed sample in Figure 8b showedmore uniform crystallites with a rough contoured texture. This couldbe attributed to a
high crystallization rate due to a high residual nuclei density. The dark
"river"
in the
imageis a crackinthefilm.
Ifthe sampleswerekeptat55
C
foralong
enoughtime(e.g. 15hours),
itwasobservedthatthemorphologies ofMAandTAsamplesbecamesimilar. Thisisrevealed
in Figure 9.
During
the longer time period, polymer chains had an opportunity toreorganize into a crystalline state close to thermal equilibrium. Since at such a high
temperature, the chain reptation rate and
impurity
diffusion rate were bothhigh,
anysmallunstable orpoor qualitycrystalline entitiesmight
dissipate,
andre-crystallize intobiggercrystal structures.
Consequently,
long
crystallizationtimes tendedto eliminatethemorphology difference between TAandMA.
Next,
wecloselyexaminetheDSC thermogramsofMAandTAsamples aslisted inTable3 and4. Thethermograms for filmsamples areshownin Figure
lOa-d,
whilethosecomparison of thermograms ofMA and TA
film
samples reveals that the MA meltingcurves arenarrowerthanthecorrespondingTAcurve. The crystallinityfortheMA film
(a)
(b)
Figure
9:
Morphology
ofPEO
crystallizedfor 15 hr
at55
C,
after
(a)
microwave annealing;(b)
thermal annealing.(Annealing
temperature:78C;
Annealing
time: 10min.; Mn:20,000 g/mol)sample is lower than for the TA film one, and the morphologies for these two film
samples were different as indicated in Figure 7. For bulk samples, Figure 11a shows
[image:40.562.71.501.148.425.2]32
may be differentmorphologiesforthe twoMAandTAbulksamples,justaswasthecase
for the two film samples. We
hypothesize
that surface effects do not play an importantrole underthelowtemperaturecrystallization conditions.
Usually,
crystallization rate dependsonboth diffusionrate(therate ofpolymer chainreptation) and nucleation rate. The diffusion rate increases with the crystallization
temperature, while the nucleation rate decreases with the temperature.
Therefore,
themaximum PEO crystallization rate is achieved at about 40C (degree ofsupercooling:
25C). At a low temperature, such as -44C, the diffusion rate is very slow, and the
nucleation rate ishigh. Asaresult,no extranucleation centerfromthesubstrateisneeded
forthecrystallization. Thatiswhysurface effects werenotpronouncedforthesesamples.
Atahighercrystallizationtemperature, suchas 0
C
or40C,
the glass substrateofthe filmsamples couldbe used as heterogeneousnucleation sites for the crystallization,
leading
toathe fastcrystallization rate. Thenucleationrate of polymer meltisslow. Thiscould explainwhytherewasno
big
difference in morphology between MAandTAfilmsamples at these temperatures (Figurel2 and 13).
Similarly,
theirDSCthermograms alsotended tobe close to eachother, as depicted in FigurelOb and 10c.
However,
Figurellband lieshoweddifferentthermogramsforthebulkcounterparts.
Here,
a surface effectisnot important. The difference between TA and MAbulk samples couldbe attributedto
the fact thata heterogeneousnucleation mechanism dominates for the TA bulk sample,
while a homogeneous nucleation mechanism took control for the MA one.
Again,
O.OOE+00 -S00E+03
5
-100E+04 3 -1.50E+04 (/> O -200E+04 -250E+04 -aOOE+0420 40 60 80
Temperature,
CMA,Tc=-44C
TA,Tc=-44C
100 120
Figure
10a: DSC
thermogramsoffilm
samples afterdifferent annealing
treatments
(crystallized
at-44C)
0.00E+00 -5.00E+03
^
-1.00E+04 3 O -1.50E+04 CO -2.00E+04 -2.50E+04 -3.00E+04 20"~~^x
/
?k < '
MA TrD C1
\
!
!...
TA,Tc=0CJ
\ ! i
\l
V 1
40 60
Temperafcjre,C
[image:42.561.92.419.106.279.2]80 100
Figure 10b: DSC
thermograms offilm
samples afterdifferent
annealing
[image:42.561.99.413.377.555.2]O.OOE+00 -5.00E-K33 5 -1.00E+04 3 O -1.50E-HM (0 Q -2.00E+04 -2.50E-K)4 -3.00E+04
20 30 40 50 60 70
Temperature,
C [image:43.561.81.402.79.256.2]80 90 100
Figure 10c. DSC thermograms
offilm
samples afterdifferent annealing
treatments
(crystallized
at40
C)
O.OOE+OO
-5.00E+03
^
-1.00E+04 -1.50E+04 CO Q -2.00E+04 -2.50E+04 -3.00E+0420 40 60 80
Temperature,
CMA,Tc=55 C
TA,Tc=55C
100
Figure lOd: DSC
thermograms offilm
samples afterdifferent
annealing
treatments
(crystallized
at55
C)
(Conditions for
FigurelOa-d,
Annealing
temperature:78C;
Annealing
time: 10min.; [image:43.561.67.417.356.523.2]35 O.OOE+00 -5.00E+03
%
-1.00E+04 O -1.50E+04 Q -2.00E+04 -2.50E+04 -3.00E+04 / MA,Tc=-44CTA. Tc=-44C
0 20 40 60 80
Temperiurei
C
100 120
Figure
11a: DSC
thermograms ofbulk
samplesfor different annealing
treatments
(crystallized
at-44C)
0.00E+00
T^
-5.00E+03 ^ -1.00E+04O
W
-1.50E+04Q
-2.00E+04 -2.50E+04~"X
ff~!
\
\i1
fsMA Tr
-0C
TA,Tc-0C
\s p,
V
!
i i i i i
20
40
60
80
Temperature,
C
100
120
Figure
lib:
DSC
thermograms ofbulk
samplesfor different
annealing
[image:44.561.74.432.88.281.2] [image:44.561.85.421.399.592.2]3 O.OOE+00 -5.00E+03 -1.00E+04
O
-1.50E+04Q
-2.00E+04 -2.50E+04 -3.00E+04 20\
UL
M 40 60Temperature,
C
80MA
Tc=40CTATc=40C
[image:45.561.80.451.87.283.2]100
Figure lie: DSC
thermograms ofbulk
samplesfor different annealing
treatments
(crystallized
at40
C)
0.00E+00 -5.00E+03
1
-1.00E+04<i
-1.50E+04Q
-2.00E+04 -2.50E+04 -3.00E+0420 40 60 80
Temperature,
C
MA, Tc= 55
TA, Tc = 55
100 120
Figure lid:
DSC
thermograms ofbulk
samplesfor different
annealing
treatments
(crystallized
at55
C
for
15
hr)
(Conditions for Figurel la-d:
Annealing
temperature:78C;
Annealing
time: 10min.; [image:45.561.86.437.385.577.2]37
temperature)
and less time was left for crystal growth. The resulting crystals may havesmaller size and larger surface area. Thiscould explainwhythe DSC melting curves for
theMA samples showedlower meltingtemperatures.
Atthecrystallization temperaturesof0 C and40
C,
the microwave effectwasobserved forthe bulk samples evenin the DSC curves (Figure 1 lb and 1lc), which, as
mentioned
before,
a less sensitive technique thanPLM to examine surfacemorphology.Very
possibly, abig
difference in morphology also exists between MA and TA bulksamples,althoughwecouldnot
directly
characterizeitwith asuitable technique. [image:46.562.71.508.289.621.2](a)
(b)
Figure 12:
Morphology
ofPEO
crystallized at0 C
(a)
microwaveannealing;
(b)
thermalannealing
38
Atthehighestcrystallizationtemperatureof55
C,
thecrystallizationrateisdictatedby
nucleation. Inthis case,bothheterogeneousandhomogeneous
nucleation wouldtakealong
time. Ithadbeen observedthatittook 10 minutes forcrystallitesto emergefortheMA samples, while 4 minutes was needed for the TA samples.
Possibly,
the surfaceeffect no longer played an important role in the crystallization at this extremely high
temperature. Surface nuclei may sustain even after formation.
Therefore,
the differentmorphology as indicated inFigure 8 fortheMA and TA sampleswasprimarilycaused
by
their different kinetics. When extending the crystallization timefrom 1 hour to 15hours at 55
C,
the difference in DSC thermograms between MAand TAbulk sampleswas reduced, as shown in Figure lid. This couldbe attributed to
long
timemelting-recrystallization or reorganizationofthe crystallites at thishightemperature. Thisresult
was consistentwiththemorphologyexaminationforthefilmsamplesgivenin Figure 9.
ComparisonsofDSC thermogramsbetweenthebulkandfilmsamplesattwo
crystallizationtemperaturesare given in Figure 14a-bandFigure 15a-b using TAor
MA,
respectively. Whenthecrystallizationtemperaturewas -44
C,
as shownin Figure14a-b,
thefilmthermogramwas closeto thebulkone, especiallyunderthe condition ofthermal
annealing (Figure 14a). As discussed earlier, the surface effect should not play an
importantroleinthe crystallizationatthislowtemperature.
Therefore,
it isreasonabletoassumethat thestructure ofthebulksamplewas similartothatofthe correspondingfilm
sample. Ifthis is
true,
there shouldbe differentmorphologiesbetween TAandMAbulksamples, considering the fact that the morphologies between the TA and MA films
39
Figure 13:
Morphology
ofPEO
crystallized at40C
(a)
microwave annealing;(b)
thermalannealing
(annealing
temperature:78C;
annealing time: 10min.; Mn:20,000g/mol)Figure 15a-bshowsthatDSC thermogramsoffilmsamples are quitedifferentfrom
thoseofbulkones at a crystallizationtemperatureof0
C.
Therefore,
themorphologyoffilm samples cannot be representative ofbulk ones. The surface effect for the film
samples must be taken into consideration at this relatively high temperature. It was
interesting
to notice that different melting behavior betweenthe film andbulk samplesoccurred at the lowertemperaturepart ofthemelting curves for
MA,
and at the higher40 O.OOE+00 -&OOE+03
^
-1.0CE+04 3 O -1.50E+O4 CO Q -20CE+04 -25CE+04 -aOCE+04 20 t~x
r
\
!
TA(firn),Tc=-44C---TA(rjulk)Tc=44C
^ i 1
\
i
J :\i
40 60 80
Temperatire,
C [image:49.561.93.432.104.292.2]100 120
Figure 14a: DSC
thermogramsofthebulk
sample andthefilm
sample,crystallized at -44
C
(after
thermalannealing
treatments)
0.00E+00 -500E+03
^
-1.00E+04 3 6" -1.50E+04 CO Q -200E+04 -250E+04 -SOOE+04 20u
C
\
: _ti-TT
Y:
-MA(bulk),Tc=44C
-MA(iIm)Tc=44C
40 60 80
Temperature,
C100 120
Figure 14b:
DSC
thermograms ofthebulk
sample and thefilm
sample,
crystallized at -44
C
(after
microwaveannealing
treatments)
(Conditions forFigure 12a-b: annealingtemperature:
78C;
annealingtime: 10min.;Mn: [image:49.561.84.427.388.570.2]41 O.OOE+00 -5.00E+03 = -1.00E+04 CO Q -1.50E+04 -2.00E+04 -2.50E+04
~~"X
ff
\
1/
TA HVrt Tr- Hf" TAbiik,Tc=OCW
V
y
30 40 50 60 70 80
Temperature,
C [image:50.561.81.434.90.280.2]90 100
Figure 15a: DSC
thermograms ofthebulk
sample andthefilm
sample,crystallized at
0
C
(after
thermalannealing
treatments)
0.00E+00 -5.00E+03
$
-1.00E+04 3 O -1.50E+04 CO Q -2.00E+04 -2.50E+04 -3.00E+04-T
-CXT
it
\iMAfilm,Tc=0C
MAbulKTc=0C
20 40 60 80
Temperature,
C
100 120
Figure 15b: DSC
thermograms ofthebulk
sample and thefilm sample,
crystallized at
0
C
(after
microwaveannealing
treatments)
(Conditions for Figurel5a-b: annealingtemperature: