R E S E A R C H
Open Access
Development of sedentary behavior across
childhood and adolescence: longitudinal
analysis of the Gateshead Millennium Study
Xanne Janssen
1*, Kay D. Mann
2,3, Laura Basterfield
2,3, Kathryn N. Parkinson
3, Mark S. Pearce
2, Jessica K. Reilly
3,
Ashley J. Adamson
2,3and John J. Reilly
1Abstract
Background:In many parts of the world policy and research interventions to modify sedentary behavior of
children and adolescents are now being developed. However, the evidence to inform these interventions (e.g. how sedentary behavior changes across childhood and adolescence) is limited. This study aimed to assess longitudinal changes in sedentary behavior, and examine the degree of tracking of sedentary behavior from age 7y to 15y.
Methods: Participants were part of the Gateshead Millennium Study cohort. Measures were made at age 7y (n= 507), 9y (n= 510), 12y (n= 425) and 15y (n= 310). Participants were asked to wear an ActiGraph GT1M and accelerometer epochs were defined as sedentary when recorded counts were≤25 counts/15 s. Differences in sedentary time and sedentary fragmentation were examined using the Friedman test. Tracking was examined using Spearman’s correlation coefficients and trajectories over time were assessed using multilevel linear spline modelling.
Results:Median daily sedentary time increased from 51.3 % of waking hours at 7y to 74.2 % at 15y. Sedentary fragmentation decreased from 7y to 15y. The median number of breaks/hour decreased from 8.6 to 4.1 breaks/hour and the median bout duration at 50 % of the cumulative sedentary time increased from 2.4 min to 6.4 min from 7y to 15y. Tracking of sedentary time and sedentary fragmentation was moderate from 7y to 15y however, the rate of change differed with the steepest increases/decreases seen between 9y and 12y.
Conclusion:In this study, sedentary time was high and increased to almost 75 % of waking hours at 15y. Sedentary behavior became substantially less fragmented as children grew older. The largest changes in sedentary time and sedentary fragmentation occurred between 9y to 12y, a period which spans the transition to secondary school. These results can be used to inform future interventions aiming to change sedentary behavior.
Keywords:Sitting, Accelerometry, Children, Adolescents, Longitudinal, Cohort
Background
Sedentary behavior (e.g. sitting, screen time) is negatively related to several health outcomes independent of phys-ical activity in adults. More specifphys-ically, it has been shown that sedentary behavior, that is sitting time and the fragmentation of sitting time (i.e. the extent to which sitting time is prolonged or interrupted), is related to health outcomes [1, 2]. The evidence on the association
between sedentary behavior and health among children and adolescents remains inconclusive [3]. However, sed-entary behavior appears to track from childhood into adulthood [4]. Therefore, understanding the change of these behaviors from early life is crucial.
In many parts of the world policy and research inter-ventions to modify sedentary behavior of children and adolescents are now being developed. However, there is still a lack of evidence on which to base such interven-tions: evidence on basic information is lacking, such as time spent sedentary during childhood and adolescence, the extent to which sedentary time is fragmented, how * Correspondence:[email protected]
1
University of Strathclyde, School of Psychological Science and Health, Glasgow, Scotland, UK
Full list of author information is available at the end of the article
this behavior changes across childhood and adolescence and how these behaviors interact with light intensity physical activity and/or sleep. Longitudinal evidence on these issues can provide important information for pol-icy makers and researchers designing interventions, and can inform decisions such as when to intervene.
Previous studies reporting on tracking of sedentary be-havior have generally focused on only one aspect of sed-entary behavior (e.g. television viewing, computer use), were of limited longitudinal duration (i.e. 1, 2 or 3y), did not include the important transition from childhood to adolescence or used self-report methods [5–7]. To our knowledge no evidence is available on the tracking of overall sedentary time, or the fragmentation of sedentary behaviour, from childhood into adolescence. Capturing the transition from childhood into adolescence, in more contemporary cohorts, and including multiple time points throughout childhood and adolescence could highlight crucial periods in life in which changes in sed-entary behavior occur and thus inform future timing of interventions to focus on critical time periods. There-fore, the current study aims to broaden the evidence base in this area substantially by 1) providing normative data on sedentary behavior, and longitudinal changes in sedentary behavior, across childhood and adolescence; 2) investigating to what degree sedentary behavior tracks across childhood and adolescence; 3) examine when the greatest changes in sedentary behavior take place.
Methods
Participants
Participants were part of the Gateshead Millennium Study cohort. Details of this cohort study have been published previously [8]. Briefly, the GMS is a contem-porary cohort which is socio-economically representative (based on the Townsend deprivation index from the UK 1991 census) of North-East England with an equal distri-bution across all the deprivation quintiles from age 8y [8]. The majority of the participants were from Cauca-sian backgrounds. The GMS is highly generalizable across the UK in view of the similarity in levels of ob-jectively measured sedentary behavior and in the main determinants (age, gender, season, obesity) of objectively measured sedentary behavior [9]. For the present study, measures collected when children were 6y to 8y of age (October 2006 to December 2007), 8y to 10y (October 2008 to September 2009), 11y to 13y (October 2011 to September 2012) and 14y to 16y were used (September 2014 to September 2015; from here on referred to as age 7y, 9y, 12y and 15y respectively). The study was approved by the Gateshead and South Tyneside Local National Health Service Research Ethics Committee for data collec-tion at 7y and by the Newcastle University Faculty of Medical Sciences Ethics Committee for the 9y, 12y and 15y
data collections. Informed written consent was obtained from the parent/guardian of each child, and children pro-vided their assent to participation.
Objective measurement of sedentary behavior
Sedentary behavior was measured using an ActiGraph GT1M accelerometer (ActiGraph Corporation; Pensacola USA). Accelerometry protocols used in the GMS have been described in detail elsewhere [10, 11]. In brief, partic-ipants were asked to wear the accelerometer on the right hip during waking hours for 7 days. Participants recorded the times when the monitor was put on in the morning, taken off at night and any additional periods the monitor had to be removed (e.g. for a bath). Participants were only included if they provided complete wear time diaries. Non-wear time/sleep data were removed manually based on the wear time diaries and visual inspection by a trained researcher before data analyses. It was decided not to de-fine non-wear time using consecutive zeros as this affects the data significantly especially in longitudinal studies where changes in behavioral patterns are very likely [12]. Data were collected in 15-s epochs and included in the analyses if participants had at least three days with 6 h per day of accelerometry data, though in practice the acceler-ometer wear times were much higher than this (described below) [13]. Epochs were defined as sedentary when recorded counts were≤25 counts/15 s. This cut point has been widely used to define sedentary time and has shown good agreement with a posture based monitor when measuring sedentary time [14].
Outcomes
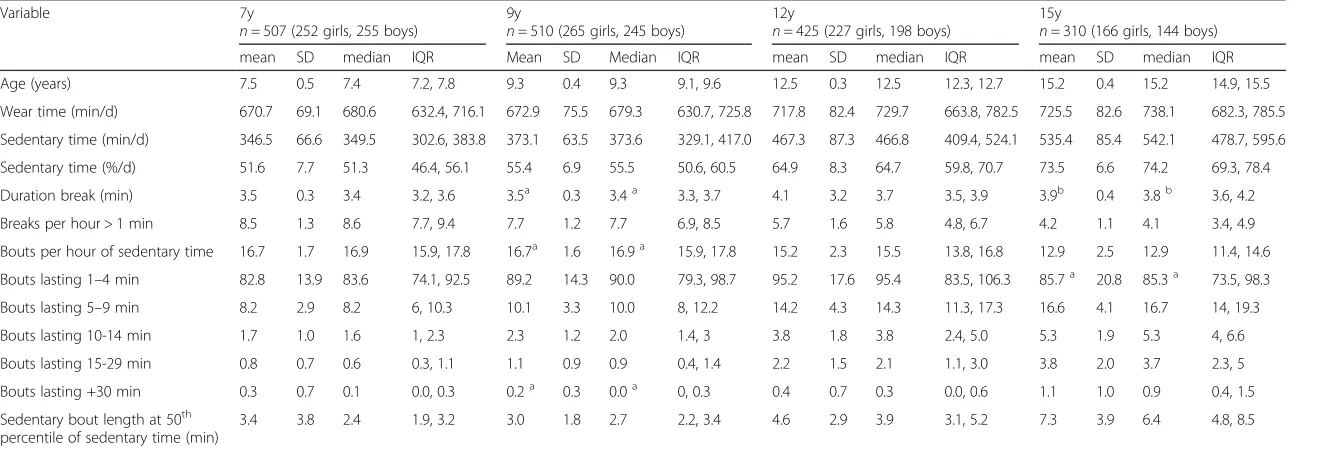
Table 1Participant Characteristics and Summary Measures of Sedentary Behavior Variables
Variable 7y
n= 507 (252 girls, 255 boys)
9y
n= 510 (265 girls, 245 boys)
12y
n= 425 (227 girls, 198 boys)
15y
n= 310 (166 girls, 144 boys)
mean SD median IQR Mean SD Median IQR mean SD median IQR mean SD median IQR
Age (years) 7.5 0.5 7.4 7.2, 7.8 9.3 0.4 9.3 9.1, 9.6 12.5 0.3 12.5 12.3, 12.7 15.2 0.4 15.2 14.9, 15.5
Wear time (min/d) 670.7 69.1 680.6 632.4, 716.1 672.9 75.5 679.3 630.7, 725.8 717.8 82.4 729.7 663.8, 782.5 725.5 82.6 738.1 682.3, 785.5
Sedentary time (min/d) 346.5 66.6 349.5 302.6, 383.8 373.1 63.5 373.6 329.1, 417.0 467.3 87.3 466.8 409.4, 524.1 535.4 85.4 542.1 478.7, 595.6
Sedentary time (%/d) 51.6 7.7 51.3 46.4, 56.1 55.4 6.9 55.5 50.6, 60.5 64.9 8.3 64.7 59.8, 70.7 73.5 6.6 74.2 69.3, 78.4
Duration break (min) 3.5 0.3 3.4 3.2, 3.6 3.5a 0.3 3.4a 3.3, 3.7 4.1 3.2 3.7 3.5, 3.9 3.9b 0.4 3.8b 3.6, 4.2
Breaks per hour > 1 min 8.5 1.3 8.6 7.7, 9.4 7.7 1.2 7.7 6.9, 8.5 5.7 1.6 5.8 4.8, 6.7 4.2 1.1 4.1 3.4, 4.9
Bouts per hour of sedentary time 16.7 1.7 16.9 15.9, 17.8 16.7a 1.6 16.9a 15.9, 17.8 15.2 2.3 15.5 13.8, 16.8 12.9 2.5 12.9 11.4, 14.6
Bouts lasting 1–4 min 82.8 13.9 83.6 74.1, 92.5 89.2 14.3 90.0 79.3, 98.7 95.2 17.6 95.4 83.5, 106.3 85.7a 20.8 85.3a 73.5, 98.3
Bouts lasting 5–9 min 8.2 2.9 8.2 6, 10.3 10.1 3.3 10.0 8, 12.2 14.2 4.3 14.3 11.3, 17.3 16.6 4.1 16.7 14, 19.3
Bouts lasting 10-14 min 1.7 1.0 1.6 1, 2.3 2.3 1.2 2.0 1.4, 3 3.8 1.8 3.8 2.4, 5.0 5.3 1.9 5.3 4, 6.6
Bouts lasting 15-29 min 0.8 0.7 0.6 0.3, 1.1 1.1 0.9 0.9 0.4, 1.4 2.2 1.5 2.1 1.1, 3.0 3.8 2.0 3.7 2.3, 5
Bouts lasting +30 min 0.3 0.7 0.1 0.0, 0.3 0.2a 0.3 0.0a 0, 0.3 0.4 0.7 0.3 0.0, 0.6 1.1 1.0 0.9 0.4, 1.5
Sedentary bout length at 50th percentile of sedentary time (min)
3.4 3.8 2.4 1.9, 3.2 3.0 1.8 2.7 2.2, 3.4 4.6 2.9 3.9 3.1, 5.2 7.3 3.9 6.4 4.8, 8.5
Bouts were defined as minimum period of sedentary time without allowing any interruption; SD, standard deviation; IQR, interquartile range a
not different to 7 years;b
not different to 12 years
Internationa
lJournal
of
Behavio
ral
Nutrition
and
Physical
Activity
(2016) 13:88
Page
3
of
Statistical analyses
Data were tested for normality and found to be skewed. Differences in sedentary time and sedentary fragmenta-tion between time points were examined using the Friedman test. In addition, differences between boys and girls were examined using the Wilcoxon signed rank tests. Differences between changes in sedentary behavior among the least sedentary versus the most sedentary in-dividuals at baseline were assessed using Kruskal-Wallis rank test.
Individual trajectories of change in percentage of time sedentary and fragmentation of sedentary behavior (i.e.
bouts per hour of sedentary time) were described using random-effects models with linear splines. Time spent sedentary and sedentary fragmentation were repeatedly measured during four follow-up periods, hence multilevel models with two levels (follow-up period [level 1] within each child [level 2]) were used. These models estimate individual-specific trajectories with no restriction on the number of measures, account for the correlation between repeated measures on the same child and allow for a change in scale and variation over time [16, 17]. Linear splines were used, with knot points at 9y and 12y, to factor in that the changes may not be constant over the full
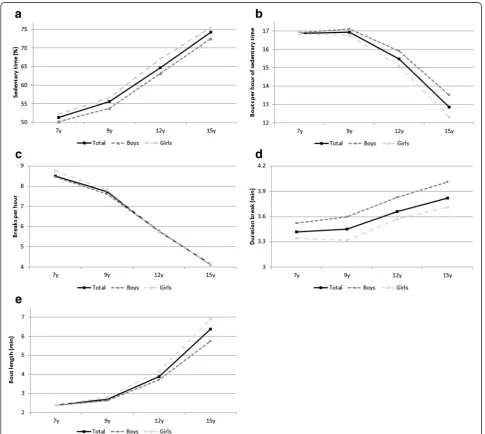
Fig. 1Changes in sedentary behavior from ages 7 to 15 years (median, unadjusted for seasonality).a. changes in % sedentary time;b. change in sedentary bouts per sedentary hour;c. change in breaks/hour;d. change in average duration of break;e. duration of sedentary bout at 50 % of total sedentary time
[image:4.595.56.542.258.692.2]follow-up time period. In this cohort, small but significant seasonal differences in objectively measured sedentary behavior have been observed [9, 18, 19], therefore adjust-ment for season of measureadjust-ment was included. The final estimated individual trajectories (for percentage of seden-tary time and sedenseden-tary fragmentation) were allowed to differ between boys and girls, have a random intercept, allowed to vary with age (random slope over time) and in-cluded an indicator variable (as a fixed effect) to account for differing season of measurement. Tracking of seden-tary behavior was examined using Spearman’s correl-ation coefficients. Tracking coefficients <0.30, 0.30-0.60 and >0.60 were classified as low, moderate or good, re-spectively [20]. All analyses were performed using STATA 12 (StataCorp, College Station, Texas, USA) and trajectories were modelled in MLwiN version 2.33 [21], which was called from Stata version 12 using the runml-win command.
Results
Participant characteristics
Participant characteristics are described in Table 1. At 7y, 9y, 12y and 15y of age a total of 507, 510, 425 and 310 participants provided valid accelerometer measurements, respectively.
Longitudinal changes in sedentary time
Median sedentary time increased every year from 51.3 % (interquartile range 46.4-56.1) per day at baseline (346.5 min/day) to 74.2 % (69.3–78.4) at 15y (535.4 min/ day; p< 0.05). Changes in median sedentary time are shown in Fig. 1a. Briefly, sedentary time increased by 4.2 % (-0.3-8.6) for 7y to 9y (31.0 min/day), 9.2 % (4.8– 13.5) for 9y to 12y (95 min/day), 8.8 % (4.4–12.7) for 12y to 15y (58 min/day). On average sedentary time in-creased more in girls than in boys (22.8 % versus 22.2 %) however this was not significant (p= 0.70).
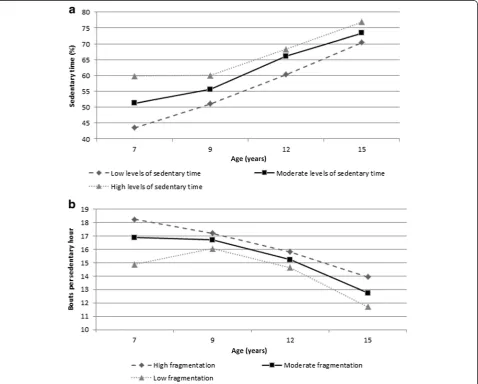
[image:5.595.60.539.321.705.2]Sedentary time increased more in the least sedentary group compared to the most sedentary group between ages 7y and 9y (6.7 %; 3.3–11.9 versus 0.07 %; -3.6-5.6) and between 12y and 15y (10.3 %; 5.9–15.6 versus 8.0 %; 4.5–11.9; Fig. 2).
Trajectory modelling of percentage time sedentary showed non-linear changes as well as sex differences in change over time. For both boys and girls mean per-centage sedentary time increased with age adjusting for season of measurement (Fig. 3a). The predicted mean percentage time sedentary at 7y was 47.05 % (SD 4.41) for boys and was 48.62 % (4.18) for girls. Between 7y and 9y the rate of change in mean per-centage time sedentary was 1.79 (0.17) for boys and 2.14 (0.17) for girls. Between 9y to 12y there was a steeper rate of increase (3.45; SD 0.17 for boys and 3.78; SD 0.16 for girls), followed by a slower rate of increase between 12y and 15y (1.87; SD 0.17 for boys and 1.74; SD 0.17 for girls).
Pearson’s rank order correlations are shown in Table 2. Sedentary time showed moderate tracking correlations.
Longitudinal changes in sedentary fragmentation
Sedentary fragmentation decreased over time. For ex-ample, at 7y, the median for breaks per hour was 8.6 (7.7–9.4), whereas this decreased to 4.1 (3.4–4.9) at 15y.
Changes in median fragmentation of sedentary time are shown in Fig. 1b to f. Briefly, the duration of seden-tary bouts above which 50 % of sedenseden-tary time was accu-mulated increased from 7y to 15y. In addition, the number of breaks per hour decreased over time as did the number of bouts per hour of sedentary time. On average the number of breaks per hour (-4.4 versus -4.6 breaks/hour for boys and girls, respectively; p=0.10) as well as the bouts per sedentary hour (-3.4 versus -4.5 bouts per sedentary hour for boys and girls, respectively; p= 0.00) decreased more in girls than in boys.
Trajectory modelling of sedentary fragmentation showed non-linear changes as well as sex differences in change over time (Fig. 3b). The predicted mean frag-mentation of sedentary time at 7y was 16.46 (SD 0.41) for boys and was 16.57 (0.39) for girls. Mean fragmenta-tion of sedentary behavior decreased over time for both boys and girls, however, with differing rates of change (Fig. 3b). Between ages 7y and 9y fragmentation de-creased at a rate of -0.01 (0.13) for boys and -0.35 for girls (0.13). Between 9y and 12y a faster rate of decline was observed (-0.99; SD 0.13 for boys and -1.43; SD 0.13 for girls), followed by a slower rate of decline between 12y and 15y (-0.31; SD 0.13 for boys and -0.50; SD 0.13 for girls).
Pearson's rank order correlations for tracking sed-entary fragmentation are shown in Table 2. Most sedentary fragmentation variables showed moderate correlations.
Discussion
Main findings
The current study found high levels of objectively mea-sured sedentary time at age 7y, just over half of the wak-ing day was spent sedentary with increases in sedentary time at age 9y, 12y and 15y so that by 15y typical seden-tary time exceeded over 75 % of the waking day (more than US and Canadian adults) [22, 23]. On average, daily sedentary time increased by around 24 min per year. Levels of sedentary time in US and Canadian adults (i.e. 60–70 % of their waking day) in national surveys, mea-sured using the same methods, were similar to those of the GMS cohort participants by age 12y [22, 23]. Seden-tary fragmentation also changed significantly and ad-versely with age, with a decrease in the number of breaks per hour as well as a decrease in bouts per hour of sedentary time from age 7y to 15y. We found medians of 16.9 bouts of sedentary behavior per hour of seden-tary time at age 7y and 12.9 at age 15y. This study re-ported low to moderate tracking coefficients for time
Fig. 3a. Average trajectory of percent daily time sedentary over age by sex (adjusted for seasonality).b. Average trajectory of sedentary fragmentation (sedentary bouts per hour of sedentary time) over age by sex (adjusted for seasonality)
[image:6.595.56.291.369.685.2]spent sedentary and fragmentation of sedentary behavior from childhood into adolescence. However, the gap be-tween participants in the lowest and highest tertiles of sedentary time decreased with age (Fig. 2). In addition, the rate of changes was non-linear and different between boys and girls.
Comparison with other studies
Since no previous studies have examined changes in ob-jectively measured sedentary time and sedentary frag-mentation longitudinally over such an extensive period of childhood and adolescence, and in a contemporary cohort, comparable data are limited. On average, changes in sedentary time and tracking coefficients are similar to those reported previously [4, 6]. A recent study combining data from 20 studies (of which 7 were longitudinal) reported a 20–25 % change in sedentary time between ages 5y–6y and ages 15–16y [24]. These levels are very similar to the results in the current study which show an increase of approximately 22 % of seden-tary time between ages 7y and 15y. In addition, the study by Cooper et al. (2015) reported significant differences in sedentary behavior between boys and girls and this was confirmed by the current study [24]. In addition, the rate of change in sedentary behavior differed slightly be-tween boys and girls. In the present study participants’ sedentary time increased on average by 24 min per day per year. This finding is slightly lower than the increase reported in a recent systematic review which reported a weighted average change per year of 30 min/day [6]. The systematic review noted differences between studies, with some studies reporting less change over time. These differences might be due to age group differences, follow up duration as well as methods used to assess sedentary time. For example, the present study has shown that the rate of change in sedentary time appears
different during different stages of childhood and adoles-cence. This means studies examining change from age 7y to 10y might report slightly different increases in sed-entary time per year than studies examining change be-tween 12y and 15y of age.
The current study found the largest increase in seden-tary behavior happened from age 9y to 12y. This contra-dicts findings of previous studies using less contemporary birth cohorts which reported a steeper rate of increase in sedentary time in late adolescents compared to early adolescents (i.e. after the transition to secondary school) [25, 26]. A possible explanation for the difference between these studies and the results found in the current study is the decade (i.e. 1990’s ver-sus 2000) in which the cohorts were set up. The current cohort was born 10 years later than cohorts in the previ-ous studies. With the rapid increase in the availability and accessibility of modern technology (e.g. in the UK 57 % of families had internet access in 2006 compared to 86 % in 2015) [27] it may be that children in the GMS would have had access to these modern technolo-gies from a younger age affecting their sedentary behav-ior pattern earlier on.
[image:7.595.65.540.99.283.2]Based on the results of this study it is impossible to pinpoint exactly why changes in sedentary time and fragmentation occurred during this period. It may be that the 9–12y period is one in which students become more engaged with electronic media. If this is found to be true it may be important to raise awareness of the negative effects of electronic media use from early on. Also, the 9–12y period spans the transition from pri-mary to secondary education and this transition from one environment (primary school) to another (secondary school) may affect students’ behavior. This may indicate that targeting specific domains (e.g. the secondary school environment) may be needed.
Table 2Tracking of daily sedentary behavior from age 7 years to 15 years (Spearman’s coefficient)
Variable 7–9y
(n= 402)
7–12y (n= 326)
7–15y (n= 240)
9–12y (n =353)
9–15y (n= 263)
12–15y (n= 262)
Sedentary time (min ) 0.432 0.356 0.277 0.435 0.344 0.459
Sedentary time (%/d) 0.559 0.427 0.428 0.469 0.420 0.503
Duration break (min) 0.565 0.277 0.214 0.288 0.204 0.485
Breaks per hour > 1 min 0.447 0.371 0.362 0.389 0.347 0.488
Bouts per hour of sedentary time 0.310 0.262 0.300 0.385 0.313 0.485
Bouts lasting 1–4 min 0.290 0.159 0.006 0.346 0.117 0.410
Bouts lasting 5–9 min 0.457 0.370 0.089 0.418 0.087 0.313
Bouts lasting 10–14 min 0.443 0.400 0.311 0.399 0.236 0.405
Bouts lasting 15–29 min 0.376 0.304 0.274 0.381 0.325 0.517
Bouts lasting +30 min 0.126 0.033 0.164 0.222 0.061 0.325
Sedentary bout length at 50th percentile of sedentary time (min)
0.414 0.392 0.371 0.411 0.332 0.455
It remains unclear as to which behavior is displaced by the increase in sedentary time with age. In this cohort the increase in sedentary behavior has been larger than the decrease time spent in moderate-to-vigorous inten-sity physical activity [10] indicating that this behavior is probably not only replacing physical activity but might also impact other behaviors such as light physical activ-ity or sleep. Mitchell et al. (2012) reported the increase in sedentary time was almost equal to the decrease in light intensity physical activity suggesting sedentary time replaces light intensity physical activity [7]. However, a recent meta-analysis (of largely cross-sectional studies with subjective measurement methods) has shown that while sedentary time and total physical activity are in-versely associated, the association is weak [28].
This is the first study examining change in sedentary fragmentation and the difference between the rate of change in sedentary behavior of the least sedentary ver-sus the most sedentary children. While sedentary time appears to track from childhood into adolescence (i.e. the most sedentary children remain the most sedentary group as adolescents, Table 2) it is worth noting that the gap between the least sedentary and most sedentary chil-dren decreased (Fig. 2). This highlights the need to tar-get all children in order to reduce the age-related changes in sedentary behavior, and not just the most
sedentary group. Also, the gap between the most and least sedentary groups decreased most between the ages 7y and 9y and therefore it may be worth targeting seden-tary time as early as age 7y.
Study strengths and limitations
The inclusion of multiple follow-ups, the relatively large sample size, fairly representative sample [8], and the use of objective methods to measure sedentary behavior are strengths of the current study. In addition, thus far no study has reported on the absolute amounts and the de-gree of tracking of sedentary fragmentation which makes this study very novel.
A number of limitations of the present study should be noted too. There was a fair amount of loss to follow-up. However, there were no differences between BMI, socio-economic status (SES) or sedentary time/fragmen-tation at baseline between included participants and ex-cluded/lost to follow-up participants (Table 3). No differences were found in change in sedentary time/frag-mentation with age between participants who provided valid data for all four data collection points and those who had 1 or 2 data points missing (Table 4), and last the analyses are relatively robust to attrition. In addition, even though SES of the GMS cohort is representative of the SES for families living in the northern parts of Eng-land and ScotEng-land, generalisability of our findings to other population groups is not clear and should be established by comparison with future studies. Last, this study focused on overall sedentary behavior and did not examine the difference in change in sedentary behavior during school days and non-school days as this was be-yond the scope of the current study. It is therefore not possible to say at what point during the day the biggest changes occur.
Conclusions
[image:8.595.56.291.110.245.2]In this sample of English children, sedentary time was high and increased non-linearly from 7y to 15y of age. The largest increase in sedentary time and decrease in sedentary fragmentation was noted from age 9y to 12y,
Table 4Change in sedentary behavior for participants providing data at all 4 time points versus participants with 1 or 2 missing
data points (mean, SD)
Variable 7–9y (Mean, SD) 7–12y 7–15y 9–12y 9–15y 12–15y
All (n199)
Missing (n203)
All (n199)
Missing (n127)
All (n199)
Missing (n41)
All (n199)
Missing (n154)
All (n199)
Missing (n64)
All (n199)
Missing (n63)
Sedentary time (min) 33.1 (64.4) 28.9 (71.0) 126.1 (85.6) 111.4 (93.8) 191.9 (95.5) 166.8 (81.6) 93.0 (76.9) 93.3 (87.6) 158.8 (85.1) 153.4 (77.6) 65.8 (90.7) 59.5 (90.3)
Sedentary time (%/d) 4.6 (6.3) 3.9 (6.9) 13.6 (8.2) 13.5 (9.1) 22.3 (7.9) 21.4 (6.1) 9.0 (7.7) 9.8 (8.3) 17.7 (7.4) 18.5 (5.2) 8.7 (7.4) 8.7 (7.2)
Bouts per hour of sedentary time −0.22 (1.6) 0.06 (1.9) −1.6 (2.4) −1.4 (2.8) −4.0 (2.4) −4.4 (2.6) −1.3 (2.2) −1.5 (2.2) −3.8 (2.3) −4.0 (2.5) −2.4 (2.3) −2.7 (3.0)
[image:8.595.57.539.619.724.2]p> 0.05 for all
Table 3Participants characteristics of follow up versus lost
to follow up
Variable Follow up at age 15y n= 240
(130 girls, 110 boys)
Lost to follow up at age 15y n= 267
(122 girls, 145 boys)
Height (cm) 124.4 125.3
Weight (kg) 26.09 26.60
BMI (kg/m2) 16.71 16.83
SES 2.81 3.01
Sedentary time (%/day)
51.4 51.7
Bouts per hour of sedentary time
16.8 16.5
SES, socio economic status
but across all time points changes in sedentary behavior were adverse: the amount of time spent sedentary in-creased; the fragmentation of sedentary decreased. In adults, it is now well established that high levels of sed-entary time and low levels of sedsed-entary fragmentation are associated with increased risk of all-cause mortality, and specifically increased risk of some cancers and car-diometabolic disease [29, 30]. This recent evidence on sedentary behavior and health in adults has led to an in-creasing emphasis on policy and research interventions to modify sedentary behavior during childhood, and such interventions can be informed by the evidence from the present study. The stability of sedentary time and breaks in sedentary behavior was moderate from age 7y to 15y. This means there is a certain degree of vari-ance in the student’s behavior over this period. This highlights the potential for interventions targeting change in these behaviors. In addition, a larger increase in sedentary time was noted in the children who spent less time sedentary at age 7y. Sedentary behavior became less fragmented as children grew older. The present study suggests that the origin of unhealthy sedentary be-haviors in adults may be in childhood and adolescence, and so there is an urgent need for interventions to target sedentary behavior, decreasing overall sedentary time and increasing the fragmentation of sedentary behavior during childhood and into adolescence.
Abbreviations
IQR, interquartile range; SD, standard deviation; SES, socio-economic status
Acknowledgements
We appreciate the support of Gateshead Health National Health Service Foundation Trust, Gateshead Education Authority, and local schools. We thank members of the research team for their effort. We especially thank the families and children who participated in the Gateshead Millennium Study. We are also grateful to Dr Laura Howe, senior research fellow in epidemiology at the School of Social and Community Medicine, Bristol University, UK for her help, advice and support of the multilevel linear spline modelling and use of MLwiN.
Funding
This work was supported by grants from the Scottish Government Chief Scientist Office (grant CZH/4/484 and CZH/4/979), the UK National Prevention Research Initiative (GO501306), and Gateshead PCT. The cohort was first set up with funding from the Henry Smith Charity and Sport Aiding Medical Research for Kids. AA is funded by the National Institute of Health Research as an NIHR Research Professor.
Availability of data and materials
The dataset supporting the conclusions of this article will be available in the University of Strathclyde PURE repository.
Authors’contributions
XJ was involved in the acquisition of the data, had the primary responsibility of analysis and interpretation of the data and drafted the initial manuscript. KM carried out the statistical analysis, contributed to the interpretation of the data and reviewed and revised the manuscript. LB and JKR have been involved in the acquisition of the data and contributed to the interpretation of the data and reviewed and revised the manuscript. KP, JJR, AS and MP collaboratively designed the research and each contributed to the interpretation of the data and reviewed and revised the manuscript. All authors read and approved the final manuscript.
Competing interest
The authors declare that they have no competing interests that may be relevant to the submitted work.
Consent for publication Not applicable
Ethics approval and consent to participate
The study was approved by the Gateshead and South Tyneside Local National Health Service Research Ethics Committee for data collection at 7y and by the Newcastle University Faculty of Medical Sciences Ethics Committee for the 9y, 12y and 15y data collections. Informed written consent was obtained from the parent/guardian of each child, and children provided their assent to participation.
Author details
1University of Strathclyde, School of Psychological Science and Health,
Glasgow, Scotland, UK.2Institute of Health & Society, Newcastle University, Newcastle upon Tyne, England, UK.3Human Nutrition Research Centre, Newcastle University, Newcastle upon Tyne, England, UK.
Received: 6 May 2016 Accepted: 20 July 2016
References
1. Healy GN, Matthews CE, Dunstan DW, Winkler EA, Owen N. Sedentary time and cardio-metabolic biomarkers in US adults: NHANES 2003–06. Eur Heart J. 2011;32:590–7.
2. Healy GN, Dunstan DW, Salmon J, et al. Breaks in sedentary time beneficial associations with metabolic risk. Diabetes Care. 2008;31:661–6.
3. Cliff DP, Hesketh K, Vella SA, et al. Objectively measured sedentary behaviour and health and development in children and adolescents: systematic review and meta‐analysis. Obes Rev. 2016;17:330–44. 4. Biddle SJH, Pearson N, Ross GM, Braithwaite R. Tracking of sedentary
behaviours of young people: A systematic review. Prev Med. 2010;51:345–51. 5. Nelson M, Neumark-Stzainer D, Hannan PJ, Sirard JR, Story M. Longitudinal
and Secular Trends in Physical Activity and Sedentary Behavior During Adolescence. Pediatr. 2006;118:e1627–e1634.
6. Tanaka C, Reilly JJ, Huang WY. Longitudinal changes in objectively measured sedentary behaviour and their relationship with adiposity in children and adolescents: systematic review and evidence appraisal. Obes Rev. 2014;15:791–803.
7. Mitchell JA, Pate RR, Dowda M, et al. A prospective study of sedentary behavior in a large cohort of youth. Med Sci Sports Exerc. 2012;44:1081–7. 8. Parkinson KN, Pearce MS, Dale A, et al. Cohort profile: the Gateshead
Millennium Study. Int J Epidemiol. 2011;40:308–17.
9. King AC, Parkinson KN, Adamson AJ, et al. Correlates of objectively measured physical activity and sedentary behaviour in English children. Eur J Pub Health. 2011;21:424–31.
10. Basterfield L, Adamson AJ, Frary JK, Parkinson KN, Pearce MS, Reilly JJ. Longitudinal study of physical activity and sedentary behavior in children. Pediatr. 2011;127:e24–30.
11. Basterfield L, Adamson AJ, Parkinson KN, Maute U, Li P, Reilly JJ. Surveillance of physical activity in the UK is flawed: validation of the Health Survey for England Physical Activity Questionnaire. Arch Dis Child. 2008;93:1054–8. 12. Janssen X, Basterfield L, Parkinson KN, et al. Objective measurement of
sedentary behavior: impact of non-wear time rules on changes in sedentary time. BMC Public Health. 2015;15:504.
13. Basterfield L, Adamson AJ, Pearce MS, Reilly JJ. Stability of habitual physical activity and sedentary behavior monitoring by accelerometry in 6-to 8-year-olds. J Phys Act Health. 2011;8:543–7.
14. Ridgers ND, Salmon J, Ridley K, O’Connell E, Arundell L, Timperio A. Agreement between activPAL and ActiGraph for assessing children’s sedentary time. Int J Behav Nutr Phys Act. 2012;9:7.
15. Altenburg TM, de Niet M, Verloigne M, et al. Occurrence and duration of various operational definitions of sedentary bouts and cross-sectional associations with cardiometabolic health indicators: The ENERGY-project. Prev Med. 2015;71:101–6.
17. Howe LD, Tilling K, Matijasevich A, et al. Linear spline multilevel models for summarising childhood growth trajectories: a guide to their application using examples from five birth cohorts. Stat Methods Med Res. 2013. [Epub ahead of print]
18. Rich C, Griffiths LJ, Dezateux C. Seasonal variation in accelerometer-determined sedentary behaviour and physical activity in children: a review. Int J Behav Nutr Phys Act. 2012;9:49.
19. Pearce MS, Basterfield L, Mann KD, Parkinson KN, Adamson AJ. Early predictors of objectively measured physical activity and sedentary behaviour in 8–10 year old children: the Gateshead Millennium Study. Plos One. 2012;7:e37975.
20. Malina RM. Adherence to physical activity from childhood to adulthood: a perspective from tracking studies. Quest. 2001;53:346–55.
21. Rasbash J, Charlton C, Browne WJ, Healy M, Cameron B. MLwiN Version 2.1. Centre for multilevel modelling, University of Bristol. 2009. http://www. bristol.ac.uk/cmm/software/mlwin/refs.html.
22. Matthews CE, Chen KY, Freedson PS, et al. Amount of time spent in sedentary behaviors in the United States, 2003–2004. Am J Epidemiol. 2008;167:875–81.
23. Colley RC, Garriguet D, Janssen I, Craig CL, Clarke J, Tremblay MS. Physical activity of Canadian adults: accelerometer results from the 2007 to 2009 Canadian Health Measures Survey. Health Rep. 2011;22:7.
24. Cooper AR, Goodman A, Page AS, et al. Objectively measured physical activity and sedentary time in youth: the International children’s accelerometry database (ICAD). Int J Behav Nutr Phys Act. 2015;12:113. 25. Kwon S, Burns TL, Levy SM, Janz KF. Which contributes more to childhood
adiposity-high levels of sedentarism or low levels of moderate-through-vigorous physical activity? The Iowa Bone Development Study. J Pediatr. 2013;162:1169–74.
26. Mitchell J, Pate R, Beets M, Nader P. Time spent in sedentary behavior and changes in childhood BMI: a longitudinal study from ages 9 to 15 years. Int J Obes. 2012;37:54–60.
27. Office for National Statistics. Internet Access - Households and Individuals: 2014. London: Office for National Statistics; 2015. p. 11.
28. Pearson N, Braithwaite R, Biddle S, Sluijs E, Atkin A. Associations between sedentary behaviour and physical activity in children and adolescents: a meta‐analysis. Obes Rev. 2014;15:666–75.
29. Wilmot EG, Edwardson CL, Achana FA, et al. Sedentary time in adults and the association with diabetes, cardiovascular disease and death: systematic review and meta-analysis. Diabetologia. 2012;55:2895–905.
30. Thorp AA, Owen N, Neuhaus M, Dunstan DW. Sedentary behaviors and subsequent health outcomes in adults: a systematic review of longitudinal studies, 1996–2011. Am J Prev Med. 2011;41:207–15.
• We accept pre-submission inquiries
• Our selector tool helps you to find the most relevant journal
• We provide round the clock customer support
• Convenient online submission
• Thorough peer review
• Inclusion in PubMed and all major indexing services • Maximum visibility for your research
Submit your manuscript at www.biomedcentral.com/submit