City, University of London Institutional Repository
Citation
:
Siesakul, B. T., Gkoktsi, K. & Giaralis, A. (2015). Compressive power spectrum
sensing for vibration-based output-only system identification of structural systems in the
presence of noise. Compressive Sensing IV, 9484, 94840K. doi: 10.1117/12.2177162
This is the accepted version of the paper.
This version of the publication may differ from the final published
version.
Permanent repository link:
http://openaccess.city.ac.uk/13617/
Link to published version
:
http://dx.doi.org/10.1117/12.2177162
Copyright and reuse:
City Research Online aims to make research
outputs of City, University of London available to a wider audience.
Copyright and Moral Rights remain with the author(s) and/or copyright
holders. URLs from City Research Online may be freely distributed and
linked to.
Compressive power spectrum sensing for vibration-based output-only
system identification of structural systems in the presence of noise
Bamrung Tau Siesakul
a, Kyriaki Gkoktsi
a, Agathoklis Giaralis*
aa
Department of Civil Engineering, City University London, Northampton Square, EC1V 0HB,
London, UK
ABSTRACT
Motivated by the need to reduce monetary and energy consumption costs of wireless sensor networks in undertaking output-only/operational modal analysis of engineering structures, this paper considers a multi-coset analog-to-information converter for structural system identification from acceleration response signals of white noise excited linear damped structures sampled at sub-Nyquist rates. The underlying natural frequencies, peak gains in the frequency domain, and critical damping ratios of the vibrating structures are estimated directly from the sub-Nyquist measurements and, therefore, the computationally demanding signal reconstruction step is by-passed. This is accomplished by first employing a power spectrum blind sampling (PSBS) technique for multi-band wide sense stationary stochastic processes in conjunction with deterministic non-uniform multi-coset sampling patterns derived from solving a weighted least square optimization problem. Next, modal properties are derived by the standard frequency domain peak picking algorithm. Special attention is focused on assessing the potential of the adopted PSBS technique, which poses no sparsity requirements to the sensed signals, to derive accurate estimates of modal structural system properties from noisy sub-Nyquist measurements. To this aim, sub-sub-Nyquist sampled acceleration response signals corrupted by various levels of additive white noise pertaining to a benchmark space truss structure with closely spaced natural frequencies are obtained within an efficient Monte Carlo simulation-based framework. Accurate estimates of natural frequencies and reasonable estimates of local peak spectral ordinates and critical damping ratios are derived from measurements sampled at about 70% below the Nyquist rate and for SNR as low as 0db demonstrating that the adopted approach enjoys noise immunity.
Keywords: Sub-Nyquist multi-coset sampling, Multi-band stationary stochastic processes, Power spectrum blind estimation, Output-only system identification, ARMA filter, analog-to-information converter, additive white noise.
1.
INTRODUCTION
Operational modal analysis (OMA), also termed as output-only system identification, is historically, the first, and, arguably, the most widely used technique for global condition assessment, design verification, and health monitoring of civil engineering structures and structural components1,2. OMA relies on linear system identification and modal testing
concepts and techniques3 to derive structural dynamic/modal properties (i.e., natural frequencies, damping ratios, and
mode shapes) by acquiring and processing low-amplitude response (output) acceleration signals from linearly vibrating structures due to ambient noise excitation (input). In practice, the input/excitation is not measured but is assumed to be sufficiently white (i.e., have a flat spectrum over a range of frequencies within which the structural natural frequencies of interest lie) by allowing for a long enough observation time. Consequently, ignoring any additive noise, the (analog) acceleration signals considered in OMA are naturally sparse in the frequency domain since their energy is concentrated around the natural frequencies of the structural system at which (for lightly damped structures) a prominent local peak in the spectrum is attained. From a theoretical viewpoint, a plethora of system/modal identification algorithms and signal processing techniques have been considered2,4,5 to address the two major challenges of OMA: (i) the modal coupling
effect3 (i.e., the identification of closely spaced natural frequencies and the separation of the corresponding mode shapes)
commonly encountered in higher modes of vibration1, and (ii) bias errors due to environmental conditions, measurement
noise, and model uncertainties4. From a technological viewpoint, the consideration of wireless sensor networks (WSNs)
has been an important development in OMA in the past 15 years6,7. This is because WSNs allow for less obtrusive and
more economical and rapid implementation of OMA compared to arrays of tethered sensors.
To this end, significant research effort has been devoted to develop low energy-consuming wireless sensors while maintaining their cost and sophistication at a reasonable level6. Specifically, in a typical WSN deployment for OMA,
requirements for energy harvesting and/or frequency of battery replacement), since data transmission is the most power consuming operation. This step commonly involves off-line lossy or lossless data compression of stored discrete-time signals acquired at an analog-to-digital converter (ADC) sampling by, at least, twice the Nyquist rate. The compressed data are transmitted to a base station where they are de-compressed to reconstruct the originally acquired signals (or an estimate of them in case of lossy compression). These signals are then further processed by standard OMA algorithms to derive structural dynamical properties. Despite these efforts, current wireless sensors require battery replacement at intervals of few weeks to few months, depending on various factors such as the sampling frequency, the duration of each monitoring interval, the on-board hardware and software to be executed.
In this respect, quite recently, certain compressive sensing (CS) or, in general, sub-Nyquist sampling techniques have been considered by various researchers (including the authors) in undertaking OMA operations8-11, recognizing that such
techniques can potentially minimize monetary and energy consumption costs in WSNs12. Specifically, O’Connor et al.10
reported significantly reduced energy consumption in a long-term field deployment of wireless sensors acquiring randomly sampled sub-Nyquist measurements compared to conventional (Nyquist sampling) sensors. In this application, the acquired compressed sensed signals were transmitted to a base station and reconstructed in the time-domain (at Nyquist rate) by means of a standard CS reconstruction algorithm. The reconstructed signals from each channel/sensors were finally Fourier-transformed to obtain frequency response functions (FRFs) and the mode shapes were derived using the standard frequency domain decomposition algorithm of OMA13. Following a similar CS-based strategy, that is,
considering reconstructed Nyquist sampled signals in the time-domain from randomly sampled sub-Nyquist measurements, Yang and Nagarajaiah11 explored the potential of CS-based OMA in conjunction with blind source
separation for mode shape and natural frequency estimation. In a different study, Park et al.8 recognized that for the
purposes of modal system identification of linear systems, signal reconstruction in time-domain from CS measurements is not necessary. In this regard, they considered a singular value decomposition based algorithm to retrieve mode shapes directly from sub-Nyquist non-uniform random measurements assumed to be acquired by means of a particular CS-based analog-to-information (AIC) sampling device, namely the random demodulator (RD)14. Note that the RD assumes a
multi-tone analog signal model attaining a spectrum with a number of “spikes” (harmonics) and zero elsewhere. In the theory of structural dynamics, such a signal model is consistent with the (deterministic) response of free oscillating non-decaying (i.e., undamped) structures. Indeed, the analytical work of Park et al.8 rely on the above assumption, which is
not in alignment with the typical analog OMA signals (multi-band wide sense stationary random signals/ stochastic processes). Still, reasonably accurate results in terms of mode shapes were derived from noisy field recorded data pertaining to a specific bridge structure using the proposed algorithm for system identification.
Notably, the above discussed CS-based approaches for OMA are sensitive to added noise in the CS measurements since they rely on signal sparsity considerations15. It has been shown that a signal reconstruction error of approximately 3 dB
of signal-to-noise ratio (SNR) for each halving of the number of measurements (per octave of subsampling) occurs which implies signal noise amplification at higher compression rates. In fact, a trade-off between noise level and sampling rate exists for CS-based AICs (i.e., random sampling assuming analog signal sparsity): within noisy environments (low SNRs), faster sampling rates and, therefore, an increased number of measurements are required to extract the underlying signal information16.
Inspired by recent developments in power spectrum blind sampling (PSBS) driven mainly by applications in telecommunications and especially by cognitive radio17, the authors9 considered the use of an AIC device18
implementing deterministic non-uniform periodic multi-coset sampling19 to acquire sub-Nyquist acceleration
measurements from linear white-noise excited structural systems. Next, a PSBS approach that does not require any signal sparsity assumption18,20 has been applied to approximate the underlying FRFs directly from the sub-Nyquist
measurements. Finally, the standard “peak picking” in the frequency domain OMA algorithm is applied to extract the useful information from these FRFs. That is, the central frequency of each spiky “occupied” band in the spectrum corresponding to a natural frequency of the system, the width of the occupied bands associated with structural damping, and the local peak values of the occupied bands associated with mode shapes which can be retrieved in a multi-channel setting. It is noted in passing that in cognitive radio applications the goal is to efficiently detect unoccupied bands in a wide spectral range of telecommunication signals; a relatively simple task compared to the retrieval of modal properties in OMA. Importantly, the above approach, adopted in this paper as well, does not require signal reconstruction and does not pose any sparsity requirements to the analog signal. Therefore, it is expected to be insensitive to added noise to the sub-Nyquist measurements offering an important advantage over the CS-based random sampling considered in the previously reviewed approaches8,10,11. In this regard, this paper furnishes novel numerical results to assess the potential
sub-Nyquist multi-coset samples. To this aim, a benchmark space truss structure with closely-spaced natural frequencies is considered as a testbed21 together with a novel frequency domain simulation-based framework which allows for the
efficient generation of wide sense stationary structural response acceleration signals with additive noise consistent with the assumptions of OMA.
The remainder of the paper is organized as follows. Section 2 introduces the adopted AIC device and multi-coset sub-Nyquist sampling strategy for stochastic processes (random signals). Section 3 reviews the mathematical details to accomplish PSBS directly from the coset sub-Nyquist measurements, while section 4 outlines the optimization problem that needs to be solved to design efficient deterministic multi-coset sampling patterns. Section 5 provides pertinent numerical results to assess the robustness of the adopted approach to noise and, lastly, section 6 summarizes conclusions and points to directions for future work.
2.
MULTI-COSET SUB-NYQUIST SAMPLING
Multi-coset Sampling Strategy and Device
Let x(t) be a continuous in time t real-valued wide-sense-stationary random signal (or stochastic process) characterized in the frequency domain by the power spectrum Px(ω) band-limited by 2π/T. It is desired to sample x(t) at a rate lower than the Nyquist sampling rate 1/Τ (in Hz), and still be able to obtain a useful estimate of the power spectrum Px(ω). To this aim, the multi-coset sampling strategy is herein adopted19, according to which the grid of Nyquist samples x(nT) is
divided into blocks of N consecutive samples and from each block M (<N) Nyquist-rate samples are selected. The resulting sampling is periodic with period N; non-uniform since any subset of M samples may be selected from a total of N Nyquist-rate samples within each block; and deterministic since the position of the M samples on the Nyquist grid of samples x(nT) is defined a priori and applies to all considered blocks. The above sampling strategy can be implemented by utilizing M interleaved ADC units operating at a sampling rate 1/(NT) as discussed in Ariananda and Leus18. A
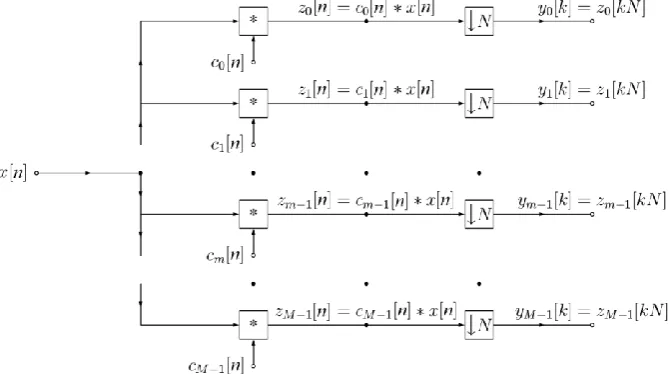
[image:4.595.131.466.405.592.2]discrete-time model of such a sampling device is shown in Figure 1 in which the discrete-time signal x[n]= x(n/T) enters M branches and at each m branch (m= 0,1,…,M-1), the signal is convolved (filtered) by an N-length sequence cm[n] and down-sampled by N.
Figure 1. Discrete-time model of the considered AIC multi-coset sampling device18.
The selection of M samples (sampling pattern) within each block is governed by the coefficients cm[n] of the filter written as
1, ,
[ ]
0, ,
m m
m
n n
c n
n n
(1)
1 2, 1 2.
m m
n n m m (2)
The output of the m-th branch is given by
[ ] [ ],
m m
y k z kN (3)
where
z
m[ ]
is expressed as0 1
[ ] [ ] [ ].
m m
k N
z n c k x n k
(4)Relation of the Input and Output Correlation Functions
Consider the cross-correlation function between the output sequences of the different branches of the device in Figure 1 and the autocorrelation function of the input signal to the device given by
1 2
1, 2[ ] Ey [ ] [ ] ,
m m
y y m m
r k y l y lk (5)
and
x
[ ] E [ ] [ ] ,
x
r n x m x m n (6)
respectively, where Ea{·} is the mathematical expectation operator with respect to a and the “*” superscript denotes
complex conjugation. Further, consider the pattern cross-correlation function between the different sampling patterns of each branch of the same device expressed as
1 2
1 2
0
,
1
[ ] [ ] [ ].
m m
c c m m
k N
r n c k c k n
(7)Substituting Eq. (1) into Eq. (7) yields
2 1 1, 2[ ] [ ( )].
m m
c c m m
r n n n n (8)
where δ[n]=1 for n=0 and δ[n]=0 for n≠0.
It can be shown that the following relationship holds18
1 0
[ ] [ ] [ ],
y c x
l
k l k l
r R r (9)
where ry[k] is the M2-by-1 vector collecting the output cross-correlation functions
1, 2
m m
y y
r between the M branches of the
considered sampling device evaluated at index k, that is,
0 0 0 1 1 0 1 1
T
, , , ,
[ ] [ ] M [ ] [ ] M M [ ] ,
y k ry y k ry y k ry y k ry y k
r (10)
where the “T” superscript denotes matrix transposition.
x
r [n] is the N-by-1 vector collecting the input autocorrelation function evaluated at certain indices as in
T[ ] [ ] [ 1] [( 1) 1] ,
x n r nNx r nNx rx n N
r (11)
and Rc[l] is the M2-by-N matrix defined as
0 0 0 1 1 0 1 1
T
, , , ,
[ ] [ ] M [ ] [ ] M M [ ] ,
cl c c l c c l c c l c c l
R r r r r (12)
1 2 1 2 1 2 1 2
T , [ ] , [ ] , [ 1] , [( 1) 1] .
m m m m m m m m
c c n c c nN c c nN c c n N
r r r r (13)
By assuming that the autocorrelation function of the input signal in Eq. (6) takes on negligible values outside the range -L ≤ k ≤ L (in practice this will always hold for some L, depending on the level of damping of the structural system being monitored), Eq. (9) can be cast in the form of3
y= c x,
r R r (14)
in which ry is the M2(2L+1)-by-1 vector defined as
T T T T
y y[0] y[ ]L y[ L] y[ 1] ,
r r r r r (15)
x
r is the N(2L+1)-by-1 vector defined as
T T T T
x x[0] x[ ]L x[ L] x[ 1] ,
r r r r r (16)
andRc is the M2(2L+1)-by-N(2L+1) matrix given as
c
[0] [1]
[1] [0]
[1] [0] ,
[1] [0] c c c c c c c c
R O O R
R R O O
R O R R
O
O O R R
(17)
where O is the zero matrix.
In the next section, an estimator of the power spectrum of the input signal x[n] is considered (and therefore of the process x(t)) derived from the cross-correlation functions between the output sequences of the M branches of the sampling device in Figure 1 upon solving Eq. (10) for rx. These cross-correlation functions are, in turn, estimated directly from the output sequences from each branch in Eq. (3). For a Q-long Nyquist sampled input signal x[n] the total number of the output measurements are only MQ/N (M<N) with M/N being the compression ratio.
3.
POWER SPECTRUM BLIND SENSING FROM SUB-NYQUIST MEASUREMENTS
Under the assumption that x[n] in Figure 1 is sampled at the Nyquist rate from a band-limited continuous-time process x(t), the power spectrum of x(t) can be expressed within the 0 ≤ ω ≤ 2π range as
i[ ] e n ,
x x
n
P r n
(18)where i 1. The above equation can be discretized using a Nyquist grid and cast in matrix-vector form as
x (2L1)N x,
s F r (19)
where F(2L1)N is the N(2L+1)-by-N(2L+1) standard discrete Fourier transform (DFT) matrix and sx is a N (2L+1)-by-1 vector given as
T
x
1 1
(0) 2 2 [(2 1) 1] .
(2 1) (2 1)
x x x
P P P L N
L N L N
s (20)
Consider the unbiased estimator of the cross-correlation function in Eq. (5) defined as
1 2
1 2
1 min 0, ,
max 0,
1
ˆm m[ ] [ ] [ ]
K k
y y m m
l k
r k y l y l k
K k
where K is the number of measurements. The following weighted least squares criterion is herein utilized
x
2
x y c x
ˆ arg min ˆ ,
W r
r r R r (22)
in which the weighted version of the Euclidean norm is given by 2 T
W
a a Wa, and W is a weighting matrix, to estimate
the vector spectrum sxof Eq. (19) by “inverting” Eq. (14) as
1
1 1x (2 1) c c c y
ˆ T T ˆ .
L N
s F R W R R W r (23)
where the “-1” superscript denotes matrix inversion. In the last equation, the (2L+1)M2-by-1 vector
y
ˆ
r is defined in a similar way as the vector ry in Eq. (15), where the cross-correlation of Eq. (5) is replaced by the estimator in Eq. (21). Although the sampling pattern correlation matrix Rc is large (i.e., of size M2(2L+1)-by-N(2L+1)), the fact that it has a
sparse structure as shown in Eq. (17) can be exploited to reduce the required computational effort to obtain the pseudo-inverse matrix in Eq. (23). For example, in the special case of the weighting matrix being the identity matrix (i.e., the weighted least squares criterion in Eq. (22) becomes the simple least squares criterion), the pseudo-inverse matrix in Eq.(23) can be given as20
-1 -1 -1 -1 -1 -1 -1
( ) [0] ( ) [1] ( ) [0]
, ( ) [1] ( ) [0] ( ) [1]
T T T T T T T T c O O
Λ α R Λ α R
O O Λ α R
(R R ) R O O
Λ α R O Λ α R Λ α R
c c c c c c c c (24)
where Λ α( ) is the N-by-N diagonal matrix with the diagonal
1 2 N
,
α (25)
in which p( )n for p= 1,2,…N is given by
2 1 2 1
1 2
1 1
0 0
( ) 1 ( ) 1 ( ) ,
r
M M
n r m m r m m
m m
n n n N n n n
n (26)
and nis the sequence of M positive integer numbers expressed as
T0 1 M 1 ,
n n n
n (27)
which defines the sampling pattern in Eq. (1).
To compute the power spectral density estimate in Eq. (23), a sampling pattern n and a weighting matrix Wneeds to be determined. This step is discussed in the next section.
4.
DESIGN OF THE MULTI-COSET SAMPLING PATTERN
Consider the M2(2L+1)-by-M2(2L+1) covariance matrix of the estimator of r
y defined as
y
ˆ Ex (ˆy E { })(x ˆy ˆy E { })x ˆy ,
T
r
C r r r r (28)
and assume that the number of branches M is known. Further, assume that the input signal x[n] is zero-mean circularly-symmetric real-valued Gaussian i.i.d. noise (note that although this assumption is unrealistic for x[n] being acceleration response of white noise excited linear structural systems, it is only considered herein to facilitate the derivation of the sampling pattern of the device in Figure 1 and is not restrictive to the class of simulated or recorded signals that can be treated by this device). Then, it can be shown that ˆ
y r
y y y
ˆ ˆ ˆ[ ] , for 0,1, , , , 1 ,
r r r k k L L
0 C C 0 (29) where y y
ˆ ˆ[ ]
r r k
C is the M2-by-M2covariance matrix given by
0 1 0
0 0 0 0 0, 0 0 1 1
0 1 1
0 0 1 0 0 0 1 1 1
y y
1 0 1 0 1 0 1 1 1
, ,
, , ,
, ,
, , , ,
4 ˆ ˆ x
, , , , ,
[0] [0] [0] [0] [0] [0]
[0] [0] [0] [0] [0] [0]
1 [ ]
[0] [0] [0] [0]
M M
M M
M M M M M M
c c c c
c c c c c c c c
c c c c
c c c c c c c c
r r
c c c c c c c c c c
r r
r r r r
r r
r r r r
k
K k
r r r r r
C
1 1, 1 . [0] [0] M M c c r (30)
By observing that
y y y y
ˆ ˆ ˆ ˆ
1
[ ] [0],
r r k K r r
K k
C C (31)
the matrix in Eq. (28) can be concisely written (and efficiently computed using any higher level programming language) as
y y y
ˆ ˆ ˆ[0] ,
r K r r
C Λ(β) C (32)
where is the Kronecker product and β is the (2L+1)-length sequence
T
1 1 1 1 1
.
1 1
K K K L K L K
β (33)
Let fWLS-MSE( )n be the normalized weighted mean square error (MSE) of the power spectrum estimator in Eq. (23). It can be shown that20
2
WLS-MSE 4 x x x E
1 x
1 1
ˆ
( ) (2 1) ( 1) E .
(2 1) r ( )
r
N
n n
f K L L L
L N
n s s
n (34)
where
E
is the Euclidean norm. The optimum design of the sampling sequence n and the weighting matrix Wused in the PSBS estimation is determined by solving the following optimization problem20
WLS-MMSE 1 0 1 1 1 ˆ arg min
( ) (n) 1,
1 {2, 3, , 1},
2 0, 1 s.t. , 2 1
{ 1, , 1},
2 {1, 2, , 2}.
r r r N n n n r M m m n N n n N
n n N M m
m M
n n n (35)where is the mathematical floor operator.The following section provides selected numerical results to illustrate the
5.
NUMERICAL ASSESSMENT
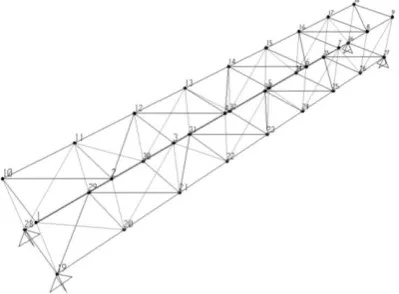
In this section, the 8-bay simply supported aluminum space truss of Figure 2 is considered to assess the applicability and effectiveness of the previously discussed PSBS approach and multi-coset sampling AIC device of Figure 1 for single-channel output-only structural system identification in the presence of additive noise. This truss structure has been used in the literature as a benchmark model for comparative assessment of vibration-based structural health monitoring algorithms21. It comprises 100 tubular cylindrical structural (truss) members; the black colored members in Figure 1 are
22mm in diameter and 1mm wall thickness whereas the gray colored members are 30mm in diameter and1.5mm wall thickness. Each bay of the truss is a cube of 707mm side. The truss is modelled using the standard linear finite element (FE) method in which mass/inertial property of 0.44kg is lumped at each of the 36 nodes of the FE model. For the purposes of this study, additional masses of 1.75kg is assigned to nodes 1,7,30, and 34 and of 2.75kg is assigned to nodes 20,26, and 32, to achieve a structure in which the first two lower natural frequencies corresponding to modes of vibration along the vertical (gravity) axis are closely spaced and clustered together and the next two higher natural frequencies corresponding to vertical modes of vibration are also closely spaced but at significant higher frequencies from the first two low frequencies. Furthermore, a critical damping ratio of 1% for all 4 mode shapes considered is assumed (i.e., zi=1%; i=1,2,3,4). The first four natural frequencies ωi (i=1,2,3,4) and the ratios of the peak modal coordinates Ai
(i=1,2,3,4) corresponding to the second over the first mode shapes (A2/A1) and the fourth over the third (A4/A3) of the
[image:9.595.198.398.314.461.2]considered structure are obtained via standard modal analysis using the FE model and are reported in the first column of Table 1.
Figure 2. Considered benchmark space truss model21.
The Monte Carlo simulation-based framework depicted in Figure 3 is devised to expedite the assessment of the herein adopted approach for OMA in noisy environments using the above described truss structure. Effectively, the proposed framework bypasses the need to perform linear response history analysis to the FE model for the purpose at hand. Specifically, from the FE modal analysis results reported in the first column of Table 1, the amplitude of the FRF squared (transfer function) for acceleration output, termed as accelerance in the field of modal testing3, is analytically
defined for the four first mode shapes along the vertical axis of the truss in Figure 2. This function is plotted (thick gray curve) in the range of relatively low frequencies in Figure 4 and in the full frequency range in Figure 6, upon normalization to its peak value. Note that under the OMA assumption of ideal white (ambient) noise input/excitation, the above transfer function becomes the “target” (known) power spectral density (PSD) function which is sought to be captured by the AIC device of Figure 1. Since the considered device assumes Nyquist sampled discrete-time input signals, the continuous-time (analog) filter characterized by the above target PSD is replaced by a surrogate discrete-time auto-regressive moving average (ARMA) filter whose transfer function traces closely the target PSD of the analog system (broken curve in Figures 2 and 4). The coefficients of this ARMA filter are derived by the auto/cross correlation matching method22, commonly used for spectrum compatible simulation23,24. Next, following the framework of Figure 3,
standard “peak picking” (PP) in the frequency domain technique3 for output-only system identification is used to extract
[image:10.595.100.489.115.466.2]approximations of the modal parameters13.
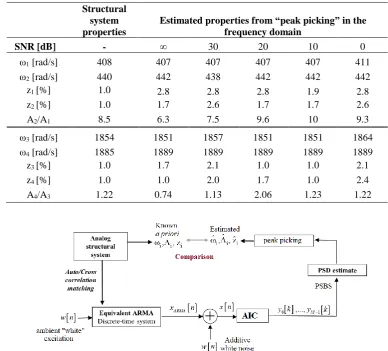
Table 1. Actual and estimated modal properties of the first four vertical mode shapes of the truss shown in Figure 2.
Structural system properties
Estimated properties from “peak picking” in the frequency domain
SNR [dB] - ∞ 30 20 10 0
ω1 [rad/s] 408 407 407 407 407 411
ω2 [rad/s] 440 442 438 442 442 442
z1 [%] 1.0 2.8 2.8 2.8 1.9 2.8
z2 [%] 1.0 1.7 2.6 1.7 1.7 2.6
A2/A1 8.5 6.3 7.5 9.6 10 9.3
ω3 [rad/s] 1854 1851 1857 1851 1851 1864
ω4 [rad/s] 1885 1889 1889 1889 1889 1889
z3 [%] 1.0 1.7 2.1 1.0 1.0 2.1
z4 [%] 1.0 1.0 2.0 1.7 1.0 2.4
[image:10.595.94.491.118.448.2]A4/A3 1.22 0.74 1.13 2.06 1.23 1.22
Figure 3. Adopted Monte Carlo simulation-based framework to assess the AIC device of Figure 1 for OMA applications.
Figure 4. Acceleration transfer function of a two degree of freedom structural system (target PSD) with damping ratio 1% for all modes and natural frequencies ω1=408 rad/s and ω2=440 rad/s, and theoretical PSD obtained from a multi-coset
sampling device in Figure 1 with M=5 and N=16.
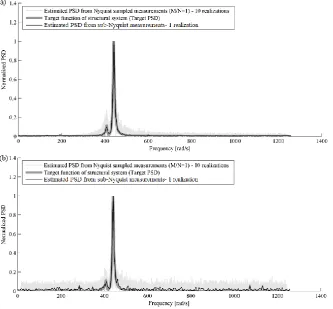
Figure 5. Estimated PSDs from Nyquist sampled and CS sampled simulated data (K=1000, M=5 and N=16) vis-a-vis the target PSD (transfer function of considered two degree of freedom structural system) for (a) SNR=∞ dB, and (b) SNR=0 dB.
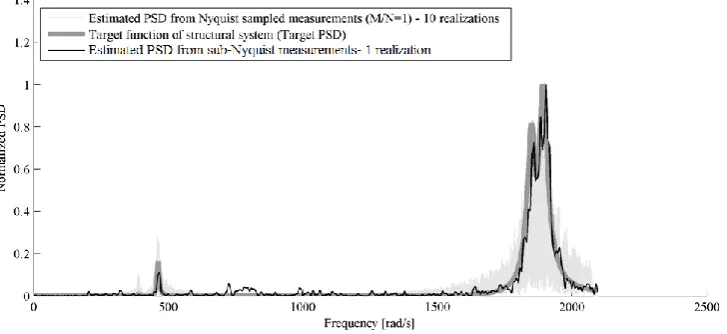
[image:11.595.135.469.289.598.2]measurements estimated from Eq. (23) for a single x[n] input realization assuming K=1000blocks of N=16 length each (i.e., 16000 Nyquist sampled measurements). PSD estimates for the noiseless case (Figure 5a) and the “extreme” case of SNR= 0db (Figure 5b) are shown and they both trace closely the target PSD. For comparison, the PSDs estimated from 10 Nyquist sampled realizations x[n] derived by means of the standard periodogram are also superposed (light gray curves). Similar data are plotted in Figure 7 for SNR=30db, focusing now on the two higher frequency modes. It is concluded that the adopted approach has increased sensitivity to additive noise in higher frequencies in terms of PSD shape, while in the case of the two first closely spaced (relatively low) natural frequencies it becomes practically immune to additive noise.
[image:12.595.149.454.301.443.2]The above conclusions are further confirmed by comparing the natural frequencies, damping ratios, and relative amplitudes of the 4 considered modes derived by application of PP to the PSD estimated directly from the sub-Nyquist measurements with their known values, as indicated in Figure 3. Table 1 summarizes these results for four different levels of SNR. Remarkably, fairly accurate estimation of the natural frequencies is achieved even in the case of extreme noise corruption (SNR=0dB). Furthermore, the accuracy of the estimated values of the damping ratios and the ratios of local peak PSD values derived fall roughly within the expected range of the PP algorithm. In all cases considered, the level of additive noise does not seem to correlate with the level of accuracy of the considered approach in terms of out-only system identification. In this respect, it can be argued that for the purpose at hand, the PSBS approach and multi-coset sampling AIC device enjoys additive white noise immunity.
Figure 6. Acceleration transfer function of a four degree of freedom structural system (target PSD) with damping ratio 1% for all modes and natural frequencies ω1=408 rad/s, ω2=440 rad/s, ω3=1850 rad/s, ω4=1880 rad/s and theoretical PSD
obtained from a multi-coset sampling device in Figure 1 with M=5 and N=16.
[image:12.595.119.483.491.658.2]6.
CONCLUDING REMARKS
Motivated by the need to reduce monetary and energy consumption costs of wireless sensor networks in undertaking operational modal analysis (OMA) of engineering structures, the performance of a recent power spectrum blind sampling (PSBS) technique to undertake frequency domain output-only system identification directly from sub-Nyquist noisy acceleration measurements has been numerically assessed. The considered PSBS technique is used in conjunction with a multi-coset analog-to-information converter (AIC) to sample acceleration response signals of white noise excited linear damped structures at sub-Nyquist rates. Notably, it is applicable to multi-band wide sense stationary random signals/stochastic processes and does not pose any sparsity requirements. Furthermore, the underlying natural frequencies, peak gains in the frequency domain, and critical damping ratios of the vibrating structures are estimated directly from the sub-Nyquist measurements and, therefore, the computationally demanding signal reconstruction step is by-passed. This is accomplished by means of the standard peak picking in the frequency domain algorithm for linear system identification to estimated spectra via PSBS.
For numerical assessment, sub-Nyquist sampled acceleration response signals corrupted by various levels of additive white noise pertaining to a benchmark space truss structure with closely spaced natural frequencies have been obtained within an efficient Monte Carlo simulation-based framework. The proposed framework relies on discrete-time ARMA filters to represent the underlying analog structural system and facilitates significantly the numerical work. Accurate estimates of natural frequencies and reasonable estimates for local peak spectral ordinates and critical damping ratios are derived from measurements sampled at about 70% below Nyquist rate and for signal to noise ratio as low as 0db demonstrating that the adopted approach enjoys noise immunity within the common range of frequencies of interest to structural OMA.
ACKNOWLEDGMENTS
The reported research work is funded by EPSRC, UK under grant EP/K023047/1. The second author further acknowledges the support of City University London through a University studentship.
REFERENCES
[1] Doebling, S. W., Farrar, C. R., and Prime, M. B. "A summary review of vibration-based damage identification methods," Shock Vib. Dig., 30(2), 91–105 (1998).
[2] Reynders, E., "System identification methods for (operational) modal analysis: review and comparison," Arch. Comput. Methods Eng. 19(1), 51-124 (2012).
[3] Ewins, D. J., [Modal Testing: Theory practice and application],2nd ed., Research Study Press, Baldock (2000).
[4] Zhang, L., Brincker, R., Andersen, P., "An Overview of Operational Modal Analysis: Major Development and Issues," Proc. 1st Int. Operational Modal Analysis Conf. (ICOMAC’05), 179-190 (2005).
[5] Amezquita-Sanchez, J.P., Adeli, H., "Signal processing techniques for vibration-based health monitoring of smart structures," Arch. Computat Methods Eng., DOI: 10.1007/s11831-014-9135-7 (2014).
[6] Lynch, J. P., "An overview of wireless structural health monitoring for civil structures," Phil. Trans. R. Soc. A 365(1851), 345-372 (2007).
[7] Spencer, B.F.J. and Yun, C.B., "Wireless sensor advances and applications for civil infrastructure monitoring," NSEL Report No 24, University of Illinois at Urbana-Champaign (2010).
[8] Park, J. Y., Wakin, M. B. and Gilbert, A. C., "Modal analysis with compressive measurements," IEEE Trans. Signal Proces. 62(7), 1655-1670, (2014).
[9] Tausiesakul, B., Gkoktsi, K., and Giaralis, A., "Compressive Sensing Spectral Estimation for output-only structural system identification," Proc. 7th Int. Conf. Computational Stochastic Mechanics (2014).
[10]O’Connor, S.M., Lynch, J.P. and Gilbert, A.C., "Compressed sensing embedded in an operational wireless sensor network to achieve energy efficiency in long-term monitoring applications," Smart Mater. Struct. 23(8), 085014 (2014).
[12]Duarte, M.F., Shen, G., Ortega, A. and Baraniuk, R.G., “Signal compression in wireless sensor networks,” Phil. Trans. R. Soc. A, 370, 118-135 (2012).
[13]Brincker, R. and Zhang, L., "Frequency Domain Decomposition Revisited," Proc.3rd Int. Operational Modal
Analysis Conf. (IOMAC’09), 615-626 (2009).
[14]Tropp, J.A., Laska, J.N., Duarte, M.F., Romberg, J.K., Baraniuk, R.G., "Beyond Nyquist: Efficient sampling of sparse bandlimited signals," IEEE Trans. Inform. Theory 56(1), 520-544 (2010).
[15]Davenport, M.A., Laska, J.N., Treichler, J.R., and Baraniuk, R.G., "The pros and cons of compressive sensing for wideband signal acquisition: Noise folding versus dynamic range," IEEE Trans. Signal Proces. 60, 4628-4642 (2012).
[16]Laska, J.N., and Baraniuk, R.G., "Regime change: Bit-depth versus measurement-rate in compressive sensing," IEEE Trans. Signal Proc. 60, 3496-3505 (2012).
[17]Cohen, D. and Eldar, Y.C., "Sub-Nyquist sampling for power spectrum sensing in cognitive radios: A unified approach, " IEEE Trans. Signal Proces. 62(15), 3897-3910 (2014).
[18]Ariananda, D. D. and Leus, G., "Compressive wideband power spectrum estimation, "IEEE Trans. Signal Proces. 60(9), 4775-4789 (2012).
[19]Mishali, M. and Eldar, Y. C., "Blind multiband signal reconstruction: Compressed sensing for analog signals," IEEE Trans. Sign. Proces. 57(3), 993-1009 (2009).
[20]Tausiesakul, B. and Gonzalez-Prelcic, N., "Power spectrum blind sampling using minimum mean square error and weighted least squares," Proc. 47th Asilomar Conf. Signals, Systems and Computers (ACSSC 2013), 153-157
(2013).
[21]Humar, J., Bagchi A., and Xu, H., "Performance of vibration-based techniques for the identification of structural damage," Structural Health Monitoring, 5 (3), 215-227 (2006).
[22]Spanos, P.D. and Zeldin, B.A., "Monte Carlo treatment of random fields: A broad perspective," Appl. Mech. Rev. 51(3), 219-237 (1998).
[23]Giaralis, A. and Spanos, P.D., "Wavelets based response spectrum compatible synthesis of accelerograms- Eurocode application (EC8)," Soil Dyn. Earthquake Eng. 29(1), 219-235 (2009).