ScienceDirect
Available online at www.sciencedirect.com
Procedia Engineering 207 (2017) 1278–1283
1877-7058 © 2017 The Authors. Published by Elsevier Ltd.
Peer-review under responsibility of the scientific committee of the International Conference on the Technology of Plasticity. 10.1016/j.proeng.2017.10.883
10.1016/j.proeng.2017.10.883
© 2017 The Authors. Published by Elsevier Ltd.
Peer-review under responsibility of the scientific committee of the International Conference on the Technology of Plasticity.
1877-7058
Available online at www.sciencedirect.com
ScienceDirect
Procedia Engineering 00 (2017) 000–000
www.elsevier.com/locate/procedia
1877-7058 © 2017 The Authors. Published by Elsevier Ltd.
Peer-review under responsibility of
the scientific committee of the International Conference on the Technology of
Plasticity
.International Conference on the Technology of Plasticity, ICTP 2017, 17-22 September 2017,
Cambridge, United Kingdom
Validation of a finite element model of the cold roll forming process
on the basis of 3D geometric accuracy
Kwun Sing Tsang
a,*, William Ion
a,b, Paul Blackwell
b, Martin English
caDepartment of Design, Manufacture and Engineering Management, University of Strathclyde, 75 Montrose Street, Glasgow G1 1XJ, UK bAdvanced Forming Research Centre, University of Strathclyde, 85 Inchinnan Drive, Inchinnan PA4 9LJ, UK
cHadley Group, Downing Street, Smethwick, Birmingham, B66 2PA, UK
Abstract
Cold roll forming is an incremental sheet metal forming process used to supply products to numerous industries such as automotive, architecture and construction, etc. In recent years there has been an increase in the demand by customers for high value products, through the forming of high strength materials, or complex profiles. Such demands increase the challenges faced by the tooling designer to bring a successful product through from design to manufacture, on time and within specification. Finite element (FE) simulations are increasingly applied in industry due to the desired advantage of reducing design iterations by allowing the designer to investigate the effects of parameter changes, without the risk of expensive tooling costs.
Some successful validation of the numerical modelling of the cold roll forming process can be found in literature, in particular when analysing the strain distribution across the material or comparing the final rolled profile geometry. However, cold roll forming is a continuous process and no one has published work on the measurement of the profile on a pass to pass basis, in particular, the three dimensional geometry of the profile. Experimental trials were carried out to obtain a 3D point cloud model of the top surface of a roll formed section. This investigation aimed to quantify how accurate FE simulation may be in relation to physical data.
© 2017 The Authors. Published by Elsevier Ltd.
Peer-review under responsibility of the scientific committee of the International Conference on the Technology
of Plasticity.
Keywords: Cold roll forming; sheet metal; finite element analysis; geometric analysis
* Corresponding author. Tel.: +44-141-548-2091.
E-mail address: [email protected]
2 Kwun Sing Tsang / Procedia Engineering 00 (2017) 000–000
1.Introduction
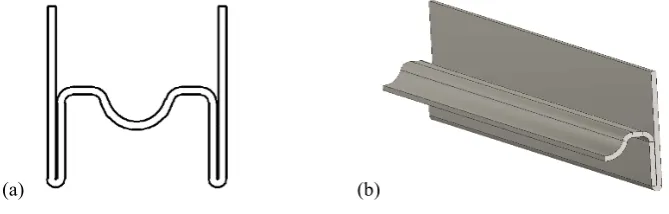
Finite element (FE) analysis has been a common tool used to assist with the geometric validation of many forming processes, in particular the cold roll forming process. This technique can predict and illustrate the behaviour of the forming process, with the accuracy of results improving over the years due to the increase in computer performance and increased understanding of the modelling process. Cold roll forming is an incremental forming process which forms sheet metal to a desired component with a constant cross section as shown in Fig. 1. This forming process is well suited for high volumes and long components. The high productivity and reduced geometric constraints associated with roll forming indicate clear advantages when compared to alternative methods such as press forming or hydro forming.
(a) (b)
Fig. 1. Roll forming process: (a) schematic [1]; and (b) image
A challenge that cold roll forming companies face is the heavy dependency on the roll designers experience and intuition to achieve an accurate component. There is no scientific methodology readily available for the design of new tooling. To date, an empirical process is still widely adopted [1,2]. With the implementation of FE, one of the main benefits is to allow the designer to investigate the effects of parameter changes within the forming process without the risk of expensive tooling costs. The most common challenge that the designer must face is satisfying product specification and in particular dimensional accuracy. In an industrial environment, geometric assessments have been typically carried out by designers via two-dimensional (2D) comparison methods, e.g. using a shadow graph to compare the cross section of a section, and more recently with the use of 2D scanning equipment. It appears that three-dimensional (3D) surface analyses have not been used for these geometric assessments, and in particular, when measuring a section mid-stage of the roll forming process. Similar to alternative forming processes, forming defects may arise. Defects specific to roll forming may consist of one or a combination of the following: straightness defects where the section deviates from a straight line in the vertical and/or horizontal plane; edge buckling and wave where the strip edge of a section does not follow a linear path; end flare where there is a distortion at the front or back of the section due to the release of internal stresses after cutting; and twist where the cross section of the section rotates along the longitudinal direction due to non-uniform longitudinal strain across the transverse direction of the strip, commonly found in non-symmetrical sections [1]. Research has determined the fundamental deformation types in roll forming, i.e. longitudinal strain, longitudinal and transversal bending and shear in the strip plane [4]. It has been noted that transversal bending is the desired deformation in roll forming. Certain variables have been studied to show the influence these have on the peak longitudinal strain in a section, i.e. increasing the bend angle increment or material thickness increases peak longitudinal strain, while increasing the distance between each roll stand will decrease the peak longitudinal strain [5-8]. These aspects can all be studied through FE.
Kwun Sing Tsang et al. / Procedia Engineering 207 (2017) 1278–1283 1279
ScienceDirect
Procedia Engineering 00 (2017) 000–000
www.elsevier.com/locate/procedia
1877-7058 © 2017 The Authors. Published by Elsevier Ltd.
Peer-review under responsibility of
the scientific committee of the International Conference on the Technology of
Plasticity
.International Conference on the Technology of Plasticity, ICTP 2017, 17-22 September 2017,
Cambridge, United Kingdom
Validation of a finite element model of the cold roll forming process
on the basis of 3D geometric accuracy
Kwun Sing Tsang
a,*, William Ion
a,b, Paul Blackwell
b, Martin English
caDepartment of Design, Manufacture and Engineering Management, University of Strathclyde, 75 Montrose Street, Glasgow G1 1XJ, UK bAdvanced Forming Research Centre, University of Strathclyde, 85 Inchinnan Drive, Inchinnan PA4 9LJ, UK
cHadley Group, Downing Street, Smethwick, Birmingham, B66 2PA, UK
Abstract
Cold roll forming is an incremental sheet metal forming process used to supply products to numerous industries such as automotive, architecture and construction, etc. In recent years there has been an increase in the demand by customers for high value products, through the forming of high strength materials, or complex profiles. Such demands increase the challenges faced by the tooling designer to bring a successful product through from design to manufacture, on time and within specification. Finite element (FE) simulations are increasingly applied in industry due to the desired advantage of reducing design iterations by allowing the designer to investigate the effects of parameter changes, without the risk of expensive tooling costs.
Some successful validation of the numerical modelling of the cold roll forming process can be found in literature, in particular when analysing the strain distribution across the material or comparing the final rolled profile geometry. However, cold roll forming is a continuous process and no one has published work on the measurement of the profile on a pass to pass basis, in particular, the three dimensional geometry of the profile. Experimental trials were carried out to obtain a 3D point cloud model of the top surface of a roll formed section. This investigation aimed to quantify how accurate FE simulation may be in relation to physical data.
© 2017 The Authors. Published by Elsevier Ltd.
Peer-review under responsibility of the scientific committee of the International Conference on the Technology
of Plasticity.
Keywords: Cold roll forming; sheet metal; finite element analysis; geometric analysis
* Corresponding author. Tel.: +44-141-548-2091.
E-mail address: [email protected]
2 Kwun Sing Tsang / Procedia Engineering 00 (2017) 000–000
1.Introduction
Finite element (FE) analysis has been a common tool used to assist with the geometric validation of many forming processes, in particular the cold roll forming process. This technique can predict and illustrate the behaviour of the forming process, with the accuracy of results improving over the years due to the increase in computer performance and increased understanding of the modelling process. Cold roll forming is an incremental forming process which forms sheet metal to a desired component with a constant cross section as shown in Fig. 1. This forming process is well suited for high volumes and long components. The high productivity and reduced geometric constraints associated with roll forming indicate clear advantages when compared to alternative methods such as press forming or hydro forming.
[image:2.544.68.482.202.321.2](a) (b)
Fig. 1. Roll forming process: (a) schematic [1]; and (b) image
A challenge that cold roll forming companies face is the heavy dependency on the roll designers experience and intuition to achieve an accurate component. There is no scientific methodology readily available for the design of new tooling. To date, an empirical process is still widely adopted [1,2]. With the implementation of FE, one of the main benefits is to allow the designer to investigate the effects of parameter changes within the forming process without the risk of expensive tooling costs. The most common challenge that the designer must face is satisfying product specification and in particular dimensional accuracy. In an industrial environment, geometric assessments have been typically carried out by designers via two-dimensional (2D) comparison methods, e.g. using a shadow graph to compare the cross section of a section, and more recently with the use of 2D scanning equipment. It appears that three-dimensional (3D) surface analyses have not been used for these geometric assessments, and in particular, when measuring a section mid-stage of the roll forming process. Similar to alternative forming processes, forming defects may arise. Defects specific to roll forming may consist of one or a combination of the following: straightness defects where the section deviates from a straight line in the vertical and/or horizontal plane; edge buckling and wave where the strip edge of a section does not follow a linear path; end flare where there is a distortion at the front or back of the section due to the release of internal stresses after cutting; and twist where the cross section of the section rotates along the longitudinal direction due to non-uniform longitudinal strain across the transverse direction of the strip, commonly found in non-symmetrical sections [1]. Research has determined the fundamental deformation types in roll forming, i.e. longitudinal strain, longitudinal and transversal bending and shear in the strip plane [4]. It has been noted that transversal bending is the desired deformation in roll forming. Certain variables have been studied to show the influence these have on the peak longitudinal strain in a section, i.e. increasing the bend angle increment or material thickness increases peak longitudinal strain, while increasing the distance between each roll stand will decrease the peak longitudinal strain [5-8]. These aspects can all be studied through FE.
1280 Kwun Sing Tsang / Procedia Engineering 00 (2017) 000–000 Kwun Sing Tsang et al. / Procedia Engineering 207 (2017) 1278–1283 3
2.Numerical Simulation
AutoCAD 2015 was used for the modelling of the section and tooling geometry. These models were imported into the FE analysis software, COPRA® FEA RF for the simulation of the forming process.
An H-section with a rib along the centre was selected for this study as shown in Fig. 2. This section is used as a window reinforcement section and was chosen due to the complex features being formed, i.e. the rib along the centre and the 0° radius along the flange where the material is formed through an angle of 180°. The overall width of the section is 26.8 mm with a height of 27 mm. The rib along the centre of the section has an internal radius of 1.2 mm. Only half of the section was modelled due to symmetry along the vertical axis in order to reduce computation time. A number of assumptions are applied to the modelling of the roll forming process. A standard friction model was implemented, which consists of rotating rolls that drive the sheet metal through from one pass to the next due to the contact between sheet and tooling. The forming rolls were fixed in position with the bottom rolls driven. The top rolls were modelled without drive and free to rotate. The top roll positions were defined such that the roll gaps between the top and bottom rolls were equal to the material thickness. The friction coefficient, µ = 0.21 was chosen based on industrial experience. The linear velocity of the sheet material was defined as 0.5 m/s. Thermal properties were not considered for simulation purposes. Some heat is generated during the roll forming process due to the interaction between coil and forming rolls. However, previous thermal measurements of this interaction recorded maximum temperatures reaching <50°C. Hence, thermal properties were considered negligible.
(a) (b)
Fig. 2. (a) Cross section; and (b) projection of H-section
Fully hardened D2 tool steel is typically used for roll tooling manufacture which was assumed to have negligible deformation during forming. Hence, the roll surfaces were defined as rigid and there was no requirement for a tooling material model. The deformable sheet material consisted of a structural grade steel, S450 with assumed isotropic material properties. This assumption was implemented for simplifications purposes. The following material properties were determined through a standard in house sheet metal tensile test, and implemented into the simulated material model: Young’s modulus 205 GPa; yield strength 410 MPa; tensile strength 475 MPa; and Poisson’s ratio of 0.3. An 8-node hexahedral element type was chosen to model the three dimensional solid of the sheet material. Eight integration points are present in this element type as this is desirable when modelling a contact analysis [9]. Four models of the roll forming process (SIM001 – SIM004) was simulated using various mesh models. For all models, one row of elements was assigned across the thickness of the section, with the exception of two or more rows of elements where bending occurs, i.e. radial feature. SIM001 – SIM003 consisted of two rows of elements at these bending regions and four rows was assigned to the centre region in SIM004. The number of elements across the section along the transverse direction was increased for each simulation, with the element length along the rolling direction fixed for all models. The total element count ranged from 13,860 elements (SIM001) to 26,840 elements (SIM004). During the simulation of the forming process, a section of the deformed mesh was selected after Pass 7 for comparison with the geometry of the physical section. This mesh was converted to a 3D model file for processing. The numerical model from each simulation was compared in order to determine an appropriate model to carry out a full analysis of the section after each forming station.
4 Kwun Sing Tsang / Procedia Engineering 00 (2017) 000–000
3.Experimental Analysis
For this investigation a standard rolling mill was used to form the H-section required. This section was analysed during the forming process with particular interest in the geometric behavior of the material. This data was collected for validation of the numerical model.
The mill consists of 26 forming stations to reach the final cross section with drive shafts applying rotation to all bottom rolls. However, for the purpose of this study only 18 forming stations were used. The flange which is formed through an angle of 180° is completed in Pass 19, hence, the top surface of the section is no longer accessible.
Upon engaging the material within the forming passes, a three dimensional geometric analysis was carried out using a Faro Edge Scan Arm coupled with a Faro REV 6HD laser line probe. This geometric analysis collected a point cloud model of the top surface of the section to calculate the geometric deviations between this model and simulation. A total of 16 scans was carried out to obtain the surface geometry of 16 sections, i.e. one scan for each pass. Note that Pass 3 and Pass 11 were neglected from this study.
Similar studies can be found in the literature using a high resolution 3D scanner, EXAscan to measure fully formed sections [10,11]. This equipment was deployed to measure longitudinal bow after the section of interest was roll formed. The current industrial practice for the development of a new roll formed section follows a systematic process. A cut out after each forming pass is removed and the cross section is compared against the as designed section. There is a limitation in this procedure as springback will be present in the physical sample. An advantage of 3D surface geometric analysis is the ability to determine the deformation length to provide key information to help inform the designer if the current forming strategy is appropriate. The deformation length consists of the length in which forming takes place along the strip, as all the forming is not restricted to the middle of the pass only.
Considering the definition of roll forming, the sheet metal strip is formed whilst maintaining the material thickness across the section with some variation at the bend radii [1]. Hence, only the top surface of the section was analysed. No further scans was obtained after Pass 19 as data could not be obtained where the material was formed through an angle of 180°.
Geomagic Control 2015 was the metrology software used to overlay the point cloud scan of the experimental section with the corresponding section obtained through numerical simulation.
4.Results and Discussion
(a) (b)
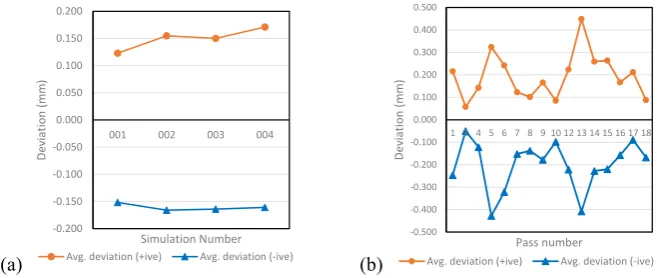
Fig. 3. 3D geometric analysis: FE vs. exp. (a) Pass 7 (SIM001 – SIM004); and (b) Pass 1 – Pass 18 (SIM001)
Fig. 3 presents the average deviation between the simulated and scanned surface models. This average deviation is an average of the deviations of all the data points distributed across the section between two passes. The number of point cloud data points range from approx. 287000 to 830000. The deviations in Fig. 3 (a) represents the average deviations in the positive and negative direction for Pass 7 (SIM001 – SIM004). From these results it was determined that the change in mesh model for SIM001 – SIM004 did not provide any improvement in the geometric comparison between the FE and physical geometric surfaces, hence, SIM001 was selected for this study. The average deviations may have increased in SIM002 – SIM004 for a number of reasons. One reason may be due to the
-0.200 -0.150 -0.100 -0.050 0.000 0.050 0.100 0.150 0.200
001 002 003 004
De
vi
at
ion
(m
m
)
Simulation Number
Avg. deviation (+ive) Avg. deviation (-ive)
-0.500 -0.400 -0.300 -0.200 -0.100 0.000 0.100 0.200 0.300 0.400 0.500
1 2 4 5 6 7 8 9 10 12 13 14 15 16 17 18
De
vi
at
ion
(m
m
)
Pass number
[image:3.544.105.440.301.408.2]2.Numerical Simulation
AutoCAD 2015 was used for the modelling of the section and tooling geometry. These models were imported into the FE analysis software, COPRA® FEA RF for the simulation of the forming process.
An H-section with a rib along the centre was selected for this study as shown in Fig. 2. This section is used as a window reinforcement section and was chosen due to the complex features being formed, i.e. the rib along the centre and the 0° radius along the flange where the material is formed through an angle of 180°. The overall width of the section is 26.8 mm with a height of 27 mm. The rib along the centre of the section has an internal radius of 1.2 mm. Only half of the section was modelled due to symmetry along the vertical axis in order to reduce computation time. A number of assumptions are applied to the modelling of the roll forming process. A standard friction model was implemented, which consists of rotating rolls that drive the sheet metal through from one pass to the next due to the contact between sheet and tooling. The forming rolls were fixed in position with the bottom rolls driven. The top rolls were modelled without drive and free to rotate. The top roll positions were defined such that the roll gaps between the top and bottom rolls were equal to the material thickness. The friction coefficient, µ = 0.21 was chosen based on industrial experience. The linear velocity of the sheet material was defined as 0.5 m/s. Thermal properties were not considered for simulation purposes. Some heat is generated during the roll forming process due to the interaction between coil and forming rolls. However, previous thermal measurements of this interaction recorded maximum temperatures reaching <50°C. Hence, thermal properties were considered negligible.
(a) (b)
Fig. 2. (a) Cross section; and (b) projection of H-section
Fully hardened D2 tool steel is typically used for roll tooling manufacture which was assumed to have negligible deformation during forming. Hence, the roll surfaces were defined as rigid and there was no requirement for a tooling material model. The deformable sheet material consisted of a structural grade steel, S450 with assumed isotropic material properties. This assumption was implemented for simplifications purposes. The following material properties were determined through a standard in house sheet metal tensile test, and implemented into the simulated material model: Young’s modulus 205 GPa; yield strength 410 MPa; tensile strength 475 MPa; and Poisson’s ratio of 0.3. An 8-node hexahedral element type was chosen to model the three dimensional solid of the sheet material. Eight integration points are present in this element type as this is desirable when modelling a contact analysis [9]. Four models of the roll forming process (SIM001 – SIM004) was simulated using various mesh models. For all models, one row of elements was assigned across the thickness of the section, with the exception of two or more rows of elements where bending occurs, i.e. radial feature. SIM001 – SIM003 consisted of two rows of elements at these bending regions and four rows was assigned to the centre region in SIM004. The number of elements across the section along the transverse direction was increased for each simulation, with the element length along the rolling direction fixed for all models. The total element count ranged from 13,860 elements (SIM001) to 26,840 elements (SIM004). During the simulation of the forming process, a section of the deformed mesh was selected after Pass 7 for comparison with the geometry of the physical section. This mesh was converted to a 3D model file for processing. The numerical model from each simulation was compared in order to determine an appropriate model to carry out a full analysis of the section after each forming station.
3.Experimental Analysis
For this investigation a standard rolling mill was used to form the H-section required. This section was analysed during the forming process with particular interest in the geometric behavior of the material. This data was collected for validation of the numerical model.
The mill consists of 26 forming stations to reach the final cross section with drive shafts applying rotation to all bottom rolls. However, for the purpose of this study only 18 forming stations were used. The flange which is formed through an angle of 180° is completed in Pass 19, hence, the top surface of the section is no longer accessible.
Upon engaging the material within the forming passes, a three dimensional geometric analysis was carried out using a Faro Edge Scan Arm coupled with a Faro REV 6HD laser line probe. This geometric analysis collected a point cloud model of the top surface of the section to calculate the geometric deviations between this model and simulation. A total of 16 scans was carried out to obtain the surface geometry of 16 sections, i.e. one scan for each pass. Note that Pass 3 and Pass 11 were neglected from this study.
Similar studies can be found in the literature using a high resolution 3D scanner, EXAscan to measure fully formed sections [10,11]. This equipment was deployed to measure longitudinal bow after the section of interest was roll formed. The current industrial practice for the development of a new roll formed section follows a systematic process. A cut out after each forming pass is removed and the cross section is compared against the as designed section. There is a limitation in this procedure as springback will be present in the physical sample. An advantage of 3D surface geometric analysis is the ability to determine the deformation length to provide key information to help inform the designer if the current forming strategy is appropriate. The deformation length consists of the length in which forming takes place along the strip, as all the forming is not restricted to the middle of the pass only.
Considering the definition of roll forming, the sheet metal strip is formed whilst maintaining the material thickness across the section with some variation at the bend radii [1]. Hence, only the top surface of the section was analysed. No further scans was obtained after Pass 19 as data could not be obtained where the material was formed through an angle of 180°.
Geomagic Control 2015 was the metrology software used to overlay the point cloud scan of the experimental section with the corresponding section obtained through numerical simulation.
4.Results and Discussion
(a) (b)
Fig. 3. 3D geometric analysis: FE vs. exp. (a) Pass 7 (SIM001 – SIM004); and (b) Pass 1 – Pass 18 (SIM001)
Fig. 3 presents the average deviation between the simulated and scanned surface models. This average deviation is an average of the deviations of all the data points distributed across the section between two passes. The number of point cloud data points range from approx. 287000 to 830000. The deviations in Fig. 3 (a) represents the average deviations in the positive and negative direction for Pass 7 (SIM001 – SIM004). From these results it was determined that the change in mesh model for SIM001 – SIM004 did not provide any improvement in the geometric comparison between the FE and physical geometric surfaces, hence, SIM001 was selected for this study. The average deviations may have increased in SIM002 – SIM004 for a number of reasons. One reason may be due to the
-0.200 -0.150 -0.100 -0.050 0.000 0.050 0.100 0.150 0.200
001 002 003 004
De
vi
at
ion
(m
m
)
Simulation Number
Avg. deviation (+ive) Avg. deviation (-ive)
-0.500 -0.400 -0.300 -0.200 -0.100 0.000 0.100 0.200 0.300 0.400 0.500
1 2 4 5 6 7 8 9 10 12 13 14 15 16 17 18
De
vi
at
ion
(m
m
)
Pass number
[image:4.544.107.436.430.569.2]1282 Kwun Sing Tsang / Procedia Engineering 00 (2017) 000–000 Kwun Sing Tsang et al. / Procedia Engineering 207 (2017) 1278–1283 5
element aspect ratios, in particular, the elements where bending occurs. With an increase in the mesh density along the transverse direction, the ratio between element length along the transverse direction and length along the rolling direction increases significantly. Considering the radial element next to the rib feature, this ratio ranges from 1:3.7 (SIM001) to 1:8.95 (SIM003). For the simulation of the roll forming process, it is preferable to limit this ratio to a maximum of 1:4. In order to improve this aspect ratio, the number of elements along the rolling direction should be increased. Due to cold roll forming being a multi stage complex process, a further refined mesh would significantly increase the total simulation time. Hence, SIM001 was selected to achieve an appropriate total simulation time.
[image:5.544.170.375.239.347.2]Fig. 3 (b) presents the average deviation for Pass 1 to Pass18 (SIM001). It can be seen that the average deviation in both directions does not exceed 0.45 mm, displaying highly desired results on such a macro scale analysis. The motivation of this work was to validate the FE simulation of the roll forming process by conducting a geometric analysis between numerical models and physical trials. With FE providing a good prediction of geometry during the roll forming process, the optimisation of tooling design can be improved and the reliance on the element of the black art associated in roll forming can be reduced.
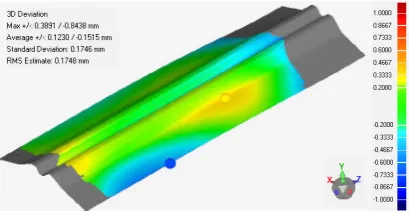
Fig. 4. Distribution of geometric deviations – Pass 7 (SIM001)
Considering the distribution of geometric deviations across a pass, Pass 7 (SIM001) was selected as shown in Fig. 4. It can be seen that the agreement of a large proportion of the section is within +/-0.2 mm. The magnitude of the maximum deviation of 0.39 mm in the positive direction and 0.84 mm in the negative direction may be caused by a number of possibilities. This may be related to the accuracy of material properties of the section used for the FE. Due to the sensitivity of FE, this may not be able to accurately determine the complete behavior of springback. Secondly, as human operators have assembled the forming stations, human error may be introduced to the process. This may be in the form of misalignment from one forming station to the next. This is an important variable to consider when analysing the roll forming process. It would be interesting to develop a methodology that can immediately identify variation in the forming set up, to increase accuracy in an industrial environment.
Good agreement is clear between the physical and predicted geometries from FE. However, the sensitivity of FE results in regards to various parameter changes is not yet fully clear. A number of assumptions have been made during the pre-processing of the numerical model as outlined in the FE model set up. These assumptions are discussed in this section. It can be found in the literature how a number of friction coefficients have been used by different researchers when modelling the roll forming process. These values range from µ = 0.085 to µ = 0.2 [12-14]. The friction coefficient, µ = 0.021 was primarily selected based on industrial experience within Hadley Group and the similarity to those values used in literature. Note that an accurate measurement of the friction coefficient is difficult to obtain.
In addition to these assumptions, it was assumed that the roll deflection was considered negligible for this investigation. Should the material strength be increased, this will need to be addressed. Work has been carried out as found in the literature, where the stiffness variables in the complete roll forming stand is considered [15]. These variables include the stiffness of the roll forming scaffold, axis, bearing, adjustment spindle and frame of the roll forming stand. For future analyses, this may be an influential variable should there be large deviations between the FE model and physical components.
Finally, limitations of the geometric analysis are to be noted in regards to collecting the 3D point cloud data. Visual access of the complete surface is required for a successful scan. For the section in this study, a restricted view
6 Kwun Sing Tsang / Procedia Engineering 00 (2017) 000–000
of the top surface was evident once the section was formed through an angle of 180°. Hence, no further scans were carried out after Pass 19. Physical access for the scanner may pose a challenge between forming passes depending on the dimension of the rolls used. The roll pillar configuration will restrict access to the bottom of the section based on the position of the bottom rolls. Should these challenges be overcome, industry may consider implementing this analysis in the quality control of roll formed components.
5.Conclusion
This investigation presents the pre- and post-processing of the numerical simulation of the cold roll forming process. COPRA FEA RF 2015 was used for the nonlinear FE simulations of the forming process. An H-section was modelled and compared with physical trials using a structural grade steel, S450. This comparison was measured on the basis of surface geometry. A three dimensional geometric analysis was conducted to compare the surface of the numerical models during the forming process against scanned point cloud geometry of the physical section. The discrepancies in distance between the two methods were quantified and measured. Good agreement was observed between the two models indicating reliable application of the FE methodology for the roll forming process. This work may contribute to the development methodology of a new roll formed section when a pass by pass analysis is to be carried out. This work identifies potential limitations when carrying out geometric analyses of the roll forming process. Future work shall include additional analyses using alternative sections and coil material. A repeatability analysis should also be carried out when determining physical geometric surfaces. Note that this is not limited to traditional cold roll forming and may be applied to the development of new flexible roll forming technologies.
Acknowledgements
This research was carried out as part of the lead author’s Engineering Doctorate (EngD) programme with University of Strathclyde. The author would like to acknowledge the industrial partner, Hadley Group, for the cooperation and contributions to this work.
References
[1] G.T. Halmos, Roll forming handbook, CRC Press, 2005.
[2] S. Hong, S. Lee, N. Kim, A parametric study on forming length in roll forming, J. Mater. Process. Technol. 113 (2001) 774-778.
[3] N. Duggal, M.A. Ahmetoglu, G.L. Kinzel, T. Altan, Computer aided simulation of cold roll forming a computer program for simple section profiles, J. Mater. Process. Technol. 59, (1996) 41-48.
[4] S.M. Panton, S.D. Zhu, J.L. Duncan, Fundamental deformation types and sectional properties in roll forming, Int. J. Mech. Sci. 38 (1994) 725-735.
[5] M. Lindgren, An improved model for the longitudinal peak strain in the flange of a roll formed U-channel developed by FE-analysis, Steel Research Int. 78 (2007) 82-87.
[6] R. Safdarian, H.M. Naeini, The effects of forming parameters on the cold roll forming of channel section, Thin Walled Structures. 92 (2015) 130-136.
[7] Z.W. Han, C. Liu, W.P. Lu, L.Q. Ren, J. Tong, Spline finite strip analysis of forming parameters in roll forming a channel section, J. Mater. Process. Technol. 159 (2005) 383-388.
[8] J. Paralikas, K. Salonitis, G. Chryssolouris, Optimisation of roll forming process parameters – a semi empirical approach, Int. J. Adv. Manuf. Technol. 47 (2010) 1041-1052.
[9] MARC®2014, Volume b: Element library, (2014) 71-72.
[10] A. Abvabi, B. Rolfe, P. Hodgson, M. Weiss, The influence of residual stress on a roll forming process, Int. J. Mech. Sci. 101-102 (2015) 124-136.
[11] J. Wiebenga, M. Weiss, B. Rolfe, A. van den Boogaard, Product defect compensation by robust optimization of a cold roll forming process, J Mater. Process. Technol. 213 (2013) 978-986.
[12] M.S. Tehrani, P. Hartley, H.M. Naeini, H. Khademizadeh, Localised edge buckling in cold roll-forming of symmetric channel section, Thin Walled Structures. 44 (2006) 184-196.
[13] M. Lindgren, Finite element model of roll forming of a u-channel profile, 8th ICTP, Verona, Italy (2005) 3-4.
[14] G. Zeng, S.H. Li, Z.Q. Yu, X.M. Lai, Optimization design of roll profiles for cold roll forming based on response surface method, Mater. Des. 30 (2009) 1930-1938.
element aspect ratios, in particular, the elements where bending occurs. With an increase in the mesh density along the transverse direction, the ratio between element length along the transverse direction and length along the rolling direction increases significantly. Considering the radial element next to the rib feature, this ratio ranges from 1:3.7 (SIM001) to 1:8.95 (SIM003). For the simulation of the roll forming process, it is preferable to limit this ratio to a maximum of 1:4. In order to improve this aspect ratio, the number of elements along the rolling direction should be increased. Due to cold roll forming being a multi stage complex process, a further refined mesh would significantly increase the total simulation time. Hence, SIM001 was selected to achieve an appropriate total simulation time.
Fig. 3 (b) presents the average deviation for Pass 1 to Pass18 (SIM001). It can be seen that the average deviation in both directions does not exceed 0.45 mm, displaying highly desired results on such a macro scale analysis. The motivation of this work was to validate the FE simulation of the roll forming process by conducting a geometric analysis between numerical models and physical trials. With FE providing a good prediction of geometry during the roll forming process, the optimisation of tooling design can be improved and the reliance on the element of the black art associated in roll forming can be reduced.
Fig. 4. Distribution of geometric deviations – Pass 7 (SIM001)
Considering the distribution of geometric deviations across a pass, Pass 7 (SIM001) was selected as shown in Fig. 4. It can be seen that the agreement of a large proportion of the section is within +/-0.2 mm. The magnitude of the maximum deviation of 0.39 mm in the positive direction and 0.84 mm in the negative direction may be caused by a number of possibilities. This may be related to the accuracy of material properties of the section used for the FE. Due to the sensitivity of FE, this may not be able to accurately determine the complete behavior of springback. Secondly, as human operators have assembled the forming stations, human error may be introduced to the process. This may be in the form of misalignment from one forming station to the next. This is an important variable to consider when analysing the roll forming process. It would be interesting to develop a methodology that can immediately identify variation in the forming set up, to increase accuracy in an industrial environment.
Good agreement is clear between the physical and predicted geometries from FE. However, the sensitivity of FE results in regards to various parameter changes is not yet fully clear. A number of assumptions have been made during the pre-processing of the numerical model as outlined in the FE model set up. These assumptions are discussed in this section. It can be found in the literature how a number of friction coefficients have been used by different researchers when modelling the roll forming process. These values range from µ = 0.085 to µ = 0.2 [12-14]. The friction coefficient, µ = 0.021 was primarily selected based on industrial experience within Hadley Group and the similarity to those values used in literature. Note that an accurate measurement of the friction coefficient is difficult to obtain.
In addition to these assumptions, it was assumed that the roll deflection was considered negligible for this investigation. Should the material strength be increased, this will need to be addressed. Work has been carried out as found in the literature, where the stiffness variables in the complete roll forming stand is considered [15]. These variables include the stiffness of the roll forming scaffold, axis, bearing, adjustment spindle and frame of the roll forming stand. For future analyses, this may be an influential variable should there be large deviations between the FE model and physical components.
Finally, limitations of the geometric analysis are to be noted in regards to collecting the 3D point cloud data. Visual access of the complete surface is required for a successful scan. For the section in this study, a restricted view
of the top surface was evident once the section was formed through an angle of 180°. Hence, no further scans were carried out after Pass 19. Physical access for the scanner may pose a challenge between forming passes depending on the dimension of the rolls used. The roll pillar configuration will restrict access to the bottom of the section based on the position of the bottom rolls. Should these challenges be overcome, industry may consider implementing this analysis in the quality control of roll formed components.
5.Conclusion
This investigation presents the pre- and post-processing of the numerical simulation of the cold roll forming process. COPRA FEA RF 2015 was used for the nonlinear FE simulations of the forming process. An H-section was modelled and compared with physical trials using a structural grade steel, S450. This comparison was measured on the basis of surface geometry. A three dimensional geometric analysis was conducted to compare the surface of the numerical models during the forming process against scanned point cloud geometry of the physical section. The discrepancies in distance between the two methods were quantified and measured. Good agreement was observed between the two models indicating reliable application of the FE methodology for the roll forming process. This work may contribute to the development methodology of a new roll formed section when a pass by pass analysis is to be carried out. This work identifies potential limitations when carrying out geometric analyses of the roll forming process. Future work shall include additional analyses using alternative sections and coil material. A repeatability analysis should also be carried out when determining physical geometric surfaces. Note that this is not limited to traditional cold roll forming and may be applied to the development of new flexible roll forming technologies.
Acknowledgements
This research was carried out as part of the lead author’s Engineering Doctorate (EngD) programme with University of Strathclyde. The author would like to acknowledge the industrial partner, Hadley Group, for the cooperation and contributions to this work.
References
[1] G.T. Halmos, Roll forming handbook, CRC Press, 2005.
[2] S. Hong, S. Lee, N. Kim, A parametric study on forming length in roll forming, J. Mater. Process. Technol. 113 (2001) 774-778.
[3] N. Duggal, M.A. Ahmetoglu, G.L. Kinzel, T. Altan, Computer aided simulation of cold roll forming a computer program for simple section profiles, J. Mater. Process. Technol. 59, (1996) 41-48.
[4] S.M. Panton, S.D. Zhu, J.L. Duncan, Fundamental deformation types and sectional properties in roll forming, Int. J. Mech. Sci. 38 (1994) 725-735.
[5] M. Lindgren, An improved model for the longitudinal peak strain in the flange of a roll formed U-channel developed by FE-analysis, Steel Research Int. 78 (2007) 82-87.
[6] R. Safdarian, H.M. Naeini, The effects of forming parameters on the cold roll forming of channel section, Thin Walled Structures. 92 (2015) 130-136.
[7] Z.W. Han, C. Liu, W.P. Lu, L.Q. Ren, J. Tong, Spline finite strip analysis of forming parameters in roll forming a channel section, J. Mater. Process. Technol. 159 (2005) 383-388.
[8] J. Paralikas, K. Salonitis, G. Chryssolouris, Optimisation of roll forming process parameters – a semi empirical approach, Int. J. Adv. Manuf. Technol. 47 (2010) 1041-1052.
[9] MARC®2014, Volume b: Element library, (2014) 71-72.
[10] A. Abvabi, B. Rolfe, P. Hodgson, M. Weiss, The influence of residual stress on a roll forming process, Int. J. Mech. Sci. 101-102 (2015) 124-136.
[11] J. Wiebenga, M. Weiss, B. Rolfe, A. van den Boogaard, Product defect compensation by robust optimization of a cold roll forming process, J Mater. Process. Technol. 213 (2013) 978-986.
[12] M.S. Tehrani, P. Hartley, H.M. Naeini, H. Khademizadeh, Localised edge buckling in cold roll-forming of symmetric channel section, Thin Walled Structures. 44 (2006) 184-196.
[13] M. Lindgren, Finite element model of roll forming of a u-channel profile, 8th ICTP, Verona, Italy (2005) 3-4.
[14] G. Zeng, S.H. Li, Z.Q. Yu, X.M. Lai, Optimization design of roll profiles for cold roll forming based on response surface method, Mater. Des. 30 (2009) 1930-1938.
![Fig. 1. Roll forming process: (a) schematic [1]; and (b) image](https://thumb-us.123doks.com/thumbv2/123dok_us/1495033.102185/2.544.68.482.202.321/fig-roll-forming-process-schematic-b-image.webp)