City, University of London Institutional Repository
Citation
:
Placidi, M. and Ganapathisubramani, B. (2016). On the effects of surface
morphology on the structure of wall-turbulence. Springer Proceedings in Physics, 165, pp.
149-154. doi: 10.1007/978-3-319-29130-7_27
This is the accepted version of the paper.
This version of the publication may differ from the final published
version.
Permanent repository link:
http://openaccess.city.ac.uk/14771/
Link to published version
:
http://dx.doi.org/10.1007/978-3-319-29130-7_27
Copyright and reuse:
City Research Online aims to make research
outputs of City, University of London available to a wider audience.
Copyright and Moral Rights remain with the author(s) and/or copyright
holders. URLs from City Research Online may be freely distributed and
linked to.
Chapter 1
On the effects of surface morphology on the structure of
wall-turbulence
Marco Placidi and Bharathram Ganapathisubramani
1.1 Abstract
Experiments were conducted in the fully-rough regime on surfaces with large relative roughness (h/δ≈0.1) gener-ated by regularly distributed LEGOTM bricks of uniform height, arranged in different configurations. Measurements were made with high resolution PIV on six different frontal solidities,λF, at fixed plan solidity,λP. Results indi-cate that the spatial underlying structure of the turbulence across the different surface morphologies is universal in both its shape and orientation in relation to the flow velocity. Harpin packets inclination with respect of the wall is also found to be consistent not only across the different wall surfaces but also when compared to previous studies on smooth walls. Slices of two-point correlations for both streamwise and wall-normal velocity fluctuations and Reynolds shear stresses present a good collapse across the entirey/δ range for all wall morphologies.
1.2 Motivations and background
Surface roughness is commonly encountered in nature and it represents a challenge in numerous engineering appli-cations. Nevertheless, very little is understood about rough walls compared to their smooth wall counterpart [10]. Luckily, smooth and rough walls present similarities which are commonly employed in the study of boundary lay-ers [16]. Among these, it is well documented that hairpin-like vortical structures populate smooth wall turbulent boundary layers at low and moderate Reynolds numbers and tend to align coherently to form larger-scale structures termed hairpin vortex packets [1, 7]. Therefore, given that vortex organisation in the outer region is commonly observed in instantaneous snapshots of wall turbulence, these structures are bound to leave their imprint upon the statistics of the flow [5]. The main feature ascribed to harpin packets is a series of vortices aligned in the stream-wise direction forming a large-scale forward-leaning alternation of high and low momentum regions. Few studies have also supported the presence of similar harpin-like structures in the outer layer of rough wall boundary layers, providing that the roughness is small compared to the boundary layer thickness (h/δ <0.05). The morphology
of these rough surfaces were either irregular, based on damaged turbine blades [19], or regular woven mesh [17]. However, it is still unclear if and to what extent the same vortical structure signature would persist in flows over large surface roughness. PIV measurements were therefore acquired in the(x,y)plane of fully turbulent flows over different high relative roughness morphologies (h/δ ≈0.1). The aim was to explore the effect of these severe wall
conditions on the different types of structures in the outer region of turbulent boundary layers.
Marco Placidi
University of Southampton, Southampton, SO17 1BJ UK email: [email protected]
Bharathram Ganapathisubramani
University of Southampton, Southampton, SO17 1BJ UK email: [email protected]
1.3 Experimental facility and details
Experiments were carried out in the suction wind tunnel at the University of Southampton. The tunnel has a working section of 4.5min length, with a 0.9m×0.6mcross section. The free-stream turbulence intensity is homogenous and less than 0.3%. The same facility has been used for previous studies on rough walls [4, 3, 14, 2, amongst others]. The streamwise, wall-normal and spanwise directions are here given along thex−y−zdirections and u−v−ware the corresponding velocities. Fluctuating velocities are denoted with a0. Experiments were conducted in nominally zero-pressure-gradient (K= (ν/Ue2)[dUe/dx]≈5×10−8) at 11.5m/s. For rough surfaces, this study used a LEGOTMbaseboard onto which rectangular LEGOTM bricks (or blocks), uniformly distributed in staggered array, were securely fixed. These bricks presented a uniform height (h=11.4mm). Six different patterns at fixed plan coverage were adopted to examine the effects of frontal solidity on the structure of the turbulence (λF = 0.09,0.12,0.15,0.18,0.21,0.24). The different cases were designed on the basis of previous studies’ predictions for the peak in drag,D=D(λF)[10]. A fetch length of about 20δ was covered with brick elements to guarantee
the fully rough regime [3]. Measurements were acquired using planar Particle Image Velocimetry (PIV). Some of the main parameters characterising the different surfaces are given in table 1.1. The reader is referred to [13] for further details on the surface morphology and the experimental setup.
Table 1.1 Relevant experimental parameters.
Dataset λF λP δ(mm) h/δ Uτ(m/s) Reτ δ∗(mm) h+ αu0u0(0.4)αu0u0(0.5)
LF1 0.09 0.27 111 0.102 0.60 4600 17 463 13◦ 12◦
LF2 0.12 0.27 122 0.090 0.66 5500 22 518 11◦ 10◦
LF3 0.15 0.27 121 0.093 0.69 5700 22 541 13◦ 13◦
LF4 0.18 0.27 122 0.093 0.75 6300 24 588 11◦ 10◦
LF5 0.21 0.27 129 0.088 0.81 7200 27 635 14◦ 11◦
LF6 0.24 0.27 127 0.090 0.80 7000 27 628 13◦ 11◦
1.4 Results
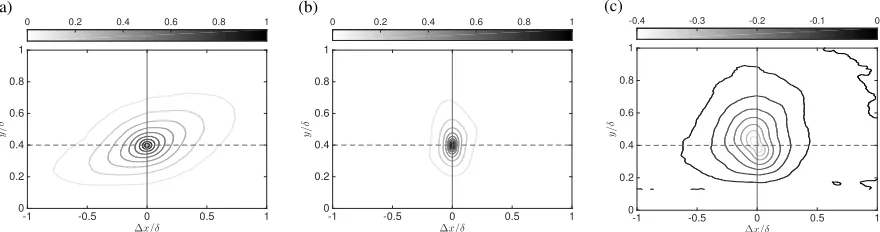
As [1] and [15] pointed out, one looks at the streamwise velocity correlations to infer information about the structure of the turbulence (i.e. vortex packets). Figure 1.1(a)shows contours of the two-point correlations of the streamwise fluctuating velocity,Ru0u0. A forward-leading structure of positive correlation is shown revealing a large-scale struc-ture coherency consistent with imprint of packets [1]. The correlations are inclined toward the flow direction. Here an example is shown for the LF4 case with the correlation centred atyre f =0.4δ. However, this is representative
of all the other cases and similar conclusions can be drawn when alternative wall-normal locations are considered. The inclination angle of these structures can be inferred, following [6], by a least-square fit procedure along the points further away from the auto-correlation peak aty=yre f, along different contour lines. The results of this procedure are reported in table 1.1. Inclination angles were found in the range of 10−13◦and a slight sensitivity to the change in surface morphology was noticed, although a clear trend is difficult to infer. The current results are in line with previous findings on both smooth and rough walls investigations, which suggested similar values for the characteristic inclination of the packets [17, 18, 8, 6, 9, 5, 1, 15, 12]. On the contrary, the current results do not seem to suggest that the surface morphology can have a significant influence on the vortex packets inclination, certainly not to the extend some researchers have previously documented [11].
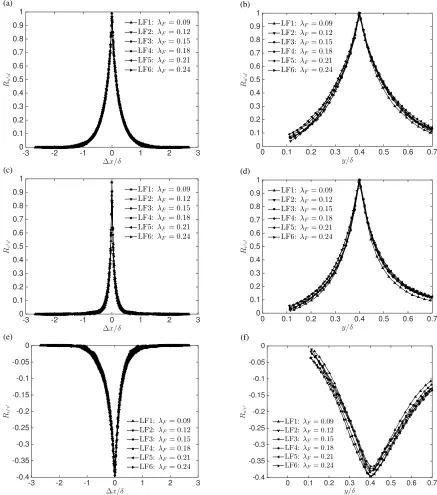
Also reported in figure 1.1(b)are correlations of the wall-normal fluctuations, Rv0v0. These correlation struc-tures are found to be compact in both streamwise and wall-normal directions with an extent that is much lower than forRu0u0. This is consistent with previous findings [17, 18, 8, amongst others]. Finally, two-point correlations of the Reynolds shear fluctuations,Ru0v0, are presented in figure 1.1(c). These are characterised by a backward leaning structure of strong negative correlation, the extent of which is larger than the wall-normal correlation but considerably smaller than the streamwise coherency, as previously reported [17].
conclude, both the consistency in the inclination of the vortex packets and the collapse of all the main correlation cuts across different roughness topologies seem to offer a clear indication that the underlying spatial structures of the turbulence (i.e. vortex packets and their characteristics) are largely unaffected by changes in surface morphology - hence universal. This universality also extend to the smooth wall cases.
∆x/δ
-1 -0.5 0 0.5 1
y
/
δ
0 0.2 0.4 0.6 0.8 1
0 0.2 0.4 0.6 0.8 1
(a)
∆x/δ
-1 -0.5 0 0.5 1
y
/
δ
0 0.2 0.4 0.6 0.8 1
0 0.2 0.4 0.6 0.8 1
(b)
∆x/δ
-1 -0.5 0 0.5 1
y
/
δ
0 0.2 0.4 0.6 0.8 1
-0.4 -0.3 -0.2 -0.1 0
[image:4.612.73.513.139.255.2](c)
Fig. 1.1 Two-point correlation of(a)streamwise,(b)wall-normal and(c)Reynolds shear stress fluctuations. Colorbar represents the normalised correlation coefficient,Ru0u0,Rv0v0andRu0v0. Flow is left to right. Example for LF4.
References
[1] R J Adrian, C D Meinhart, and C D Tomkins. Vortex organization in the outer region of the turbulent boundary layer.Journal of Fluid Mechanics, 442:1–54, December 2000.
[2] M Amir and I P Castro. Turbulence in rough-wall boundary layers: universality issues.Experiments in Fluids, 51:313–326, 2011.
[3] I P Castro. Rough-wall boundary layers: mean flow universality. Journal of Fluid Mechanics, 585:469–485, August 2007.
[4] H Cheng and I P Castro. Near wall flow over urban-like roughness.Boundary-Layer Meteorology, 105:411– 432, June 2002.
[5] K T Christensen and R J Adrian. Statistical evidence of hairpin vortex packets in wall turbulence. Journal of Fluid Mechanics, 431:433–443, February 2001.
[6] K T Christensen, Y Wu, and Y. Characteristics of vortex organization in the outer layer of wall turbulence . In Fourth International Symposium on Turbulence and Shear Flow Phenomena, Williamsburg, Virginia, pages 1025–1030, January 2005.
[7] B Ganapathisubramani, E. K Longmire, and I. Marusic. Characteristics of vortex packets in turbulent bound-ary layers.Journal of Fluid Mechanics, 478:35–46, March 2003.
[8] B Ganapathisubramani and M P Schultz. Turbulent boundary layer structure over sparsely distributed rough-ness. In7th International Symposium on Turbulence and Shear flow phenomena, Ottawa, Canada July 28–31, July 2011.
[9] M R Head and P Bandyopadhyay. New aspects of turbulent boundary-layer structure. Journal of Fluid Mechanics, 107:297–338, November 1981.
[10] J Jimenez. Turbulent flows over rough walls. Annual Review of Fluid Mechanics, 36:173–196, 2004. [11] P A Krogstad and R A Antonia. Structure of turbulent boundary layers on smooth and rough walls. Journal
of Fluid Mechanics, 227:1–21, June 1994.
[12] S Nakagawa, Y Na, and T J Hanratty. Influence of a wavy boundary on turbulence. Experiments in Fluids, 35(5):422–436, November 2003.
[13] M Placidi. On the effect of surface morphology on wall turbulence. PhD thesis, University of Southampton. Engineering and the Environment, April 2015.
[14] R T Reynolds and I P Castro. Measurements in an urban-type boundary layer.Experiments in Fluids, 45:141– 156, February 2008.
[15] C D Tomkins and R J Adrian. Spanwise structure and scale growth in turbulent boundary layers. Journal of Fluid Mechanics, 490:37–74, September 2003.
∆x/δ
-3 -2 -1 0 1 2 3
Ru ′u ′ 0 0.1 0.2 0.3 0.4 0.5 0.6 0.7 0.8 0.9 1
LF1:λF= 0.09 LF2:λF= 0.12 LF3:λF= 0.15 LF4:λF= 0.18 LF5:λF= 0.21 LF6:λF= 0.24
(a)
y/δ
0 0.1 0.2 0.3 0.4 0.5 0.6 0.7
Ru ′u ′ 0 0.1 0.2 0.3 0.4 0.5 0.6 0.7 0.8 0.9 1
LF1:λF= 0.09 LF2:λF= 0.12 LF3:λF= 0.15 LF4:λF= 0.18 LF5:λF= 0.21 LF6:λF= 0.24
(b)
∆x/δ
-3 -2 -1 0 1 2 3
Rv ′v ′ 0 0.1 0.2 0.3 0.4 0.5 0.6 0.7 0.8 0.9 1
LF1:λF= 0.09 LF2:λF= 0.12 LF3:λF= 0.15 LF4:λF= 0.18 LF5:λF= 0.21 LF6:λF= 0.24
(c)
y/δ
0 0.1 0.2 0.3 0.4 0.5 0.6 0.7 Rv ′v ′ 0 0.1 0.2 0.3 0.4 0.5 0.6 0.7 0.8 0.9 1
LF1:λF= 0.09 LF2:λF= 0.12 LF3:λF= 0.15 LF4:λF= 0.18 LF5:λF= 0.21 LF6:λF= 0.24
(d)
∆x/δ
-3 -2 -1 0 1 2 3
Ru ′v ′ -0.4 -0.35 -0.3 -0.25 -0.2 -0.15 -0.1 -0.05 0
LF1:λF= 0.09 LF2:λF= 0.12 LF3:λF= 0.15 LF4:λF= 0.18 LF5:λF= 0.21 LF6:λF= 0.24
(e)
y/δ
0 0.1 0.2 0.3 0.4 0.5 0.6 0.7 Ru ′v ′ -0.4 -0.35 -0.3 -0.25 -0.2 -0.15 -0.1 -0.05 0
LF1:λF= 0.09
LF2:λF= 0.12
LF3:λF= 0.15
LF4:λF= 0.18
LF5:λF= 0.21
LF6:λF= 0.24
[image:5.612.93.530.71.566.2](f)
Fig. 1.2 (Left) Streamwise and (right) wall-normal slices through auto-correlation points of (top)Ru0u0, (centre)Rv0v0and (bottom)Ru0v0 contours as a function ofλF (λP=const=0.27). Solid lines represent the real data resolution whist markers are spaced every five vectors for clarity.
[17] R J Volino, M P Schultz, and K A Flack. Turbulence structure in rough- and smooth-wall boundary layers. Journal of Fluid Mechanics, 592:263–293, November 2007.
[18] R J Volino, M P Schultz, and K A Flack. Turbulence structure in a boundary layer with two-dimensional roughness. Journal of Fluid Mechanics, 635:75–101, September 2009.