City, University of London Institutional Repository
Citation
:
Riaz, A., Alonso, E. and Slabaugh, G. G. (2016). Phenotypic Integrated
Framework for Classification of ADHD using fMRI. In: Image Analysis and Recognition.
ICIAR 2016. Lecture Notes in Computer Science, 9730. (pp. 217-225). Cham: Springer.
ISBN 978-3-319-41500-0
This is the accepted version of the paper.
This version of the publication may differ from the final published
version.
Permanent repository link: http://openaccess.city.ac.uk/14265/
Link to published version
:
Copyright and reuse:
City Research Online aims to make research
outputs of City, University of London available to a wider audience.
Copyright and Moral Rights remain with the author(s) and/or copyright
holders. URLs from City Research Online may be freely distributed and
linked to.
Phenotypic Integrated Framework for Classification of
ADHD using fMRI
Atif Riaz, Eduardo Alonso, Greg Slabaugh
City University London, EC1V 0HB, London, UK {Atif.Riaz, E.Alonso, Gregory.Slabaugh.1}@city.ac.uk
Abstract - Attention Deficit Hyperactive Disorder (ADHD) is one of the most common disorders affecting young children, and its underlying mechanism is not completely understood. This paper proposes a phenotypic integrated ma-chine learning framework to investigate functional connectivity alterations be-tween ADHD and control subjects not diagnosed with ADHD, employing fMRI data. Our aim is to apply computational techniques to (1) automatically classify a person’s fMRI signal as ADHD or control, (2) identify differences in func-tional connectivity of these two groups and (3) evaluate the importance of phe-notypic information for classification. In the first stage of our framework, we determine the functional connectivity of brain regions by grouping brain activi-ty using clustering algorithms. Next, we employ Elastic Net regression to select the most discriminant features from the dense functional brain network and in-tegrate phenotypic information. Finally, a support vector machine classifier is trained to classify ADHD subjects vs. control. The proposed framework was evaluated on a public dataset ADHD-200, and our classification results outper-form the state-of-the-art on some subsets of the data.
Keywords: ADHD, Density Clustering, Affinity Propagation, Elastic Net.
1
Introduction
The brain can be envisioned as a large and complicated network controlling the complex systems of the body. While coordinating bodily function, the brain regions continuously share information, and regions exhibiting temporal correlation are said to be functionally connected. Research studies have shown that neurological disorders such as Alzheimer’s disease, epilepsy, ADHD can alter the functional connectivity of the brain network [1], [2]. Accurate identification of altered functional connectivity induced by a neurological disorder is thus an important task and may highlight the underlying mechanism of the disorder. Recently, resting state functional MRI (fMRI) has emerged as a promising neuroimaging tool to investigate functional activity of brain regions. In particular, fMRI has been employed to identify the connectivity alterations induced by neurological disorders such as epilepsy, schizophrenia, and ADHD.
mecha-nism underlying ADHD is still unknown [4]. ADHD has received significant research focus, including studies employing fMRI to investigate functional connectivity altera-tions in ADHD: [5] proposed a functional-anatomical discriminative region model for the identification of discriminant features and pattern classification of ADHD, and evaluated Elastic Net [6] based feature selection. Dey et al. [4] employed attributed graph distance measures for classification of ADHD, and similarly [1] investigated different graph based measures to assess their discriminative power. Tabas et al. [7] proposed a variant of Independent Component Analysis (ICA) to characterize the differences between control and patients, employing fMRI data. The studies show encouraging results, and demonstrate that machine learning techniques hold promise for the analysis of neuroimaging data.
In this paper, our motivation is to study functional connectivity alterations induced by ADHD. However, unlike previous work that relies on the image data alone, we integrate phenotypic data (such as age, gender, and IQ scores) in our machine learning framework to identify discriminant features to classify individuals as ADHD or non-ADHD (control). Our framework has several stages. In the first stage, the functional connectivity between brain regions is determined using the Affinity Propagation (AP) clustering algorithm [8]. Instead of requiring number of clusters in advance, AP takes a measure of similarity between data points and initial preference for each point for being cluster centroid. We propose a novel method to find these cluster centroids through a matrix derived from the Density Peaks (DP) algorithm by Rodriguez and Laio [9]. To our knowledge, this is the first paper to apply DP for classification of fMRI. Next, we select discriminant features through Elastic Net (EN) regression, which combines shrinkage with grouped selection of variables. Finally we employ a support vector machine classifier to classify between control and ADHD. We demonstrate that the integrated phenotypic information in our framework improves performance.
This work makes several contributions. First, we propose a novel method to ini-tialize the AP clustering algorithm by employing the Density Peaks approach. Sec-ond, we demonstrate the importance of phenotypic information for classification of control vs. ADHD based on functional connectivity between brain regions. In addi-tion, our experimental results outperform the previous state-of-the-art for three test datasets of the publically available ADHD 200 data.
2
Data
has been pre-processed as part of the connectome project [12] and brain is parcellated into 90 regions using the Automated Anatomical Labelling[13] atlas. A more detailed description of the data and pre-processing steps appears in [11]. We have integrated phenotypic information of age, gender, verbal IQ, performance IQ and Full4 IQ, for all sites except from NeuroImage, for which phenotypic information is not available.
3
Methods
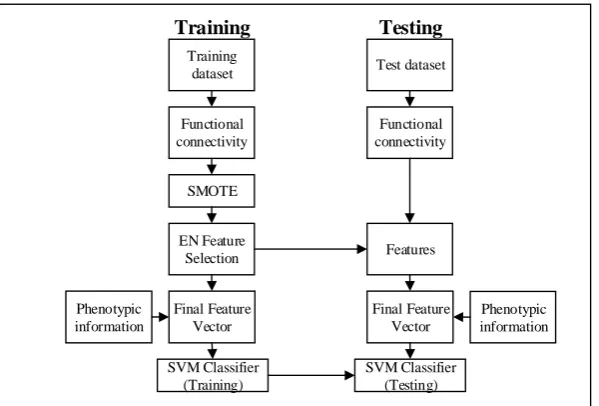
Our framework consists of the following modules: functional connectivity calcula-tion, feature seleccalcula-tion, phenotypic integration and classification. A block diagram of the methodological framework is presented in Figure 1 and described below.
3.1 Dataset balancing: In our study, datasets from two imaging sites are imbal-anced, e.g. for Peking (61 Control vs. 24 ADHD) and for KKI (61 Control vs. 22 ADHD). This imbalance may hamper the performance of a classifier, which may overly focus on the majority class. One approach might be to apply random over-sampling of the minority class or under over-sampling the majority class to balance the training dataset, but these strategies have been shown to have suboptimal performance [14]. Instead, we employ Synthetic Minority Over-sampling Technique (SMOTE) [10] to create synthetic minority samples. Consider 𝐼𝐴∈ 𝐼, where 𝐼 is the total set of
individual subjects, and 𝐼𝐴 is the set of minority ADHD subjects, and we denote an
individual sample in 𝐼𝐴 as 𝒙𝑖. We can synthesize additional minority subjects as
𝒙𝑠= 𝒙𝑖+ (𝒙̂ − 𝒙𝑖 𝑖) × 𝑟 (1)
where 𝒙̂𝑖 is a randomly chosen subject from 𝐾-nearest neighbours of 𝒙𝑖∈ 𝐼𝐴, 𝒙𝑠 is a
synthetic subject and 𝑟 is random number such that 𝑟 ∈ [0,1].
3.2 Functional connectivity: Functional connectivity can be estimated by corre-lation of time-domain signals [1], [4], as well as clustering [2], [15]. We propose a hybrid framework which employs Affinity Propagation (AP) clustering [8] and the Density Peaks (DP) algorithm [9] for functional connectivity estimation.
𝑎(𝑖, 𝑗) = 0 (2)
and the responsibility is calculated as
𝑟(𝑖, 𝑗) = 𝑆(𝑖, 𝑗) − max
𝑗′,𝑗′≠𝑗 {𝑎(𝑖, 𝑗
′) + 𝑆(𝑖, 𝑗′)} (3)
with the availability message as
𝑎(𝑖, 𝑗) = min{0, 𝑟(𝑗, 𝑗) + ∑ max{0, 𝑟(𝑖′, 𝑗)}
𝑖′, 𝑖′≠{𝑖,𝑗} } (4)
where
𝑆
in Equation 3 is the similarity measure between brain regions which is ini-tialized as𝑆(𝑖, 𝑗) = −√∑ ((𝑖𝑘− 𝑗𝑘)2
𝜎𝑘2 ) 𝑡
𝑘=1 (5)
where 𝜎𝑘 is the standard deviation of 𝑘𝑡ℎ dimension and 𝑡 is the time points of
re-gions. Instead of requiring an initial guess for number of clusters, the AP clustering algorithm requires a preference value 𝑝 assigned for each region as the initial proba-bility of being a cluster centroid. Selection of the preference value impacts the num-ber of clusters produced [8], [15]. The value may be assigned to be median or mini-mum of similarities [8]. However, in this study we propose a novel method to initial-ize the preference value. We propose to estimate this initial strength for each region as being cluster centroid through the Density Peaks algorithm [9]. The density peak al-gorithm proposes that the cluster center can be identified as the points that have high-er local density and are at larghigh-er distance from points with highhigh-er density. We initial-ize the preference for each region as
𝑝(𝑖) = 𝜌𝑖 𝛿𝑖−min(𝜌𝑖 𝛿𝑖)
max(𝜌𝑖 𝛿𝑖)−min (𝜌𝑖 𝛿𝑖) × (𝑁 − 1) + 𝑐 (6)
where 𝑁 = 90, 𝑐 = 𝑁/6 , 𝜌𝑖 is the density of region 𝑖 calculated as
𝜌𝑖= ∑ 𝑓(𝑑𝑁𝑗 𝑖𝑗− 𝑑𝑐) (7)
where 𝑑𝑐 is a cut-off distance controlling the number of neighbors of 𝑖, and 𝑓 is
𝑓(𝑥) = {1, 𝑖𝑓 𝑥 < 0
0, 𝑜𝑡ℎ𝑒𝑟𝑤𝑖𝑠𝑒 (8)
and 𝛿𝑖 is calculated as
𝛿𝑖= min𝑗:𝜌
𝑗>𝜌𝑖𝑑𝑖𝑗 (9)
After initializing 𝑝, the availability and responsibility messages are updated, until robust clusters and their centroids emerge. From the AP clustering algorithm results, we construct a matrix 𝑀 as
𝑀
𝑙(𝑖, 𝑗)
={
1, 𝑖𝑓 𝑖 𝑎𝑛𝑑 𝑗 𝑎𝑟𝑒 𝑖𝑛 𝑠𝑎𝑚𝑒 𝑐𝑙𝑢𝑠𝑡𝑒𝑟Training dataset
SMOTE Functional connectivity
EN Feature Selection
Final Feature Vector Phenotypic
information
SVM Classifier (Training)
Test dataset
Functional connectivity
Features
Final Feature Vector
Phenotypic information
SVM Classifier (Testing)
Training Testing
Fig. 1. Flowchart of proposed framework.
The cut-off distance 𝑑𝑐 in Equation 7 impacts clustering by varying the preference value computed in Equation 6, yielding different clustering results. To address this issue, the AP clustering algorithm is run multiple times to yield multiple 𝑀 matrices, with varying 𝑑𝑐 so that the average number of neighbors is around 2% to 8% of the total number of points. Through these multiple runs of clustering, we produce 𝐾 num-ber of 𝑀 matrices and calculate a functional connectivity matrix
,
𝐹𝐶(𝑖, 𝑗) = 1𝐾∑𝐾𝑙=1𝑀𝑙(𝑖, 𝑗) (11)
This matrix represents the functional connectivity of a subject, such that each entry in
𝐹𝐶(𝑖, 𝑗) represents an estimate of probability that the 𝑖𝑡ℎand 𝑗𝑡ℎ regions belong to the same functional connectivity. The constructed functional connectivity matrix of Equa-tion 11 has a dimensionality of 4005 (90 × 90/2) unique features. The high dimen-sion of the matrix may degrade the performance of classifier (the well known “curse of dimensionality” problem). Therefore, there is a need to select discriminant features.
3.3 Discriminant feature selection: The functional connectivity matrix may contain highly correlated features. We therefore investigate Elastic Net (EN) based feature selection [6] for extracting discriminant features. EN is an embedded based feature selection algorithm that encourages grouped selection of features and takes advantage of both lasso and ridge regression by combining their penalties in one sin-gle solution. Similar to lasso, the 𝐿1penalty is employed to enable variable selection
and continuous shrinkage, and the 𝐿2 penalty is combined to encourage selection of
correlated features. If 𝒚 is the label vector for subjects, 𝑦𝑖 ∈ (𝑙1, 𝑙2, … 𝑙𝑛) , and 𝑿 =
[image:6.595.155.455.147.350.2]𝐿(𝜆1, 𝜆2, 𝛽) = ||𝒚 − 𝑿 𝜷||2+ 𝜆1|| 𝜷||1+ 𝜆2|| 𝜷||2 (12)
where 𝜆1 and 𝜆2 are weights of the terms forming the penalty function and 𝜷 coef-ficients are estimated by model fitting. By minimizing 𝐿 in Equation 12, we extract the features that have non-zero coefficients with minimum error during cross valida-tion using a training set. In order to evaluate phenotypic informavalida-tion for classificavalida-tion, we integrate phenotypic information with the selected features to formulate a com-bined feature set that can be evaluated for classification, as described in the next sub-section
.
3.4 Classification: The next step in our study is classification where we employ a Support Vector Machines (SVM) classifier to evaluate the discriminative ability of the selected features. SVM is a popular machine learning classifier and has been suc-cessfully evaluated in a number of neuroimaging studies (e.g., [2], [15]). It seeks an optimal margin between the two classes (control and ADHD) during training, using labeled training data (1 for control, 2 for ADHD). The learned model is then em-ployed for testing by presenting unseen testing data. The SVM classifier then predicts the label (control or ADHD) for each test subject
.
4
Experimentation and results
The proposed framework was evaluated on a dataset provided by the ADHD-200 consortium, and contains four categories of subjects: controls, ADHD-Combined, ADHD-Hyperactive/Impulsive, and ADHD-inattentive. Here we propose a binary classification problem: controls vs. ADHD, by combining all ADHD subtypes in one category, since we want to investigate differences and classification between control and ADHD.
We train the SVM classifier on training data employing selected features and phe-notypic information as mentioned above. SMOTE was applied on Peking and KKI datasets to address the data imbalance issue described earlier. The trained SVM clas-sifier was tested with independent test data for each individual site, and results are presented in Table 1, which also provides results with the results of competition teams (reported from NITRC [11]) and highest accuracy achieved by teams in individual imaging sites (data from [5]). It should be noted that parameters of our framework are held constant for all the datasets.
For evaluation of our proposed novel methodology to initialize the AP clusters as discussed in Section 3.1, we compared our results with standard AP clustering results presented in Table 3.
Table 1. : Comparison of our results with average results of competition teams [11] and highest accuracy achieved for individual site [5].
Name Average results of
competition teams
Highest accuracy (data by [5])
Accuracy achieved by our methodolo-gy
Peking
51.05% 58% 65%KKI
43.18% 81% 82%NYU
32.33% 56% 61%NI
56.95% -- 44%Table 2. : Results with and without integrating phenotyping information.
Name With phenotyping Without phenotyping
Peking 64.7% 58.8%
KKI
81.8% 81.8%NYU
61.0% 24.3%Table 3 shows that our proposed methodology is able to achieve better accuracy than AP clustering in all imaging sites.
Table 3. Comparison of our proposed methodology with AP results. Results show that our proposed methodology achieves better accuracy than AP clustering.
Name Proposed Methodology AP Clustering
Specificity Sensitivity Accuracy Specificity Sensitivity Accuracy
Peking
92.59% 33.33% 64.71% 81.48% 33.33% 58.82%KKI
75.00% 100.00% 81.82% 87.50% 33.33% 72.73%NYU
41.67% 68.97% 60.98% 41.67% 62.07% 56.10%NI
42.86% 45.45% 44.00% 7.14% 63.64% 32.00%5
Conclusions
[image:8.595.126.472.207.298.2]un-correlated feature selection. In this work, we have evaluated importance of phenotypic information by integrating with selected features. Our results show that Elastic Net based feature selection integrated with phenotypic information may provide an im-portant feature selection strategy. Our selected features and SVM classifier was able to outperform the state-of-the-art in classification accuracy on data from three institu-tions. In future work we will explore the clinical interpretation of the functional con-nectivity alterations produced in our framework, particularly in light of the phenotyp-ic information.
6
References
[1] A. dos Santos Siqueira et al. “Abnormal functional resting-state networks in ADHD: graph theory and pattern recognition analysis of fMRI data,” Biomed Res. Int., vol. 2014, 2014.
[2] A. Riaz et al. “A connectivity difference measure for identification of functional neuroimaging markers for epilepsy,” in Neural Engineering (NER), 2013 6th International IEEE/EMBS Conference on, 2013, pp. 1517–1520. [3] J. Biederman, “Attention-deficit/hyperactivity disorder: a selective overview,”
Biol. Psychiatry, vol. 57, no. 11, pp. 1215–1220, 2005.
[4] S. Dey, A. R. Rao, and M. Shah, “Attributed graph distance measure for automatic detection of attention deficit hyperactive disordered subjects.,”
Front. Neural Circuits, vol. 8, no. June, p. 64, 2014.
[5] M. Nunez-Garcia et al., “FADR: Functional-Anatomical Discriminative Regions for Rest fMRI Characterization,” vol. 9352, pp. 61–68, 2015. [6] T. H. Hui Zou, “Regularization and Variable Selection via the Elastic Net,” J.
R. Stat. Soc. Ser. B (Statistical Methodol., vol. 67, no. 2, pp. 301–320, 2005. [7] A. Tabas, et al., “Spatial discriminant ICA for RS-fMRI characterisation,”
Proc. - 2014 Int. Work. Pattern Recognit. Neuroimaging, PRNI 2014, pp. 0–3. [8] B. J. Frey and D. Dueck, “Clustering by passing messages between data
points,” Science (80-. )., vol. 315, no. 5814, pp. 972–976, 2007.
[9] A. Rodriguez and A. Laio, “Clustering by fast search and find of density peaks,” Science (80-. )., vol. 344, no. 6191, pp. 1492–1496, 2014.
[10] N. V Chawla et al. “SMOTE: synthetic minority over-sampling technique,” J. Artif. Intell. Res., pp. 321–357, 2002.
[11] “The ADHD-200 Sample.” [Online]. Available: http://fcon_1000.projects.nitrc.org/indi/adhd200/.
[12] “Preporcessed Connectome Project.” [Online]. Available:
http://neurobureau.projects.nitrc.org/ADHD200/Introduction.html.
[13] N. Tzourio-Mazoyer et al. “Automated anatomical labeling of activations in SPM using a macroscopic anatomical parcellation of the MNI MRI single-subject brain,” Neuroimage, vol. 15, no. 1, pp. 273–289, 2002.
[14] H. He and E. A. Garcia, “Learning from imbalanced data,” Knowl. Data Eng. IEEE Trans., vol. 21, no. 9, pp. 1263–1284, 2009.
![Table 1. :highest accuracy achieved for individual site [5]Name Comparison of our results with average results of competition teams [11] and](https://thumb-us.123doks.com/thumbv2/123dok_us/1457785.98469/8.595.126.472.207.298/highest-accuracy-achieved-individual-comparison-results-average-competition.webp)
